Optimization Techniques for Congestion
Management using Facts Devices
R.Rajesh,K.Elango
Abstract: Congestion management is the technical challenge in a Deregulated environment. powerregion leads to overloading of transmission sector due to high demand of customers. Tosatisfy the demand of power, generation companies produce more power, however transmission line sector are the conventional ones, and they get congested and transmit more power than its capacity. This caused the congestion on transmission sector. FACTS can be capable to mitigate the effect of congestion in heavily loaded lines. This paper examines the outcome of UPFC will changes reactance of transmission and thus controls power flow over that line, leads to decreasing congestion. The efficiency of these FACTS devices are established on modified IEEE14 Bussystems ‘and thePSO techniques use to discover the optimal location of the UPFC
Keywords: FACTS, Congestion management, UPFC, Particle swarm optimization, optimal location,
I. INTRODUCTION
Transmission line congestion following there isa lacking on transmission line capacity to concurrently contain all requirements for line sector service within an area. Previously, vertically included efficacies managed this situation by making the economic dispatch of generators with the objective of confirming security andconsistency of their own andneighbouring systems. Electric power manufacturingreformation has developed generation share and processeschoices into the economical market but has left transmission sector as a commonsource in the measured environment. The trouble is compounded by growths in the expanse of congestion resultant from better commercial transactions and the comparative decline in the amount of transmission. In all regions of united states, the transmission line capacity, relative to peak load, has been declined. [10] Congestion management systems used nowadays have create a negative impact on energy markets, such as instabilities and economic penalties, under approximatelysurroundings. To alleviate these distressesseveral congestion management systems have been suggested, with dispatch and curtailment of scheduled power transmission. This paper initial presents an impression and background on key issues and developing approaches to congestion management. It goes on to organize and label policies distressing congestion management that are favoured and are now as being measuredand one of the regional consistency councils (WSCC). It reviews the operational measures in use or suggested by three of the foremost independent system
Revised Manuscript Received on December 05, 2019.
R.Rajesh, PG Scholar, Power System Engineering, SRM Valliammai Engineering College,Kattankulathur, Chennai-603203
K.Elango, (Professor & Head),Department of EEE,SRM Valliammai Engineering College, Kattankulathur, Chennai-603203.
operators (ISOs) with ERCOT, California ISO, and PJM. Finally, it presents references for appraising the competing alternative approaches anddeveloping metrics.As with any statementregarding electricity restructuring, exactparticulars quickly become dated. Individual values, states and areas will unavoidablyvariation rules and actions even during the time it takes to report. Optimistically, the general decisions are more strong and this report will continue to have value even after some of the specific details have altered. [1]FACTS can giveplannedturnover for transmission line system management through wellservice of present transmission services by increasing system dependability and stability [2]. Flexible AC Transmission Systems have been widely employed toenhance system stability and load ability. However, its specifiedthe efficiency of the controls for dissimilardeterminations mainly depends on the location of FACTS[4]. There is a some ofapproaches for discovery optimal placementof FACTSin both vertically unified and unbundled power sector [3]. A sensitivity methodologyconstructed for line loss has been suggested for location of STATCOM and SVC. Other works in optimal power flow with FACTS [5,7] have used optimisation with dissimilar objective functions.In this paper is shows that suitablepositionof UPFC can recognizedto use line loss sensitivity. PSO methods are independentlypractical to completeleast active power loss while sufficient of power system limits. The method has been implemented andverified under simulated condition on IEEE modified Fourteen bus system.by using PSAT Tool Box in MATLAB.
II. MATHEMATICAL MODELING OF UPFC
Fig.1. Basic Model of UPFC
UPFC is use to reduce the congestion in lineby controlling the bus voltage and concurrently adjustingactive and reactive power.
𝐼𝑖 = 𝐼𝑇+ 𝐼𝑞+ 𝐼𝑖′… … … . 1
𝐼𝑇=
𝑅𝑒 𝐼𝑇× 𝐼′ ∗
𝑉𝑖
… … … … … … … . 2
𝑉𝑖 = 𝑉𝑇+ 𝑉𝑖+ ⋯ … … … 3
Fig.2. UPFC injection model.
The reactive and real power injections at bus (i, j) with a unit connected in lineij can be expressed as
𝑆𝑖𝑗 = 𝑃𝑖𝑗 + 𝑗𝑄𝑖𝑗 = 𝑉𝑖× 𝐼𝑖𝑗 = 𝑉𝑖× 𝐼𝑖+
𝑗𝑉𝑖𝐵
2 … . . (4)
𝑆𝑗𝑖 = 𝑃𝑗𝑖 + 𝑗𝑄𝑗𝑖 = 𝑉𝑗× 𝐼𝑗𝑖 = 𝑉𝑖×
𝑗𝑉𝑖𝐵
2 − 𝐼𝑖
… … … . (5)
power injection methodology has been proposed for static modelling of FACTS. While there are someFACTS are used to voltage profile and monitoring power flow in the system, only the UPFC can measured. finger. 2 shows that modest
transmission sectorrepresent by its
lumpedcorrespondinglimitslinkedbetween bus-i &j. Let the difficultvoltages at bus-i &j be denoted by 𝑉𝑖∠𝛿𝑖 andn
𝑉𝑗∠𝛿𝑗, respectively.
𝑃𝑖𝑗 = 𝑉2𝑖𝐺𝑖𝑗 − 𝑉𝑖𝑉𝑗[𝐺𝑖𝑗cos 𝛿𝑖𝑗 + 𝐵𝑖𝑗sin(𝛿𝑖𝑗)] … … … (6)
where𝛿𝑖𝑗 = 𝛿𝑖− 𝛿𝑗. Similarly, the real power from bus-j to
bus-i (Pji ) is
𝑄𝑗𝑖 = −𝑉2𝑗𝐺𝑖𝑗− 𝑉𝑖𝑉𝑗[𝐺𝑖𝑗cos 𝛿𝑖𝑗 − 𝐵𝑖𝑗sin(𝛿𝑖𝑗)] … … (7)
Where 𝐵, 𝑔𝑖𝑗,𝑏𝑖𝑗,𝑃𝑖j,𝑄𝑖j, are line indicting admittance, line conductance (ij), line susceptance(ij), active and reactive power injections at bus i and bus j, congruently.
III. PROBLEM FORMULATION
In this directive to decide the position of facts, the method is suggested based on identify thebranch and buswhich are the maximum complex and active with respect to voltagesafety improvement and congestion improvementfor thehuge list of particular contingency.There are two objective functions considered in this suggested method. The first objective is to minimize generation cost of the line flow within transmission capability limit in order to reduce transmission congestion. The another objective is use to minimize fixing of UPFC. Cost functions of UPFC [9]. In addition to reducing previous objectives, lowest load margin is also incorporated as limit.
𝐹𝐶 = 𝑎𝑖𝑃2𝐺𝑖+ 𝑏𝑖𝑃𝐺𝑖 𝑁𝐺
𝑖=𝑙
+ 𝑐𝑖… … … . . . (8)
𝑃𝐺𝑖− 𝑃𝐷𝑖 = 𝑉𝑖 𝑁
𝑗 =1
𝑉𝑗 𝑌𝑖𝑗 cos( 𝛿𝑖− 𝛿𝑗− 𝜃𝑖𝑗) … … … (9)
𝑄𝐺𝑖− 𝑄𝐷𝑖 = 𝑉𝑖 𝑁
𝑗 =1
𝑉𝑗 𝑌𝑖𝑗 cos( 𝛿𝑖− 𝛿𝑗− 𝜃𝑖𝑗) … … … (10)
The following equation is for power injection of real and reactive power at every bus are consider as zero. Where the active (Pgi)and reactive (Qgi)power generation vectors at bus gi, respectively compensation limit.
𝑃𝑖𝑚𝑖𝑛 ≤ 𝑃𝑔𝑖 ≤ 𝑃𝑖𝑚𝑎𝑥 , 𝑄𝑖𝑚𝑖𝑛 ≤ 𝑄𝑔𝑖 ≤ 𝑄𝑖𝑚𝑎𝑥 … … … (11)
𝑉𝑖𝑚𝑖𝑛 ≤ 𝑉𝑖 ≤ 𝑉𝑖𝑚𝑎𝑥 , 𝑆𝑖𝑚𝑖𝑛 ≤ 𝑆𝑖≤ 𝑆𝑖𝑚𝑎𝑥… … … (12)
The UPFC cost for practical optimal placement of upfc, its advised to also consider their instalment costs in the OF[11]
𝐶𝑈𝑃𝐹𝐶 = 0.0003𝑆2𝑈𝑃𝐹𝐶− 0.2691𝑈𝑃𝐹𝐶 + 188.22………… (13)
Where 𝐶𝑈𝑃𝐹𝐶 and𝑆𝑈𝑃𝐹𝐶 are
(US$/kVar) and size (MVar) of UPFC.
IV. PSO OPTIMIZATION TECHNIQUE
Particle Swarm Optimization techniques is going to the classification of Swarm Intelligence approaches [13,14]. It‟s a population based techniques thatactivities a population of characters to analysiscapableareas of the examine space. In this environment, the swarm is knowing as populationand the personalities are now as elements. In each and every repetition, the velocity vector is used to the Pbest locations cognitive feature and the finestlocations found by the particles within a definite neighbourhood.
𝑉𝑖𝑗𝑘+1= 𝑤∗𝑉𝑖𝑗𝑘+ 𝐶1∗𝑟𝑎𝑛𝑑()∗ 𝑝𝑏𝑒𝑠𝑡𝑖𝑗𝑘 − 𝑋𝑖𝑗𝑘
+ 𝐶2∗𝑟𝑎𝑛𝑑()∗ 𝑔𝑏𝑒𝑠𝑡𝑖𝑗𝑘 − 𝑋𝑖𝑗𝑘 … . 14
𝑋𝑖𝑗𝑘+1= 𝑋𝑖𝑗𝑘+ 𝑉𝑖𝑗𝑘+1… … … . … (15)
Wherethe particle index is (i), measurement is (j), (k) is the iteration count, C1 & C2 are now as acceleration coefficients and rand() generates chance count uniformly dispersed within the interval limit (0,1). Hence we proposed methodology within the measurethe particles are not concurrently affected by the Pbest and the Gbest. the suggested movement, let Pi is the possibilityrelated within the ith particle, where (0 ≤ Pi ≤ 1) and is randomly generated. Let Pmov be the movement possibility, defined as (0 ≤ Pmov ≤ 1)is kept at a proper value throughout the program. [12]
For Pi < Pmov
𝑉𝑖𝑗𝑘+1= 𝑤∗𝑉𝑖𝑗𝑘+ 𝐶1∗𝑟𝑎𝑛𝑑()∗ 𝑝𝑏𝑒𝑠𝑡𝑖𝑗𝑘 − 𝑋𝑖𝑗𝑘 … … … … (16)
For Pi >Pmov
𝑉𝑖𝑗𝑘+1 = 𝑤∗𝑉
𝑖𝑗𝑘+ 𝐶2∗𝑟𝑎𝑛𝑑()∗ 𝑔𝑏𝑒𝑠𝑡𝑖𝑗𝑘 − 𝑋𝑖𝑗𝑘 … … … … (17)
[image:3.595.312.544.50.139.2]This phaseresolves the amount of particles, characterizedthe population size, located in the constrained clarificationspace. for each particle the random number P is generated 0<Pi<1. This Pi is related with this probability Pmov. Pi > Pmov, a program towards Pbest is done and (Pi < Pmov) a program towards the Gbest is carried out. Thefactors of the PSO algorithm are recognized through techniques are trial and error and theparameters are listed below
TABLE I: Parameters of PSO
PARAMETERS PSO
Population 20
Weighingfactor (W) 0.9-0.4
Dimension 4
Max iteration 500
C1 2
C2 2
𝑊 = 𝑊𝑚𝑎𝑥 −
𝑊𝑚𝑎𝑥 − 𝑊𝑚𝑖𝑛
𝑖𝑡𝑒𝑟𝑚𝑎𝑥 ∗ 𝑖𝑡𝑒𝑟 … … … . (18)
PSO develops [Pbest,Gbest] to change the current explorationopinion to eliminate the elements moving the
equalbearing, but to meetslowlytowardsthe
[Pbest,Gbest]Properrange of inertia weight W provide stability between universal and local surveys. Generally, W can be dynamically set with the following equation.
V. SIMULATION AND RESULT
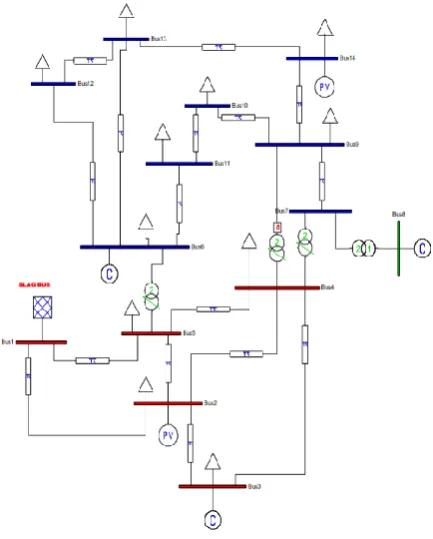
The simulation study was done by using PSAT tool box is shown below. The modified IEEE Fourteen Bus system consists of 6 generating units, 14 transmission lines, 4 transformersand 11 static load. The 100 MVA is considered as a base and 69kv as a base voltage, the voltage magnitude is 0.9(p.u). to 1.1(p.u). and the phase angle is -45o to +45o. first
case run the power flow for base case data and compare the line flow result with MVA rating to find the congested line.
Fig.3. PSAT Model of IEEE Modified Fourteen Bus System
The modified IEEE Fourteen Bus System with optimal placement of UPFC. The optimal placement was obtained by using PSO algorithm and the voltage profile and line flow comparison tables are shown below
[image:3.595.322.539.368.638.2]TABLE II: Comparison of Voltage Profile
Fig.4. PSAT Model of Modified 14 Bus System with UPFC
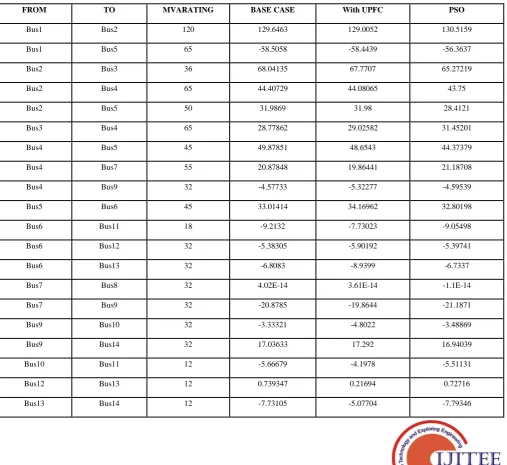
TABLE III: Line Flow Reactance Comparison
BUS BASE CASE With UPFC PSO
1 1.06 1.06 1.06
2 1.044907 1.045 1.040707
3 1.01 1.01 1.01
4 1.010565 1.012725 1.018156
5 1.014085 1.015732 1.018623
6 1.049933 1.053646 1.053251
7 1.032141 1.038186 1.037603
8 1.071593 1.077424 1.076861
9 1.007595 1.015715 1.011977
10 1.005919 1.013404 1.010158
11 1.020134 1.025894 1.023958
12 1.031574 1.035186 1.034503
13 1.026932 1.029804 1.029513
14 1.06 1 1
FROM TO MVARATING BASE CASE With UPFC PSO
Bus1 Bus2 120 129.6463 129.0052 130.5159
Bus1 Bus5 65 -58.5058 -58.4439 -56.3637
Bus2 Bus3 36 68.04135 67.7707 65.27219
Bus2 Bus4 65 44.40729 44.08065 43.75
Bus2 Bus5 50 31.9869 31.98 28.4121
Bus3 Bus4 65 28.77862 29.02582 31.45201
Bus4 Bus5 45 49.87851 48.6543 44.37379
Bus4 Bus7 55 20.87848 19.86441 21.18708
Bus4 Bus9 32 -4.57733 -5.32277 -4.59539
Bus5 Bus6 45 33.01414 34.16962 32.80198
Bus6 Bus11 18 -9.2132 -7.73023 -9.05498
Bus6 Bus12 32 -5.38305 -5.90192 -5.39741
Bus6 Bus13 32 -6.8083 -8.9399 -6.7337
Bus7 Bus8 32 4.02E-14 3.61E-14 -1.1E-14
Bus7 Bus9 32 -20.8785 -19.8644 -21.1871
Bus9 Bus10 32 -3.33321 -4.8022 -3.48869
Bus9 Bus14 32 17.03633 17.292 16.94039
Bus10 Bus11 12 -5.66679 -4.1978 -5.51131
Bus12 Bus13 12 0.739347 0.21694 0.72716
[image:4.595.47.555.342.807.2]Fig.5. Voltage Magnitude
Fig.6. Line Flow Reactance
VI. CONCLUSION
This project has proposed the cost free congestion management method required for smooth operation of deregulated power system. The cost free method using UPFC the remedy for congestion by enhancing the active power flow capability of transmission line. The modified IEEE Fourteen Test system was taken and it was built usingMATLAB-PSAT software. The power flow has run for base case without UPFC. In this paper, the optimumlocation of UPFC for enhancing the safety of power systems by alleviate the congestion underparticular line contingencies has been investigated. A PSO technique is use effectivelytosolve the difficultunder consideration. Mitigation of congestion is measured as the optimization condition.
REFERENCES
1. B.J.Kirby, J.W.Van “Dyke,CongestionManagement
Requirements,Methods and Performance Indices”June 2002. 2. Ghamgeen,LRashed,Yuanzhang Sun and H.LShaheen, “Optimal
Location of Thyristor Controlled Series Compensation in a Power System Based on Differential Evolution Algorithm Considering Transmission Loss Reduction”, Proceedings of the 8world congress on intelligent control and automation, June 2011, pp.610-616. 3. Preedavichit.P, S.C.Srivastava, “Optimal reactive power dispatch
considering FACTS devices”, Electric Power Systems Research, Vol. 46, No. 3, September 1998, pp. 251-257.
4. Okamoto.H, Kurita.A, and Sekine.Y, “A method for identification of effective locations of variable impedance apparatus on enhancement of steady-state stability in large-scale power systems”, IEEE Trans,Power System, 10,3 1995,1401–1407.
5. J.A.Momoh , J.Z.Zhu, „„A new approach to Optimal Power flow with phase shifter”, IEEE Intemational Conference on Systems, Man,and Cybemetics, Vol. 5, 1998, pp. 4794-4799.
6. Majumder Subrata, Chakraborty A.K. and Chattopadhyay P.K., “Active Power Loss Minimization with FACTS Devices Using SA/PSO Techniques” (ICPS'09), International Conference on Power Systems, December 2009, pp. I-5.
7. G.Huang, S.C.Hsieh, “Fast textured algorithms for optimal delivery problems in deregulated environments”, IEEE Trans. On Power Systems, Vol. 13, No. 2, May 1998, pp. 493-500.
8. M.Kowsalya, K.K.Ray and D.P.Kothari, "Loss Optimization for Voltage Stability Enhancement Incorporating UPFC Using Particle Swarm Optimization",Journal of Electrical Engineering & Technology, Vol.4, No.4, pp.492-498, 2009.
9. Dhanasekar.P, Dr.K.Elango, “Congestion Management in Power System by Optimal Location And Sizing of UPFC” ,Journal of Electrical and Electronics Engineering , e-ISSN: 2278-1676,p-ISSN: 2320-3331, Volume 6, No. 1 , Jun. 2013, PP 49-53.
10.K.Elango., and S.R.Paranjothi “Power Transmission Congestion Management in Restructured Power System by FACTS Devices, Generation Rescheduling and Load Shedding using Evolutionary Programming” European Journal of Scientific Research,ISSN 1450-216X Vol.56 No.3 ,2011, pp.376-384.
11.Esmin.A, LambertTorres.G and AntonioC.Zambronide Souza, "A Hybrid Particle Swarm Optimization Applied to Loss Power Minimization",IEEE Trans. On Power Systems, Vol. 20, No. 2, May2005.
12.M.T. Ameli,S. Hashemi, “Optimal Location of UPFC for Enhancing Voltage Security and Relieving Congestion Using Particle Swarm Optimization” 2010 Second Pacific-Asia Conference on Circuits, Communications and System ,978-1-4244-7968-91101,©2010 IEEE 13.J.Kennedy,R.Eberhart, “Particle Swarm Optimization”, in
International Conference on Neural Networks IEEE, Vol. 4,2005, pp1942-1948,
14.A.P.Engelbrecht, ”Particle Swarm Optimization: Where does it belong?”, in SwarmIntelligence Symposium IEEE, May-2006,pp48-54,.
0.95 1 1.05 1.1
1 2 3 4 5 6 7 8 9 10 11 12 13 14
BASE CASE With UPFC PSO
0 50 100 150
2 5 3 4 5 4 5 7 9 6 11 12 13 8 9 10 14 11 13 14
1 1 2 2 2 3 4 4 4 5 6 6 6 7 7 9 9 10 12 13
AUTHORS PROFILE
Mr.R.Rajesh, PG Scholar, Power System Engineering, SRM Valliammai Engineering College,Kattankulathur, Chennai-603203
Dr.K.Elango M.E. Ph.D.,