Open Access
Review
Assembling a global database of malaria parasite prevalence for the
Malaria Atlas Project
Carlos A Guerra*
1,2, Simon I Hay
1,2, Lorena S Lucioparedes
1,
Priscilla W Gikandi
2, Andrew J Tatem
1,2, Abdisalan M Noor
2and
Robert W Snow
2,3Address: 1Spatial Ecology and Epidemiology Group, Department of Zoology, University of Oxford, Tinbergen Building, South Parks Road, Oxford,
OX1 3PS, UK, 2Malaria Public Health & Epidemiology Group, Centre for Geographic Medicine, KEMRI-Wellcome Trust-Collaborative Programme,
Kenyatta National Hospital Grounds, P.O. Box 43640-00100 Nairobi, Kenya and 3Centre for Tropical Medicine, John Radcliffe Hospital,
University of Oxford, Oxford, OX3 9DS, UK
Email: Carlos A Guerra* - [email protected]; Simon I Hay - [email protected];
Lorena S Lucioparedes - [email protected]; Priscilla W Gikandi - [email protected];
Andrew J Tatem - [email protected]; Abdisalan M Noor - [email protected]; Robert W Snow - [email protected]
* Corresponding author
Abstract
Background: Open access to databases of information generated by the research community can synergize individual efforts and are epitomized by the genome mapping projects. Open source models for outputs of scientific research funded by tax-payers and charities are becoming the norm. This has yet to be extended to malaria epidemiology and control.
Methods: The exhaustive searches and assembly process for a global database of malaria parasite prevalence as part of the Malaria Atlas Project (MAP) are described. The different data sources visited and how productive these were in terms of availability of parasite rate (PR) data are presented, followed by a description of the methods used to assemble a relational database and an associated geographic information system. The challenges facing spatial data assembly from varied sources are described in an effort to help inform similar future applications.
Results: At the time of writing, the MAP database held 3,351 spatially independent PR estimates from community surveys conducted since 1985. These include 3,036 Plasmodium falciparum and 1,347 Plasmodium vivax estimates in 74 countries derived from 671 primary sources. More than half of these data represent malaria prevalence after the year 2000.
Conclusion: This database will help refine maps of the global spatial limits of malaria and be the foundation for the development of global malaria endemicity models as part of MAP. A widespread application of these maps is envisaged. The data compiled and the products generated by MAP are planned to be released in June 2009 to facilitate a more informed approach to global malaria control.
Published: 16 February 2007
Malaria Journal 2007, 6:17 doi:10.1186/1475-2875-6-17
Received: 1 December 2006 Accepted: 16 February 2007
This article is available from: http://www.malariajournal.com/content/6/1/17 © 2007 Guerra et al; licensee BioMed Central Ltd.
Background
In an era dominated by information, the need to digest research findings into public domain data repositories is key to enhancing scientific enquiry [1]. The approach to characterizing the human genome through assemblies of research by numerous groups across the world repre-sented a watershed model for information sharing and accelerated discovery across the life-sciences [2-5]. This philosophy of public access in genetic research has advanced our basic understanding of the malaria parasites [6-9] and the Anopheles gambiae vector [10,11]. Public access models have also been applied to quality assured biological standards and standard operating procedures for laboratory methods [12], the establishment of regis-ters of contemporary protocols for Phase III clinical trials [13] and a broader, donor-led movement, to ensure that findings of funded medical research are published in the open access literature [14-16].
The design, financing and implementation of malaria control demand a quantitative approach to the definition of anti-malarial commodity requirements of populations living under varied malaria transmission risks. The geo-graphic extent of effective intervention coverage and how this relates to the dominant local Anopheles vector species and, in turn, their sensitivity to insecticides, is necessary to design appropriate vector control. Information on the prevalence of drug resistance and population spatial access to medicines is required to devise adequate clinical disease management strategies.
The Mapping Malaria Risk in Africa (MARA) [17] collabo-ration was launched over a decade ago to help provide a geo-positioned series of malariometric data for Africa [18]. MARA succeeded in collating a large private database of independent PR surveys across the continent by the year 2000. The data generated has been used as the basis for many innovative modelling and mapping efforts in Africa [19-26]. A continent-wide map of malaria transmis-sion intensity, however, has not been published and, more importantly, the empirical data on parasite preva-lence has not been made available for public access.
The recently launched Global Health Atlas of the World Health Organization (WHO) [27] aims to provide malaria-related data available to the public. However, the fidelity of the information managed by WHO has been questioned [28]. The database includes misleading entries, such as those for Kenya and Somalia that report only 135 and ten malaria deaths in 2002, respectively [29]. Less than half (22/49) of the malaria endemic coun-tries (MECs) in Africa provided information for the most recent reporting year, 2003; the rest were older. These data are neither reconciled at sub-national scales, nor against
populations at risk of any standard definition of the inten-sity of malaria transmission.
Recent work has also involved the assemblage of histori-cal and contemporary evidence on the distributions of malaria risk and Anopheles vector species into a compen-dium of maps and geographic descriptions of various malaria indicators by region and country [30]. This is a significant contribution to medical intelligence on the global spatial epidemiology of malaria, but lacks consist-ency in the sources of information used to generate the maps and is not structured on the foundations of a sys-tematic search and archive of relevant information in a geo-positioned database. In addition, local efforts to improve spatial information relevant to malaria, while impressive (see, for example, [31] and [32]) do not have a global coverage.
More recently, plans have also been articulated for the construction of a global database on anti-malarial drug resistance [33]. This database aims to include current and historic data on clinical efficacy, in vitro responses of patient isolates to old and new antimalarial drugs, as well as molecular markers of drug resistance in P. falciparum and P. vivax malaria [33]. This initiative was stimulated by the fact that, despite being theoretically available, infor-mation is scattered in publications and across institutions, which makes it relatively difficult to assemble.
Information resources on malaria risk, disease incidence, intervention coverage or drug resistance should have sev-eral key features to maximize their utility for constituents. Data assembly requires a filtering system in which data inclusion rules are clearly defined and some basic stand-ards are set before archiving. These inclusion criteria and any methods used during data collation and data entry need to be scientifically defensible and transparent. Finally, and crucially, databases need to be in the public domain in order to promote the advancement of science and its equitable distribution among contributors.
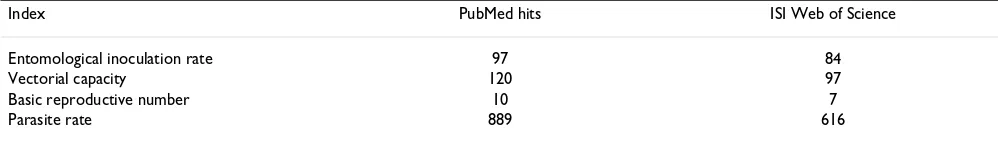
One of the main goals of MAP is to re-assemble contem-porary information on the limits and risk of malaria infec-tion across the 106 current MECs [36,37]. When attempting to describe and ultimately map malaria ende-micity globally, a unifying variable representing malaria risk must be chosen. The characteristics of such a descrip-tor include a global scope, a high frequency of standard-ized sampling, a clear link to the abiotic factors that determine the ecological foundations of malaria risk and a useful representation of the variations in age-specific malaria morbidity and mortality rates. The most com-monly recorded measure of malaria risk remains the par-asite rate (PR). PR surveys are more frequently reported in bibliographic archives than all of the other epidemiologi-cal metrics combined (Table 1). It was, therefore, justified to focus the initial information searches of MAP on the retrieval and archive of PR surveys undertaken across MECs. This paper presents the methods and approaches used to assemble a global database on this key measure of malaria endemicity and risk. It is also a comprehensive documentation and citation source for the data that are destined to become freely available in the public domain in June 2009.
Methods
The MAP collaboration has adopted three linked approaches to identifying empirical PR survey data: a) a traditional electronic search using PubMed [38] with 'malaria' and MEC name as free text rather than Medical Subject Headings terms that tend to be less inclusive; b) direct contact with malaria field scientists, research insti-tutions and control agencies in MECs identified through the PubMed search; and c) an e-mail circular, linked to the launch of the MAP website, to locate sources of informa-tion not readily accessible from the first two search strate-gies.
A number of inclusion rules were imposed for informa-tion identified through the multiple searches (see Addi-tional File 1). These rules have been implemented to ensure spatial independence of data, precision in individ-ual estimates, standardization of parasite detection meth-ods, and avoidance of confounding effects through malaria specific interventions. The aim was also to collect the most contemporary data possible. During the
searches, a review of titles and abstracts was used to elim-inate sources that did not match the inclusion criteria.
Authors of peer-reviewed sources of PR survey data were contacted if: a) additional information was required on the age-ranges; b) multiple community data needed to be disaggregated; or c) specific details on the coordinates or location of the survey data were needed. Additionally, authors were asked if they knew of other unpublished information on parasite surveys undertaken in their coun-try of research. This request was extended to over 100 institutions involved in malaria research and control identified as potentially useful sources of information during the formal literature search. These included, amongst others, the Environmental Health Project (EHP) of USAID, Médecins Sans Frontières (MSF), Merlin, UNICEF, WHO regional offices, as well as, national insti-tutes of research in China, India, Kenya, Tanzania, Thai-land, and other countries. This second-line search strategy aimed at identifying 'grey' literature sources (publications issued by government, academia, business and industry not controlled by commercial publishing interests) and primary, unpublished PR survey data.
Finally, the database of malaria research scientists and people involved in malaria control was expanded from the authors and institutions lists in the literature, malaria research conference and meeting attendance lists, and membership listings published by national and interna-tional tropical medicine societies. The database includes contact details and the MEC of professional affiliation. This database provided the basis for the third approach to identifying PR survey data: sending an e-mail circular alerting recipients to the launch of the MAP initiative, indicating the data needs of the project and directing them to the MAP website [35]. The website was constructed to list country-specific data already abstracted and highlight, through on-line maps, areas where data are currently una-vailable and where their provision would assist in the cov-erage of information within national boundaries.
Assembling a digital data archive
[image:3.612.54.553.648.719.2]Each source of information was reviewed by one of the authors of this paper and the data extracted into a custom-ized Microsoft Access (Microsoft, 2003) database. The
Table 1: Frequency of malaria transmission indices in two bibliographic archives.
Index PubMed hits ISI Web of Science
Entomological inoculation rate 97 84
Vectorial capacity 120 97
Basic reproductive number 10 7
Parasite rate 889 616
main data entry form displays information of three differ-ent types. First, it allows differ-entry of basic information related to the data source. A unique, auto-generated identifier links the record to a reference manager platform and to an electronic copy of the source when this could be obtained. Paper copies of published or unpublished reports not available in an electronic format were scanned and con-verted to portable document format (PDF). The design of the digital library is one of the main strengths of the MAP database as it allows an easy, rapid and organized access to original sources for data verification and follow-up. It may also present a future weakness for data sharing since many of the literature are protected by copyright.
The entry form includes all fields related directly to malaria prevalence, including some geographic descrip-tions (geographic extent of the study area, as well as the land cover type as reported by the author(s) as either urban or rural, and forest and/or rice cultivation), and a full description of the cross-sectional study and its results (number of surveys, parasite detection method, dates, age-range sampled, number of slides examined and numbers of positive individuals). The contacts database is also a crucial component of the MAP main database. The form is linked to an email directory to help keep track of all com-munications with individuals as separate text files ena-bling an electronic trail of correspondence to re-check information and avoid duplication of messages to indi-viduals by different members of the MAP team.
A geo-positioning entry form was designed separately that links directly to the relevant section of the main Access form. In this way, locations and geo-positioning can be updated independently without affecting the main PR data table. This form shows descriptions of the location in which the survey was conducted. These include the name of the community studied and its regional, country and sub-national correspondence, as well as the geographic coordinates and related information about the geo-posi-tioning method. Geographic data entry works on the basis of drop-down menus based on country and sub-national first (ADMIN1) and second (ADMIN2) administrative division tables derived from the United Nations' Second Administrative Level Boundaries (SALB) dataset [39] and the Global Administrative Unit Layers (GAUL) developed by the Food and Agriculture Organization (FAO) [40]. This allows the user to constrain the search progressively by administrative division and decide on the best match for each site accordingly. By doing so, the user also assigns geographically unique codes to the location automati-cally, in a hierarchical fashion (i.e. ADMIN2 codes are linked to respective ADMIN1 codes and these to country codes). Thus, each community is assigned ultimately a unique identifier that, not only records its geographic
coordinates, but ascribes the site to the correct administra-tive units on a map.
The main database is linked to a geographic information system (GIS). This, coupled with queries designed to gen-erate custom tables to display data according to region, country, PR data source, parasite species and other custom criteria, allows a simple and rapid generation of the coun-try and regional maps found on the MAP website. This information is updated on a weekly basis.
Locating survey data
The geo-positioning of surveyed communities is a compli-cated exercise. There are a number of potential problems when locating a survey in space and the level of difficulty depends largely on the amount of information available for the survey area in question. Having only the name of the location is often insufficient because village names are frequently repeated within countries and even within administrative sub-divisions. Also, Anglicized spellings may vary with translation and are complicated by the diversity of alphabets, sometimes making sites unidentifi-able, despite being clearly available on a map. Although standard nomenclatures and rules for translation are attempted in digital gazetteers [41] these are difficult to achieve at national levels, let alone globally. Every data point was, therefore, recorded with as much geographic information from the source as possible and this was used as an aid during the searches and geo-positioning. When available, this information included its first, second and third administrative division associations, as well as any useful landmarks close to the site that could be used to locate it on a map (e.g. distance from, or relative location with respect to, a main city or an obvious geographic fea-ture).
informa-tion was not available, other electronic sources were used (e.g. Africa Data Dissemination Service [42], Alexandria Digital Library [43], EC Joint Research Centre Digital Atlas [44], Falling Rain Genomics Inc.'s Global Gazetteer [45], GEOnet Names Server [46], Getty Thesaurus of Geo-graphic Names [47], Google Earth [48], Maplandia [49]). These sources are available freely on-line and provide var-ying degrees of coverage, functionality and ease of use. If these proved unsuccessful, then searches both in Google [50] and in printed documents (i.e. paper maps and gaz-etteers in map rooms) were undertaken. It is worth noting that the latter yielded disappointing results, with no more information than was available from on-line sources. All promising matches were then again mapped in Encarta to confirm accuracy, before accepting the location as a valid data point. The last resort was to attempt a 'best guess' of where the point is located. The most common example of this approach was when an inaccurate map was available from the source, usually only for illustrative purposes. This was used to derive geographic coordinates by extrap-olating the information to Encarta and approximating the position. Detailed notes of the decisions made during geo-positioning have been kept.
It is not always clear how communities are described in space during PR surveys. In East Africa, it is common to define a community as represented by widely dispersed homesteads, separated sometimes by several hundreds of metres of agricultural land. Conversely, in several West African countries, a community is more spatially con-strained with agricultural land surrounding the village unit. PR survey data are reported by community name and generally not spatial dimensions or settlement density. Thus, any decisions on positioning survey data are, to some extent, arbitrary. Another common description of communities presented in survey sources are small collec-tions of neighbouring villages. In such cases, authors were often contacted to provide specific information for each village. Where these data were not available, it sometimes seemed reasonable to assume that these represented a sin-gle community. In all cases, notes identifying the decision taken for a particular sample were recorded.
The following rules were implemented in attributing data as representing a 'point', a 'wide-area' or a small or large 'polygon'. A point was considered as such when the com-munity was named specifically and could be located in space unambiguously, or when the information suggested that a study area was no bigger than ~10 km2. A wide-area
was defined as any study area that exceeded ~10 km2 but
was no bigger than ~25 km2. A small polygon was
assigned to an area between ~25 km2 and ~100 km2. All
areas for which information suggested that they were larger than this value were defined as large polygons. Inev-itably, these decisions were crude but informed by the
knowledge of the problems that coarse spatial occurrence data presents for developing high spatial resolution mod-els of risk [51]. The thresholds were determined largely by the resolution of the ancillary data compiled as part of MAP, which will be described elsewhere, and is standard-ized mainly to 1 km2. Although it would be highly
desir-able to expect PR data at this level of resolution to qualify as a point, such a definition would be often impractical and regularly illusory. The 10 km2 point tag is pragmatic
because it avoids the exclusion of large quantities of data while allowing for some of the obvious uncertainty inher-ent during geo-positioning. It is likely that wide-areas and polygons will be excluded from some of the later analyses, particularly those that involve ancillary data in which a high level of spatial variation is expected (e.g. population density, altitude, forest cover). Wide-areas and polygons in the MAP database include groups of villages for which a single PR estimate was available, small islands and high resolution administrative units (ADMIN3 or higher). Whenever possible, polygons were converted to wide-areas by using assumptions based on population distribu-tion within a large area.
Results
Search strategyOcto-Flow chart for the geo-positioning of PR data points
Figure 1
ber 2006, the MAP website received 2,079 unique visits from 115 different countries.
By 31 October 2006, a total of 671 primary sources of information were obtained through the three search strat-egies outlined. These sources yielded 3,680 records of community-based PR. For P. falciparum PR, 3,361 individ-ual estimates were obtained from 664 sources and ranged from one to 219 records per source. For P. vivax, a total of 1,592 independent records were obtained from 283 sources, ranging from one to 269 per source. For most records (2,306), a single source was sufficient to extract all the data required. For the remainder, up to three sources were used to describe age, time and geographic specific information, which often involved direct communication with authors or scrutiny of complementary sources.
Sources of information
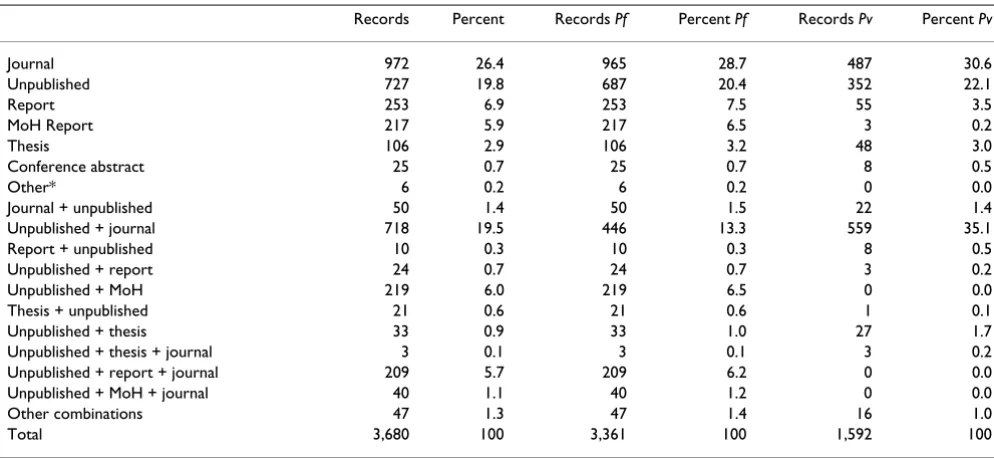
Information sources were classified as follows: a) where data were reported as part of a survey aggregated across wide areas, and were subsequently refined to individual communities through correspondence with authors, the primary source was regarded as 'unpublished work' and the secondary source as 'journal', 'report', 'MoH (Ministry of Health) report', 'conference abstract', or 'thesis'; b) where only the geographic coordinates or age stratifica-tion were obtained through personal communicastratifica-tion, but all other information was available from the original work, the primary source was classified as 'journal', 'report', 'MoH report', 'conference abstract', or 'thesis' and the secondary source entered as 'unpublished work'; c) where combinations of more than two source types were used to derive additional information for that record, the source that provided with the highest spatial, temporal and/or age stratification data was defined as the primary source, and the other two as secondary and tertiary sources.
Table 2 shows the primary, secondary and tertiary source combinations for the 3,680 records identified in total and by species. The most successful approach to identifying community specific estimates of parasite prevalence was through communications and contacts with malaria sci-entists identified from peer-reviewed literature sources. Assembling a comprehensive database of PR data cannot depend entirely on information available from peer-reviewed sources, therefore, as sources classified as 'jour-nal' alone only provided 26.4% of the total number of records. This represents a generic point about database assemblies and demands a considerable effort from data-base gatekeepers and developers.
Non-peer-reviewed reports by research agencies, NGOs and ministries of health are a potentially very useful source of information. The current MAP database contains
470 records from sources classified as primary, including 217 ministries of health reports from Kenya (89), Uganda (32), Mozambique (26), Swaziland (22), Tanzania (12) and Togo (11). This is an opportunistic means of data gathering and depends largely on the contacts available to those assembling the database, as evidenced by the strong links of MAP researchers within Africa. In addition, despite contacting 253 individuals known to be affiliated directly with ministries of health in other MECs, no returns were made by the 31 October 2006. Obviously, this does not mean that the data do not exist, but rather that they are more difficult to access than published data and more creative ways of retrieving them are required.
As part of 'grey' literature searches, an extensive explora-tion of post-graduate theses was undertaken. These proved a valuable resource by contributing with 106 PR records to the database. In addition, all large tropical med-icine conference proceedings from 1995 were reviewed. Prior to this date, possible sources of information from international conference proceedings were only sourced when abstracts were easily available. This source of infor-mation resulted in only 25 PR records. Smaller national conference proceedings might have yielded more compre-hensive data, but these were not easily accessible with the exception of one conference proceeding in India, availa-ble from the National Institute of Malaria Research web-site [52]. By the very nature of national conferences, post-graduate theses, 'grey' literature reports and ministry of health survey data, these will not have been captured com-prehensively by the MAP data searches. It was the inten-tion of the e-mail circular to request PR data from these sources, but this effort produced few records.
Geo-positioning survey data
Of the 3,680 records, 1,565 were able to be posi-tioned either because authors provided detailed geo-graphic coordinates in the report or they were obtained through personal communication. Of the remaining PR records, Encarta alone was useful in geo-positioning 897. Another 1,033 records were geo-positioned with a combi-nation of web-based electronic gazetteers, illustrative maps in the source, free searches on the Internet and best guesses.
successfully and excluding large polygon records was 3,384.
Parasite detection and sample size
Of these 3,384 geo-positioned records, the PR was esti-mated using microscopy in 2,764 (81.7%) and using Rapid Diagnostic Tests (RDT) in 587 (17.3%). One large survey in Ghana, representing 31 communities, and a sur-vey in Papua New Guinea, covering two communities, used PCR as their parasite detection tool. These were excluded from subsequent analyses given the higher sen-sitivity and lack of direct comparability with either micro-scopy or RDT. The ease of RDT methods means that these are increasingly used as part of large PR surveys (e.g. Cam-bodia, Equatorial Guinea, Kenya, Somalia, Tanzania, Thailand, and Zimbabwe). With time, these data will hopefully become more readily available and accessible to MAP.
The sample sizes of the PR records are a result of direct extraction from the source, an aggregation of information for a single community from more than one source, or through correspondence with authors. The database of geo-located point survey data described by microscopy or RDT contains an aggregated sample size of 1,500,203 examinations for P. falciparum infection globally and 895,278 examinations for P. vivax. Over 66% of all sur-veys included at least 100 examinations for either species, falling well within the prescribed ranges of precision required for parasite surveys [53].
Survey time periods
The data have been structured according to four time peri-ods: 1985–1989, 1990–1994, 1995–1999 and 2000– 2006. The frequency of P. falciparum and P. vivax records reported during these periods is shown in Table 3, glo-bally and by WHO region. More than half of the P. falci-parum and P. vivax PR surveys covered the period beyond 01 January 2000 (53.2 and 59.2%, respectively) and the great majority were undertaken since 1995 (70.3 and 75.2%, respectively). In Africa, more than half of MAP P.
falciparum PR records (51.4%) derive from surveys
under-taken between 2000 and 2006. The year 2000 is the last for which MARA reports any data (n = 124) in their MAR-ALite database [17]. The MAP dataset is, therefore, the only current reflection of P. falciparum parasite prevalence at the global scale, and the most contemporary in Africa. A similar pattern is reflected for P. vivax.
Spatial distribution of PR records
[image:8.612.55.552.99.328.2]The number of records varies substantially amongst regions and countries, reflecting not necessarily where malaria is a more serious problem, but where more PR estimates are available, either because surveys are con-ducted more systematically or because data proved easier to access. Endemic countries for which no data or no high spatial resolution surveys were available are Algeria, Argentina, Armenia, Azerbaijan, Bangladesh, Belize, Bhu-tan, Comoros, Djibouti, Dominican Republic, Egypt, El Salvador, French Guiana, Georgia, Guatemala, Guyana, Iran, Kyrgyzstan, Mauritania, Mauritius, Morocco, North Korea, Oman, Panama, Paraguay, Rwanda, South Africa,
Table 2: Number of total P. falciparum and P. vivax records by type of source. The different combinations are described in the text.
Records Percent Records Pf Percent Pf Records Pv Percent Pv
Journal 972 26.4 965 28.7 487 30.6
Unpublished 727 19.8 687 20.4 352 22.1
Report 253 6.9 253 7.5 55 3.5
MoH Report 217 5.9 217 6.5 3 0.2
Thesis 106 2.9 106 3.2 48 3.0
Conference abstract 25 0.7 25 0.7 8 0.5
Other* 6 0.2 6 0.2 0 0.0
Journal + unpublished 50 1.4 50 1.5 22 1.4
Unpublished + journal 718 19.5 446 13.3 559 35.1
Report + unpublished 10 0.3 10 0.3 8 0.5
Unpublished + report 24 0.7 24 0.7 3 0.2
Unpublished + MoH 219 6.0 219 6.5 0 0.0
Thesis + unpublished 21 0.6 21 0.6 1 0.1
Unpublished + thesis 33 0.9 33 1.0 27 1.7
Unpublished + thesis + journal 3 0.1 3 0.1 3 0.2
Unpublished + report + journal 209 5.7 209 6.2 0 0.0
Unpublished + MoH + journal 40 1.1 40 1.2 0 0.0
Other combinations 47 1.3 47 1.4 16 1.0
Total 3,680 100 3,361 100 1,592 100
Saudi Arabia, South Korea, Syria, Tajikistan and Turkmen-istan. After excluding PCR surveys, the MAP database holds 3,351 independent community PR estimates, including 3,036 P. falciparum and 1,347 P. vivax estimates. The global distribution of PR records is presented in Fig-ures 2 and 3. Data for P. falciparum and P. vivax were retrieved for 74 and 41 countries, respectively. Figure 4 ranks these MEC by the number of records gathered. Afghanistan, Tanzania, Kenya, Zimbabwe and Eritrea are the top five countries in terms of number of PR survey records. A more balanced picture of data availability by country was produced by weighting the number of points by the estimated area that is malarious derived from the global spatial limits of malaria (Figure 5) [36,37]. Accord-ing to this rankAccord-ing, the five countries for which the least PR records are available are Angola, Mexico, Namibia, Chad and Democratic Republic of the Congo.
Discussion
[image:9.612.57.555.475.673.2]The last attempt to map the global endemicity of malaria was undertaken almost 40 years ago and was based largely on expert opinion and a mixture of historical evidence, climate and survey data [54,55]. The MAP database has, for the first time, gathered a large global set of spatially unique, contemporary empirical data on malaria ende-micity. This paper has described in detail the methods used to compile these data and serves as the documenta-tion necessary to interpret the database. This assembly of close to 3,500 estimates of parasite prevalence provides a very substantial step in generating the foundations for glo-bal malaria endemicity mapping within refined spatial limits [36,37] using modern techniques with high fidelity environmental data. A general overview of the procedures outlined to achieve this can be found elsewhere [28].
Table 3: Frequency of PR records by time period and WHO region.
WHO region
AFRO AMRO EMRO EURO SEARO WPRO Globe
Period/ Species
Pf Pv Pf Pv Pf Pv Pf Pv Pf Pv Pf Pv Pf Pv
85–89 233 9 27 26 52 37 0 0 32 27 28 48 372 147
90–94 352 7 28 28 23 21 0 0 68 64 59 67 530 187
95–99 294 33 57 57 45 22 0 0 58 49 65 54 519 215
00–06 929 15 22 22 190 349 5 8 203 199 266 205 1,615 798
Total 1,808 64 134 133 310 429 5 8 361 339 418 374 3,036 1,347
Pf -P. falciparum, Pv -P. vivax, AFRO – African Regional Office, AMRO – Americas Regional Office, EMRO – Eastern Mediterranean Regional Office, EURO – European Regional Office, SEARO – South East Asian Regional Office, WPRO – Western Pacific Regional Office.
The global distribution of P. falciparum PR points from the MAP database. MECs are coloured by the WHO regional office to which they belong
Figure 2
The development of the MAP PR database faced difficul-ties related to dealing with meta-data that can be consid-ered generic to the assembly of large health spatial databases. It is clear from the methods reviewed here that such data collection cannot rely solely on published infor-mation as only one quarter of our PR data were available from sources found in the scientific literature. Although non-trivial, accessing the vast amounts of information in
grey literature and unpublished sources is fundamental to maximizing information coverage. MAP has succeeded in procuring large amounts of data from these sources in some countries but not in others. In addition to a great number of individual malaria scientists, national and international institutions, including regional offices of the
WHO (e. g. EMRO and SEARO), have proved highly
responsive to requests for data. Moreover, MAP is actively
[image:10.612.57.557.87.287.2]The global distribution of P. vivax PR points from the MAP database. MECs are coloured by the WHO regional office to which they belong. Refer to the legend of Table 3 for abbreviations
Figure 3
The global distribution of P. vivax PR points from the MAP database. MECs are coloured by the WHO regional office to which they belong. Refer to the legend of Table 3 for abbreviations. The blue dots indicate presence (PR > 0) and white dots absence (PR = 0).
The number of PR records retrieved by country
Figure 4
cultivating collaborative links with relevant institutions in order to foster reciprocal data flows and sustainable long term support to the primary data gathering required to map malaria endemicity. It is hoped that the transparency of this exercise will stimulate further active data sharing in the future and expand the collaboration network of MAP.
Another significant obstacle confronted during the assem-bly of the MAP database was the geo-positioning of data. The accuracy of spatial references in a database is wholly dependent on the precision with which data are located in space. This problem was minimized by developing an elaborate system of geo-positioning based on using mul-tiple sources of information and rigorous quality control. Strict definitions of the geographic nature of the study areas were set (i.e. point, wide-area, small or large poly-gon) in order to increase the accuracy of the spatial attri-bution of the PR data and control the inclusion or exclusion of records during analyses, depending on the spatial resolution of covariates. Useful tools for geo-posi-tioning were identified and it is expected that new resources, such as Google Earth [48], will both facilitate and improve the accuracy of these tasks in the near future. This process was not without major difficulties and this methodology represents a substantial contribution for health geographic databases development. It is hoped that the wider use of global positioning systems to record the geographic coordinates of survey locations will decrease these problems.
MAP is also currently unique in that it represents one of the first attempts to make epidemiological data available in the public domain. This attempt requires detailed peer-reviewed documentation of the data search, assembly, geo-positioning and archival rubrics, and this is the main goal of this paper. The date for public release of these accumulated data was set as 01 June 2009. This time inter-val serves three main purposes: a) it allows sufficient time for MAP to be recognized as a collaboration of stability and longevity; b) it provides a realistic time-frame in which quality control, age-standardization and appropri-ate descriptions of the PR data can be achieved before release, and, importantly; c) it allows data sharing agree-ments to be negotiated with all data contributors. Provid-ing the provenance of the PR survey data, through access to all supporting source PDF documentation, is an impor-tant aspect of this effort and, therefore, the viability of achieving this without infringing copyrights is being assessed.
MAP is committed to the continual improvement of the spatial coverage of the PR data. The availability of survey points, presented here by country, is sufficient for a gen-eral overview of progress, but subject to the environmen-tal arbitrariness of national boundaries. The use of ecological distance metrics [56] would provide a more objective way to prioritize future search efforts within and between environmentally coherent zones. Since local
Anopheles vectors can substantially affect local malaria
endemicity within such ecozones, the MAP database is
[image:11.612.66.543.90.300.2]The number of PR records retrieved by malarious area by country
Figure 5
The number of PR records retrieved by malarious area by country. The scale expresses the number of PR surveys for every 1,000 km2 of area malarious. The latter is as determined by the spatial limits of malaria in each country [36, 37]. Mayotte, Sao
being augmented with vector species distribution records, so that these environmental distance metrics can be made vector specific. These vector distribution data will also enhance the ability to refine the global spatial limits of malaria [36,37], map global malaria endemicity and, ulti-mately, provide the basis of an informed approach to intervention and control. The ongoing effort to generate, archive and document information for these species glo-bally will be described separately. Once robust spatial esti-mates of global malaria endemicity have been developed, the integration of further epidemiological data to exploit the applicability of these maps is anticipated, including monitoring progress towards international malaria con-trol targets and the projection of financial and commodity needs for MECs. Without publicly available information, national and international agencies will continue to assume that entire regions or countries share similar epi-demiological characteristics and that they must share one prescribed menu for control. The future success of malaria control at a global scale demands an investment in the assembly of epidemiological intelligence with a docu-mented provenance. MAP is an attempt to fill this niche.
Authors' contributions
CAG, SIH and RWS wrote the paper jointly. CAG designed and developed the MAP database. CAG, RWS and SIH implemented and supervised data searches, data entry and geo-positioning. LSL and CAG designed and developed the MAP website. LSL, PG and AMN supported data entry and geo-positioning. AJT provided support on ancillary data compilation.
Additional material
Acknowledgements
CAG is supported by a Wellcome Trust Project grant (#076951) and also acknowledges support from the Fundación para la Ciencia y Tecnología (FUNDACYT), Quito, Ecuador. SIH is funded by a Senior Research Fellow-ship from the Wellcome Trust (#079091). RWS is a Wellcome Trust Prin-cipal Research Fellow (#079080). They both acknowledge the support of the Kenyan Medical Research Institute (KEMRI). This paper is published with the permission of the director of KEMRI. This work forms part of the output of the Malaria Atlas Project (MAP), principally funded by the Well-come Trust, U.K., and its success has depended upon the huge effort of those individuals acknowledged on the MAP website.
References
1. Hoffman SL, Subramanian GM, Collins FH, Venter JC: Plasmodium, human and Anopheles genomics and malaria. Nature 2002,
415:702-709.
2. Benson D, Lipman DJ, Ostell J: GenBank. Nucleic Acids Res 1993,
21:2963-2965.
3. Benson DA, Karsch-Mizrachi I, Lipman DJ, Ostell J, Wheeler DL:
GenBank. Nucleic Acids Res 2006, 34:D16-20.
4. Bilofsky HS, Burks C: The GenBank genetic sequence data bank. Nucleic Acids Res 1988, 16:1861-1863.
5. Burks C, Cinkosky MJ, Fischer WM, Gilna P, Hayden JE, Keen GM, Kelly M, Kristofferson D, Lawrence J: GenBank. Nucleic Acids Res
1992, 20(Suppl):2065-2069.
6. Carlton J: The Plasmodium vivax genome sequencing project. Trends Parasitol 2003, 19:227-231.
7. Gardner MJ, Hall N, Fung E, White O, Berriman M, Hyman RW, Carl-ton JM, Pain A, Nelson KE, Bowman S, Paulsen IT, James K, Eisen JA, Rutherford K, Salzberg SL, Craig A, Kyes S, Chan MS, Nene V, Shal-lom SJ, Suh B, Peterson J, Angiuoli S, Pertea M, Allen J, Selengut J, Haft D, Mather MW, Vaidya AB, Martin DM, Fairlamb AH, Fraunholz MJ, Roos DS, Ralph SA, McFadden GI, Cummings LM, Subramanian GM, Mungall C, Venter JC, Carucci DJ, Hoffman SL, Newbold C, Davis RW, Fraser CM, Barrell B: Genome sequence of the human malaria parasite Plasmodium falciparum . Nature 2002,
419:498-511.
8. Kissinger JC, Brunk BP, Crabtree J, Fraunholz MJ, Gajria B, Milgram AJ, Pearson DS, Schug J, Bahl A, Diskin SJ, Ginsburg H, Grant GR, Gupta D, Labo P, Li L, Mailman MD, McWeeney SK, Whetzel P, Stoeckert CJ, Roos DS: The Plasmodium genome database. Nature 2002, 419:490-492.
9. Bahl A, Brunk B, Crabtree J, Fraunholz MJ, Gajria B, Grant GR, Gins-burg H, Gupta D, Kissinger JC, Labo P, Li L, Mailman MD, Milgram AJ, Pearson DS, Roos DS, Schug J, Stoeckert CJ Jr, Whetzel P: Plas-moDB: the Plasmodium genome resource. A database inte-grating experimental and computational data. Nucleic Acids Res 2003, 31:212-215.
10. Topalis P, Koutsos A, Dialynas E, Kiamos C, Hope LK, Strode C, Hemingway J, Louis C: AnoBase: a genetic and biological data-base of anophelines. Insect Mol Biol 2005, 14:591-597.
11. Mongin E, Louis C, Holt RA, Birney E, Collins FH: The Anopheles gambiae genome: an update. Trends Parasitol 2004, 20:49-52. 12. Wu Y, Fairfield AS, Oduola A, Cypess RH: The Malaria Research
and Reference Reagent Resource (MR4) Center – creating African opportunities. Afr J Med Med Sci 2001, 30(Suppl):52-54. 13. De Angelis C, Drazen JM, Frizelle FA, Haug C, Hoey J, Horton R, Kotzin S, Laine C, Marusic A, Overbeke AJ, Schroeder TV, Sox HC, Van Der Weyden MB: Clinical trial registration: a statement from the International Committee of Medical Journal Edi-tors. Lancet 2004, 364:911-912.
14. Roberts RJ: PubMed Central: The GenBank of the published literature. Proc Natl Acad Sci USA 2001, 98:381-382.
15. Ledford H: Funding agencies toughen stance on open access. Nature 2006, 443:894-895.
16. Zerhouni EA: Information access: NIH public access policy. Science 2004, 306:1895.
17. Mapping Malaria Risk in Africa/Atlas du Risque de la Malaria en Afrique [http://www.mara.org.za]
18. Snow RW, Marsh K, le Sueur D: The need for maps of transmis-sion intensity to guide malaria control in Africa. Parasitol Today
1996, 12:455-457.
19. Kleinschmidt I, Bagayoko M, Clarke GPY, Craig MH, le Sueur D: A spatial statistical approach to malaria mapping. Int J Epidemiol
2000, 29:355-361.
20. Kleinschmidt I, Sharp BL, Clarke GP, Curtis B, Fraser C: Use of gen-eralized linear mixed models in the spatial analysis of small-area malaria incidence rates in Kwazulu Natal, South Africa. Am J Epidemiol 2001, 153:1213-1221.
21. Kleinschmidt I, Omumbo J, Briet O, van de Giesen N, Sogoba N, Men-sah NK, Windmeijer P, Moussa M, Teuscher T: An empirical malaria distribution map of West Africa. Trop Med Int Health
2001, 6:779-786.
22. Snow RW, Gouws E, Omumbo J, Rapuoda B, Craig MH, Tanser FC, le Sueur D, Ouma J: Models to predict the intensity of Plasmo-dium falciparum transmission: applications to the burden of disease in Kenya. Trans R Soc Trop Med Hyg 1998, 92:601-606.
Additional file 1
The MAP database PR inclusion criteria
The MAP database PR inclusion criteria
Click here for file
Publish with BioMed Central and every scientist can read your work free of charge "BioMed Central will be the most significant development for disseminating the results of biomedical researc h in our lifetime."
Sir Paul Nurse, Cancer Research UK
Your research papers will be:
available free of charge to the entire biomedical community
peer reviewed and published immediately upon acceptance
cited in PubMed and archived on PubMed Central
yours — you keep the copyright
Submit your manuscript here:
http://www.biomedcentral.com/info/publishing_adv.asp
BioMedcentral
23. Omumbo JA, Hay SI, Snow RW, Tatem AJ, Rogers DJ: Modelling malaria risk in East Africa at high-spatial resolution. Trop Med Int Health 2005, 10:557-566.
24. Omumbo J, Ouma J, Rapuoda B, Craig MH, le Sueur D, Snow RW:
Mapping malaria transmission intensity using geographical information systems (GIS): an example from Kenya. Ann Trop Med Parasitol 1998, 92:7-21.
25. Gemperli A, Sogoba N, Fondjo E, Mabaso M, Bagayoko M, Briet OJ, Anderegg D, Liebe J, Smith T, Vounatsou P: Mapping malaria transmission in West and Central Africa. Trop Med Int Health
2006, 11:1032-1046.
26. Gemperli A, Vounatsou P, Sogoba N, Smith T: Malaria mapping using transmission models: application to survey data from Mali. Am J Epidemiol 2006, 163:289-297.
27. WHO Global Health Atlas [http://www.who.int/globalatlas] 28. Hay SI, Snow RW: The Malaria Atlas Project: Developing
glo-bal maps of malaria risk. PLoS Med 2006, 3:e473.
29. WHO: World Malaria Report 2005. Geneva: World Health Organization; 2005.
30. Mouchet J, Carnevale P, Coosemans M, Julvez J, Manguin S, Richards-Lenoble D, Sircoulon J: Biodiversité du Paludisme dans le Monde. Paris: John Libbey Eurotext; 2004.
31. Atlas évolutif du paludism à Madagascar [http://www.pas teur.mg/AtlasPalu/atlas%20palu%20couverture.html]
32. Briet OJ, Gunawardena DM, van der Hoek W, Amerasinghe FP: Sri Lanka malaria maps. Malar J 2003, 2:22.
33. Sibley CH, Ringwald P: A database of antimalarial drug resist-ance. Malar J 2006, 5:48.
34. The Global Fund to Fight AIDS, Tuberculosis and Malaria
[http://www.theglobalfund.org/EN/]
35. Malaria Atlas Project (MAP) [http://www.map.ox.ac.uk] 36. Guerra CA, Snow RW, Hay SI: Defining the global spatial limits
of malaria transmission in 2005. Adv Parasitol 2006, 62:157-179. 37. Guerra CA, Snow RW, Hay SI: Mapping the global extent of
malaria in 2005. Trends Parasitol 2006, 22:353-358. 38. PubMed [http://www.pubmed.gov]
39. Second Administrative Level Boundaries Dataset [http:// www3.who.int/whosis/gis/salb/salb_home.htm]
40. FAO: The Global Administrative Unit Layers. Rome: EC-FAO Food Security for Action Programme funded by the European Com-mission; 2007.
41. Hill LL: Core elements of digital gazetteers: Placenames, cat-egories, and footprints. Research an Advanced Technology for Digital Libraries, Proceedings 2000, 1923:280-290.
42. Africa Data Dissemination Service [http:// igskmncnwb015.cr.usgs.gov/adds]
43. Alexandria Digital Library [http://www.alexandria.ucsb.edu] 44. Digital Map Archive [http://dmaweb2.jrc.it]
45. Global Gazetteer Version 2.1 [http://www.fallingrain.com/ world/]
46. GEOnet Names Server (GNS) [http://earth-info.nga.mil/gns/ html/cntry_files.html]
47. Getty Thesaurus of Geographic Names [http://www.getty.edu] 48. Google Earth [http://earth.google.com]
49. Maplandia [http://www.maplandia.com] 50. Google [http://www.google.co.uk]
51. McPherson JM, Jetz W, Rogers DJ: Using coarse-grained occur-rence data to predict species distributions at finer spatial resolutions-possibilities and limitations. Ecol Model 2006,
192:499-522.
52. National Institute of Malaria Research [http://www.mrcin dia.org]
53. Jovani R, Tella JL: Parasite prevalence and sample size: miscon-ceptions and solutions. Trends Parasitol 2006, 22:214-218. 54. Hay SI, Guerra CA, Tatem A, Noor AM, Snow RW: The global
dis-tribution and population at risk of malaria: past, present, and future. Lancet Infect Dis 2004, 4:327-336.
55. Lysenko AY, Semashko IN: Geography of Malaria: A medico-geographic profile of an ancient disease [in Russian]. In
Medicinskaja Geografija Edited by: Lebedew AW. Moscow: Academy of Sciences; 1968:25-146.