Janelle Rose
James Cook University, Australia
Gerard Fogarty
University of Southern Queensland, Australia
ABSTRACT
Self-service technologies (SSTs) play a major role in enabling consumers to perform service delivery themselves. The purpose of this study was to test extensions of the Technology Acceptance Model (TAM) aimed at predicting senior consumers’ acceptance and use of self-service banking technologies (SSBTs). A survey methodology was employed to gather data from 208 seniors on variables captured by the extended TAM. Path analysis indicated that self-efficacy, technology discomfort, perceived risk and personal contact were determinants of perceived ease of use and perceived usefulness and also direct and indirect determinants of attitude towards and intention to use SSBTs. These findings have theoretical implications for models of technology acceptance and practical interventions designed at increasing use of SSBTs.
INTRODUCTION
Across a range of service industries, technology is dramatically changing the service delivery process as it requires more employees and customers to interact with technology-based systems either as a substitute for or complement to face-to-face service interactions (Curran, Meuter, & Surprenant, 2003; de Jong, de Ruyter, & Lemmink, 2003; Meuter, Bitner, Ostrom, & Brown, 2005). The benefits of adopting self-service technologies (SSTs) from the perspective of the firm and customer are many (Lee & Allaway, 2002; Meuter, Ostrom, Roundtree, & Bitner, 2000), however customers who are used to personal assistance in their service encounters may be less than eager or could resist adopting SSTs even though the services appear to offer additional benefits.
The success of models such as TAM has led researchers to describe the task of explaining and predicting user acceptance of new computer and information technology in the organisational context as a mature research area (cf. Venkatesh et al., 2003). However, the emergence of SSTs and their widespread dispersion in non-organisational settings has created a need for research focussing on factors that influence their acceptance and adoption by groups who might not otherwise be interested in using technology (Curran et al., 2003; Dabholkar & Bagozzi, 2002; Wang, Wang, Lin, & Tang, 2003; Meuter et al., 2005).
The purpose of the present study was to test the TAM in a self-service technology-customer interaction context and to extend the model by drawing on constructs from a range of theories - namely subjective norms, self-efficacy, perceived risk, technology discomfort and personal contact - to improve our understanding of the antecedents of the TAM constructs, perceived usefulness and perceived ease of use. Extending the TAM in this way promises to assist in predicting attitude and acceptance and thereby provide meaningful information that can serve as a basis for designing educational and communication strategies to foster greater acceptance of SSTs among senior consumers. For many reasons, senior consumers (over the age of 50 years) are the last to use many of the SSTs currently available. Routine banking services such as EFTPOS, ATMs, telephone and Internet banking require technology-customer interaction, with the senior consumer market having the lowest acceptance rate of these SSTs (Australian Bureau of Statistics, 2001-02).
The next section is devoted to a description of the conceptual model to be tested in this study. This is followed by an overview of the empirical study and presentation of the results. The final sections include a discussion of the findings, limitations of the study, and some directions for future research.
CONCEPTUAL MODEL
The Technology Acceptance Model (TAM) (Davis et al., 1989) forms the foundation of the conceptual model for this study, and includes two specific beliefs that are relevant for self-service banking technology (SSBT) use, namely
Figure 1: Conceptual model of the extended technology acceptance model
The variables shown on the left-hand-side of Fig. 1 are those added to the TAM in this study to further our understanding of perceived usefulness and perceived ease of use, the main input variables in the TAM. Starting from the bottom left, the first of the additional variables is perceived self-efficacy. Based on previous findings that computer self-efficacy has a positive effect on perceived ease of use and perceived usefulness (Venkatesh, 2000; Wang et al., 2003), it was hypothesised that perceived self-efficacy regarding confidence in one’s ability to use SSBTs would have a positive effect on an individual’s judgement about the usefulness and ease of using SSBTs.
Technology discomfort, the tendency of an individual to be uneasy, apprehensive, stressed or have anxious feelings about the use of SSBTs, is a similar construct to computer anxiety, a variable that has been found to have a negative effect on perceived ease of use (Venkatesh, 2000). The extended model proposes a similar link between technology discomfort and perceived ease of use and also a link between technology discomfort and perceived usefulness, a relationship that has not been tested in previous research.
Subjective norms is a TRA construct (Fishbein & Ajzen, 1975) that refers to the motivating influence of our perceptions of what we think significant others (e.g., family) want us to do. Venkatesh and Davis (2000) found that subjective norms had a significant influence on perceived usefulness and behavioural intentions when use of the technology was mandatory. When technology use was voluntary, subjective norms still influenced perceived usefulness but did not have a direct influence on behavioural intentions. Based on these findings in a voluntary context, we propose a similar outcome was expected in the present study.
Research evidence supports the consideration of personal contact and perceived risk in the context of this study (Bobbitt & Dabholkar, 2001; Dabholkar, 2000; Meuter, 1999; Walker & Francis, 2003). Consumers who don’t feel comfortable with technology will have a greater desire for personal contact, defined as the interpersonal interactions providing direct response, assurance, a sense of control
Subjective Norms
Perceived Usefulness (U)
Perceived Ease of Use (E)
Attitude towards SSBT (A)
Intention to use SSBT (BI)
Future Behaviour – use of SSBT (B)
+
-+ Personal
Contact
Technology Discomfort
Perceived Self-efficacy
Perceived
Risk
and social interaction. This construct is proposed to have a negative effect on perceived ease of use and perceived usefulness of SSBTs. In terms of perceived risk, consumers may perceive SSBTs as riskier than the traditional form of banking in relation to performance, physical and financial risk. This perceived riskiness is proposed to have a negative effect on perceived ease of use and perceived usefulness of SSBTs.
RESEARCH METHOD
The testing of the model outlined above was conducted using data collected from senior consumers (over 50 years of age) who were randomly selected from a large Queensland Seniors database in Australia. Based on the type of information that was required to test the model, the wide dispersion of respondents across Queensland, and confidentiality and privacy issues, a mail self-administered questionnaire was considered most appropriate. A total of 600 surveys were sent to selected respondents and a total of 208 (35%) usable questionnaires were returned.
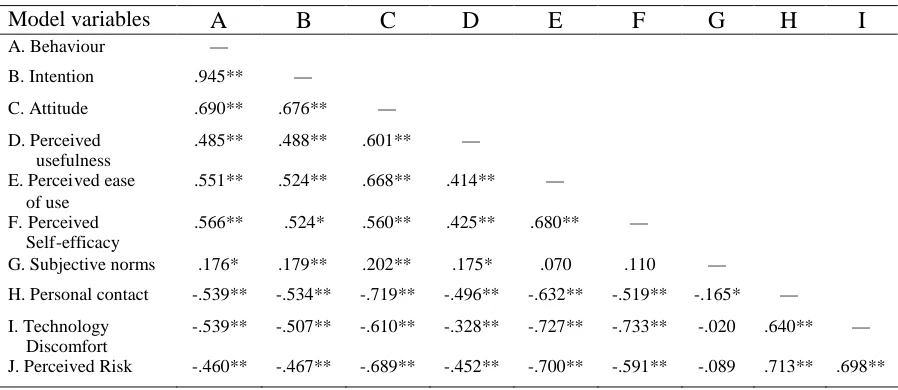
[image:4.595.82.531.536.731.2]The questionnaire used in the survey was developed following a series of indepth interviews and focus groups with representatives from the population of interest. Rigorous development and testing of the measurement scales followed the approach outlined by Netemeyer, Bearden and Sharma (2003). All items were measured on a five-point Likert scale – strongly disagree to strongly agree, with the exception of behaviour which was measured on a six-point scale - extremely unlikely to extremely likely. Following the administration of the survey, factor analysis was used to establish the construct validity of the scales. Internal consistency reliability estimates (Cronbach’s alpha) were then computed for all scales. With the exception of perceived ease of use, where the reliability was .75, reliability estimates were all greater than .84. Scale intercorrelations are presented in Table 1.
Table 1: Correlations between measured variables
Model variables A B C D E F G H I
A. Behaviour —
B. Intention .945** —
C. Attitude .690** .676** —
D. Perceived usefulness
.485** .488** .601** —
E. Perceived ease of use
.551** .524** .668** .414** —
F. Perceived Self-efficacy
.566** .524* .560** .425** .680** —
G. Subjective norms .176* .179** .202** .175* .070 .110 —
H. Personal contact -.539** -.534** -.719** -.496** -.632** -.519** -.165* —
I. Technology Discomfort
-.539** -.507** -.610** -.328** -.727** -.733** -.020 .640** —
J. Perceived Risk -.460** -.467** -.689** -.452** -.700** -.591** -.089 .713** .698**
RESULTS AND DISCUSSION
The use of SSBTs varied across the sample with 19% (40) describing themselves as non-users, 19 % (40) low users (< 50% use of SSBTs), and 62 % (128) moderate to high users (> 60%). Overall usage rates of SSBTs were higher than we expected to find, with the following pattern emerging: EFTPOS, 56%; ATM, 67%; telephone banking, 41%; internet banking, 15%; and face-to-face 94%. Respondents ranged in age from 52 to 88 years with 36% (75) of the respondents male and 64% (133) female. Only 16% were employed full time. Respondents’ highest education achieved ranged from primary to postgraduate and a wide range of occupations was reported.
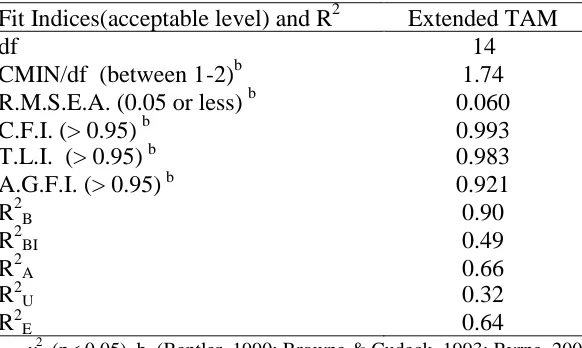
[image:5.595.105.396.404.578.2]The path model was tested using AMOS 4.01 (Arbuckle & Wothke 1999) with the default maximum likelihood estimation method. The fit indices, acceptable level for each fit index, and squared multiple correlation (R2) are provided in Table 2. The extended TAM as conceptualised in Fig. 1 had a poor fit, however modifications to the model improved the fit (see Table 2 and Fig. 2 – all paths (standardised regression coefficients) significant at p<0.05). These modifications involved the fitting of additional pathways among variables and the deletion of one variable. These modifications are discussed below.
Table 2: Fit indices and explanatory power for the extended TAM (ETAM)
Fit Indices(acceptable level) and R2 Extended TAM
df 14
CMIN/df (between 1-2)b 1.74
R.M.S.E.A. (0.05 or less)b 0.060
C.F.I. (> 0.95)b 0.993
T.L.I. (> 0.95)b 0.983
A.G.F.I. (> 0.95)b 0.921
R2B 0.90
R2BI 0.49
R2A 0.66
R2U 0.32
R2E 0.64
a. χ2 (p< 0.05) b. (Bentler, 1990; Browne & Cudeck, 1993; Byrne, 2001)
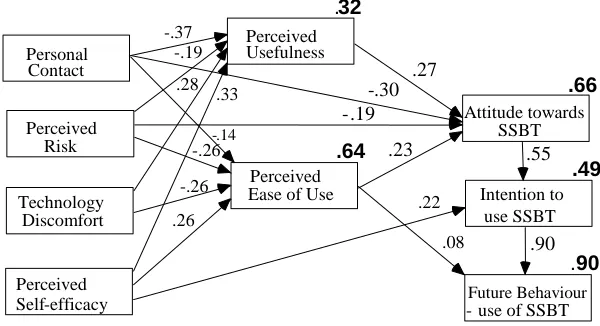
between perceived self-efficacy and intention, and between perceived ease of use and behaviour. The direct paths between perceived ease of use and perceived usefulness and perceived usefulness and intention were not significant and were therefore deleted. The relationship between technology discomfort and perceived usefulness is negative (see Table 1) but is reversed in the extended TAM (see Fig. 2) because of the multicollinearity among predictor variables leading to a suppression effect (McClendon, 1994).
Figure 2: Extended technology acceptance model (ETAM)
The current research extends our understanding of factors influencing seniors’ acceptance of SSBTs with the determinants explaining 64% variance in perceived ease of use, 32% variance in perceived usefulness and predicts 66% of the variance in attitude, which is 9% more than is predicted by TAM components of the variance in attitude. In other words, the extensions to the model not only help to understand the precursors to perceived usefulness and perceived ease of use, they also improve the prediction of attitude towards SSBT. For seniors to acquire knowledge and experience of SSBTs, we know that we have to work backwards and, where appropriate, change their perceptions of the usefulness of SSTs and the ease with which they can be used. Self-efficacy is clearly a key variable. Improving seniors’ knowledge and experience with technology, for example computers, will enhance their confidence and thus their attitude and acceptance of SSBTs. Communicating the benefits of using select SSBTs is not enough, there is an increasing need for seniors to have hands on training to improve their confidence and demonstrate that they have the ability to use SSBTs (Charness, Park, & Sabel, 2001). These changes will allow seniors to feel less discomfort with banking technologies and thus assist in reducing their need for personal contact. Knowledge about how SSBTs operate can reduce seniors’ fear of performance and financial risk while physical risk, specifically with ATMs, can be minimised through using EFTPOS technology.
.32 Perceived Usefulness
.64 Perceived Ease of Use
.66 Attitude towards SSBT .49 Intention to use SSBT .90 Future Behaviour
LIMITATIONS AND DIRECTIONS FOR FUTURE RESEARCH
While the measurement scales employed in this study were based on prior research, additional work is needed to further validate the scales and improve reliability on perceived ease of use. Future work should examine possible moderation effects of age, gender and personal innovativeness on predicting seniors’ use and acceptance of SSBTs.
REFERENCES
Australian Bureau of Statistics. (2001-02). Household use of information technology.Catalogue No. 8146.0, Australian Bureau of Statistics, Canberra.
Bentler, P. M. (1990). Comparative fit indexes in structural models.Psychological Bulletin, 107, 238-246.
Bobbitt, L. M., & Dabholkar, P. A. (2001). Integrating attitudinal theories to understand and predict use of technology-based self-service: the Internet as an illustration.International Journal of Service Industry Management, 12(5), 423-450.
Browne, M. W., & Cudeck, R. (1993). Alternative ways of assessing model fit. In K. A. Bollen & J. S. Long (Eds.),Testing Structural Equation Models(pp. 136-162). Newbury Park, CA: Sage.
Byrne, B. M. (2001).Structural equation modeling with AMOS: basic concepts, applications, and programming. Mahwah, New Jersey: Lawrence Erlbaum Associates.
Charness, N., Park, D. C., & Sabel, B. A. (2001).Communication, technology and aging: opportunities and challenges for the future. New York: Springer Publishing Company, Inc.
Curran, J. M., Meuter, M. L., & Surprenant, C. F. (2003). Intentions to use self-service technologies: a confluence of multiple attitude.Journal of Service Research, 5(3), 209-224.
Dabholkar, P. A. (2000). Technology in service delivery: implications for self-service and service support.In T.A. Swartz & D Iacobucci (Eds.),Handbook of Services Marketing & Management(pp. 103-110), California: Thousand Oakes.
Dabholkar, P. A., & Bagozzi, R. P. (2002). An attitudinal model of technology-based self service: moderating effects of consumer traits and situational factors.Journal of the Academy of Marketing Science, 30(3), 184-201.
de Jong, A., de Ruyter, K., & Lemmink, J. (2003). The adoption of information technology by self-managing service teams.Journal of Service Research, 6(2), 162-179.
Fishbein, M., & Ajzen, I. (1975).Belief, attitude, intention and behaviour: an introduction to theory and research. Reading, Massachusetts: Addison-Wesley.
Lee, J., & Allaway, A. (2002). Effects of personal control on adoption of self-service technology innovations.Journal of Services Marketing, 16(6), 553-572.
McClendon, M. J. (1994).Multiple regression and causal analysis. Itasca, Illinois: Peacock Publishers.
Meuter, M. L. (1999).Consumer adoption of innovative self-service technologies: a multi-method investigation (consumer readiness, innovation, prescription ordering).
Unpublished PhD, Arizona State University, Tempe, Arizona.
Meuter, M. L., Ostrom, A. L., Roundtree, R. I., & Bitner, M. J. (2000). Self-service technologies: understanding customer satisfaction with technology-based service encounters.Journal of Marketing, 64(3), 50-64.
Meuter, M. L., Bitner, M. J., Ostrom, A. L., & Brown, S.W. (2005). Choosing among alternative service delivery modes: an investigation of customer trial of self-service technologies.Journal of Marketing, 69(2), 61-83.
Netemeyer, R. G., Bearden, W. O., & Sharma, S. (2003).Scaling procedures: issues and applications. Thousand Oaks, California: Sage Publications.
Venkatesh, V. (2000). Determinants of perceived ease of use: integrating control, intrinsic motivation, and emotion into the technology acceptance model.Information Systems Research, 11(4), 342-365.
Venkatesh, V., & Davis, F. D. (2000). A theoretical extension of the technology acceptance model: Four longitudinal field studies.Management Science, 46(2), 186-204.
Venkatesh, V., Morris, M. G., Davis, G. B., & Davis, F. D. (2003). User acceptance of information technology: towards a unified view.MIS Quarterly, 27(3), 425-478.
Walker, R. H., & Francis, H. (2003). Customer service and relationship management in the context of technology-enabled service delivery systems.Australasian
Marketing Journal, 11(2), 23-33.