This is a repository copy of Project FATIMA Final Report: Part 1..
White Rose Research Online URL for this paper: http://eprints.whiterose.ac.uk/2083/
Monograph:
May, A.D., Marler, N., Shepherd, S. et al. (1 more author) (1999) Project FATIMA Final Report: Part 1. Working Paper. Institute of Transport Studies, University of Leeds , Leeds, UK.
Working Paper 531A
[email protected] https://eprints.whiterose.ac.uk/
Reuse
Unless indicated otherwise, fulltext items are protected by copyright with all rights reserved. The copyright exception in section 29 of the Copyright, Designs and Patents Act 1988 allows the making of a single copy solely for the purpose of non-commercial research or private study within the limits of fair dealing. The publisher or other rights-holder may allow further reproduction and re-use of this version - refer to the White Rose Research Online record for this item. Where records identify the publisher as the copyright holder, users can verify any specific terms of use on the publisher’s website.
Takedown
If you consider content in White Rose Research Online to be in breach of UK law, please notify us by
White Rose Research Online
http://eprints.whiterose.ac.uk/
Institute of Transport Studies
University of Leeds
This is an ITS Working Paper produced and published by the University of Leeds. ITS Working Papers are intended to provide information and encourage discussion on a topic in advance of formal publication. They represent only the views of the authors, and do not necessarily reflect the views or approval of the sponsors.
White Rose Repository URL for this paper: http://eprints.whiterose.ac.uk/2083/
Published paper
A D May, N Marler, S Shepherd & P Timms(1999) Project FATIMA Final Report: Part 1. Institute of Transport Studies, University of Leeds, Working Paper 531A
Deliverable D4:
Final Report Part 1
Status : P
PROJECT
FATIMA
Contract No. UR 97 SC 1015
Project
Institute for Transport Studies
Co-ordinator:
University of Leeds
Partners:
TUW/IVV
VTT
CSST
TT-ATM
TØI
Date:
file:
PROJECT FUNDED BY THE EUROPEAN COMMISSION UNDER THE TRANSPORT RTD PROGRAMME OF THE
FATIMA: FINANCIAL ASSISTANCE FOR TRANSPORT INTEGRATION IN METROPOLITAN AREAS: FINAL REPORT PART 1
EXECUTIVE SUMMARY OF REPORT
This Final Report covers the results of the EU-funded research project FATIMA (Financial Assistance for Transport Integration in Metropolitan Areas) which had the following objectives:
(i) to identify the benefits to the private sector of optimal urban transport strategies, and the potential for obtaining private sector funding to reflect those benefits;
(ii) to determine the differences between strategies optimised using public funds and those optimised within the constraints imposed by private funding initiatives;
(iii) to propose mechanisms by which private sector funding can be provided so as to achieve appropriately optimal transport strategies while maintaining quality of operation; and
(iv) to use the results to provide more general guidance on the role of private sector funding for urban transport in the EU.
The project adopted an approach which involved the application of the same study method to nine cities, chosen to reflect a range of urban transport policy contexts in Europe: Edinburgh, Eisenstadt, Helsinki, Merseyside, Oslo, Salerno, Torino, Tromsø and Vienna. This method involved specifying appropriate policy objective functions against which transport strategies could be assessed, and finding the specific strategy that optimised each of these functions. The objective functions covered a range of differing regimes with respect to constraints on public finance and the involvement of the private sector.
It was found that, in a majority of the case study cities, optimal socio-economic policies could be funded by road pricing or increased parking charges, considered over a 30 year time horizon. Such measures would typically be used to make it feasible to increase public transport frequency levels or decrease public transport fares. In general it was found to be important that the city transport planning authority had complete control over all transport measures, affecting both private and public transport.
However, such strategies are likely to require significant levels of investment and, given current attitudes towards constraints on public spending, it might be politically awkward for the public sector to raise such finance. There is thus a potentially useful role for private finance to be used to help overcome such (short term) financing problems. However, it must be appreciated that the private sector will expect to make a profit on such investment. In cities where optimal policies are funded by travellers, the private sector can be reimbursed by travellers. In cities where it is unfeasible for travellers to fund all the costs of optimal policies, it will be necessary for the private sector to be reimbursed from public funds (raised from taxes). An important issue here is that the use of private finance should not be allowed to replace optimal policies with sub-optimal policies.
FATIMA: FINANCIAL ASSISTANCE FOR TRANSPORT INTEGRATION IN METROPOLITAN AREAS: FINAL REPORT PART 1
INTRODUCTION TO PART I
The Final Report of project FATIMA is presented in two parts. Part 1 contains a summary of the method adopted in the project, and sets out the key recommendations in terms of policies and optimisation methodology from both projects. Part 1 is thus directed particularly towards policy makers.
FATIMA: FINANCIAL ASSISTANCE FOR TRANSPORT INTEGRATION IN METROPOLITAN AREAS: FINAL REPORT PART 1
CONTENTS
1
INTRODUCTION
51.1 Project outline 5
1.2 Objective functions 6
1.3 Policy measures 8
1.4 Transport policy models 9
1.5 The optimisation process 10
1.6 Consultation with city authorities 10
2. OPTIMAL STRATEGIES 12
2.1 Results with public sector control 12
2.2 Results with private sector control 16
3. POLICY CONCLUSIONS AND RECOMMENDATIONS 18
3.1 General policy conclusions from FATIMA 18
3.2 The effects of constraints on public finance 18
3.3 The role of value capture 19
3.4 Private sector operation of public transport 19
3.5 Recommendations for the design of optimal transport strategies 20
3.6 Recommendations for the involvement of the private sector 21
3.7 Methodological recommendations 22
3.8 Recommendations for further research 23
4 REFERENCES 24
ANNEX 1 INFORMATION ON OPTIMA 25
A1.1 Objectives of OPTIMA 25
A1.2 OPTIMA objective functions 25
A1.3 Policy measures 26
A1.4 Results from OPTIMA 26
FATIMA: FINANCIAL ASSISTANCE FOR TRANSPORT INTEGRATION IN METROPOLITAN AREAS: FINAL REPORT PART 1
FATIMA - DELIVERABLE 4
FINAL REPORT PART 1: POLICY SUMMARY
1 INTRODUCTION
1.1 Project
outline
This report covers the results of the EU-funded research project FATIMA: Financial Assistance for Transport Integration in Metropolitan Areas.
Project FATIMA was conducted between April 1997 and September 1998, and had the following objectives:
(i) to identify the benefits to the private sector of optimal urban transport strategies, and the potential for obtaining private sector funding to reflect those benefits;
(ii) to determine the differences between strategies optimised using public funds and those optimised within the constraints imposed by private funding initiatives;
(iii) to propose mechanisms by which private sector funding can be provided so as to achieve appropriately optimal transport strategies while maintaining quality of operation; and
(iv) to use the results to provide more general guidance on the role of private sector funding for urban transport in the EU.
The methodological approach in FATIMA was derived from the approach taken in the previous EU-funded project OPTIMA (OPTIMA, 1997), details of which are given in Annex 1. The approach involved the application of the same study method to nine cities, chosen to reflect a range of urban transport policy contexts in Europe (Table 1). The method involved:
• specifying appropriate policy objective functions against which transport strategies would be assessed (Section 1.2);
• identifying a set of transport policy measures which would be tested in the nine cities, and the range of values for each (Section 1.3);
• using an existing transport model of each city to test the application of these measures, and their performance against the objective functions (Section 1.4);
• using a standard optimisation procedure to determine the set of measures which is optimal, for a given objective function, in each city (Section 1.5 and Section 2);
• discussing the resulting policy recommendations with the city authorities (Section 1.6 and Section 2); and
FATIMA: FINANCIAL ASSISTANCE FOR TRANSPORT INTEGRATION IN METROPOLITAN AREAS: FINAL REPORT PART 1
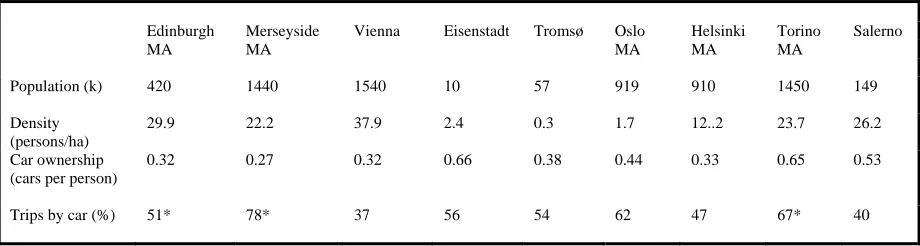
Edinburgh Merseyside Vienna Eisenstadt Tromsø Oslo Helsinki Torino Salerno
MA MA MA MA MA
Population (k) 420 1440 1540 10 57 919 910 1450 149
Density (persons/ha)
29.9 22.2 37.9 2.4 0.3 1.7 12..2 23.7 26.2
Car ownership (cars per person)
0.32 0.27 0.32 0.66 0.38 0.44 0.33 0.65 0.53
Trips by car (%) 51* 78* 37 56 54 62 47 67* 40
[image:8.595.52.512.98.221.2]* motorised trips only
Table 1: The FATIMA and OPTIMA cities
1.2 Objective
functions
The objective functions used in FATIMA were arrived at through a review of current practice and future opportunities in private financing of transport, starting from the acknowledgement that public finance for transport is currently scarce. Information for the review was obtained through a literature search and from interviews with public officials, politicians and representatives of private companies. Over all the cities, nearly 40 case studies of existing and planned schemes were reviewed, covering private involvement in road and rail (especially light rail) infrastructure, terminals, traffic control and information systems, parking and public transport operation. The involvement of the private sector took the form of pure private financing and (more commonly) a variety of forms of public-private partnerships. Based on this review, the FATIMA project defined a range of objective functions to be used in the modelling process, as described below.
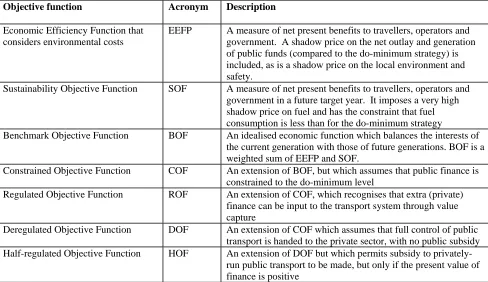
Two objective functions were defined to encapsulate public policy objectives with respect to economic efficiency and sustainability:
• The Economic Efficiency Function taking into account environmental costs (EEFP);
• The Sustainability Objective Function (SOF).
The mathematical specifications of these functions are provided in Section 2 of Part 2. Briefly, EEFP involved:
• calculating the net social benefits (to travellers, operators and government) generated by a given strategy in a future "horizon" year (typically 2015) when compared with a specified "do-minimum" strategy;
• calculating the net present value of these benefits, less any initial capital costs, using conventional discounting procedures and a nation-specific discount rate;
• calculating the net present value of the financial outlay (costs less revenues) for the strategy in the same way to give a present value of finance (PVF);
• applying a shadow price of public funds of 1.25 euro per euro to both net revenue generation and net financial outlay (as given by PVF), reflecting the opportunity cost of using public funds from transport, thus making it feasible to compare financial generation and outlay in the transport sector with that in other sectors; and
FATIMA: FINANCIAL ASSISTANCE FOR TRANSPORT INTEGRATION IN METROPOLITAN AREAS: FINAL REPORT PART 1
Thus EEFP represents a conventional cost-benefit analysis, with the additions of a shadow price for financial costs and benefits to the public sector and a shadow price on local environmental and safety impacts. As with conventional cost benefit analysis, it did not include equity impacts.
The Sustainability Objective Function (SOF) focused solely on conditions in the horizon year, based on the net social benefits in that year less the costs of energy consumption. Energy consumption was used as a proxy for the depletion of scarce resources generally and was assessed using:
• a shadow price (of 5 euro per euro) for all energy consumption; and
• a high penalty for energy consumption which exceeded that in the do-minimum.
The Benchmark Objective Function (BOF) involved the incorporation of both EEFP and SOF into one function, with the weighting between the two designed to given them approximately equal weight. Hence, BOF is a single objective function which is intended to reflect an overall policy orientation which balances economic efficiency and sustainability.
The other objective functions in FATIMA are all extensions of the Benchmark Objective Function, with further constraints which reflect the requirements of a range of public and private sector financing regimes. Once again, the mathematical specifications are provided in Section 2 (Part 2).
The first financial objective function was the Constrained Objective Function, COF, in which all financial outlay greater than the "do minimum" strategy was heavily penalised. This was designed to reflect the reality for most city authorities, who find it difficult to obtain additional financial support.
The second financial objective function was the Regulated Objective Function, ROF, designed to test the potential for city authorities to use value capture to help overcome financing difficulties in situations where there are hard constraints on public finance (as represented by COF). The underlying logic to ROF is that transport strategies which create large levels of user benefits make cities “more accessible” and in general more attractive both to inhabitants and visitors. The private sector (including employers, shopkeepers and other service sectors) might be expected to help fund such strategies and thus help public finance constraints to be overcome. The contributions levied in this way are a charge on beneficiaries, rather than a tax on users, and should therefore not influence demand. The term “regulated” (in the title of ROF) indicates that the use of such private finance has no effect on the level at which policies are implemented; decisions on such levels are entirely at the discretion of the public authority. It was assumed, in ROF, that a maximum of 10% of the user benefits from the strategy could be raised through some form of tax on the private sector beneficiaries; once this amount had been raised, the COF penalty (as above) was applied.
The third financial objective function, the Deregulated Objective Function, DOF, was designed to reflect the involvement of the private sector in direct financing and control of public transport services. Under DOF, the private sector dictates the levels of fares and frequencies. The distinction between “regulated” and “deregulated” regulatory frameworks corresponds with the distinction between “authority initiative” and “market initiative” given in ISOTOPE (ISOTOPE, 1998). Based on research on deregulated provision in partially contestable markets, it was assumed that the private sector would require a 15% return on its investment, and would implement service and fare levels which reflect such a return. The remaining elements of the strategy were assumed to remain in the public sector with constraints as in the COF. It should be noted that, in the main set of
FATIMA: FINANCIAL ASSISTANCE FOR TRANSPORT INTEGRATION IN METROPOLITAN AREAS: FINAL REPORT PART 1
as a result of private operation. However, sensitivity tests were carried out to examine this issue further.
A final objective function, the Half Regulated Objective Function, HOF, was designed to reflect the ability of city authorities to subsidise a deregulated public transport service. The application of the subsidy varied between cities, but typically included reductions in fares and/or increase in service levels beyond those dictated by the private sector.
Several assumptions were made in defining these objective functions, and most of these were tested through sensitivity tests, as described in Section 8 (Part 2). The FATIMA objective functions are summarised in Table 2.
Objective function Acronym Description
Economic Efficiency Function that considers environmental costs
EEFP A measure of net present benefits to travellers, operators and government. A shadow price on the net outlay and generation of public funds (compared to the do-minimum strategy) is included, as is a shadow price on the local environment and safety.
Sustainability Objective Function SOF A measure of net present benefits to travellers, operators and government in a future target year. It imposes a very high shadow price on fuel and has the constraint that fuel consumption is less than for the do-minimum strategy
Benchmark Objective Function BOF An idealised economic function which balances the interests of the current generation with those of future generations. BOF is a weighted sum of EEFP and SOF.
Constrained Objective Function COF An extension of BOF, but which assumes that public finance is constrained to the do-minimum level
Regulated Objective Function ROF An extension of COF, which recognises that extra (private) finance can be input to the transport system through value capture
Deregulated Objective Function DOF An extension of COF which assumes that full control of public transport is handed to the private sector, with no public subsidy Half-regulated Objective Function HOF An extension of DOF but which permits subsidy to
[image:10.595.54.542.250.532.2]privately-run public transport to be made, but only if the present value of finance is positive
Table 2: Summary of the FATIMA objective functions
1.3 Policy
measures
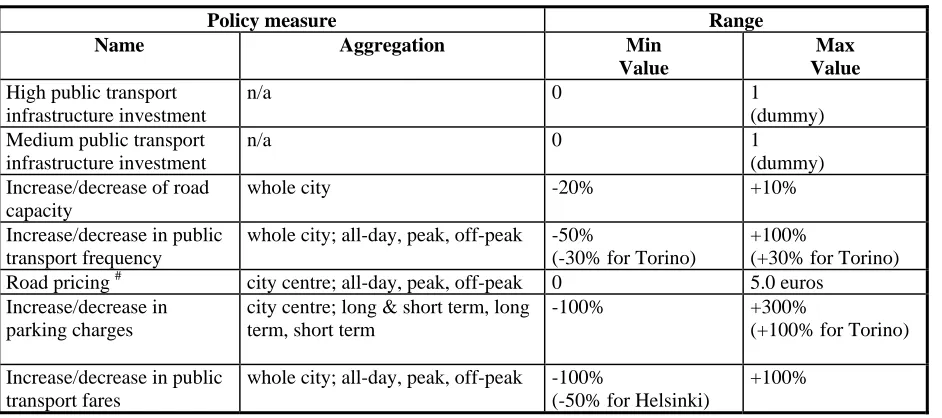
The policy measures studied were the same in all nine cities, and were selected as those of most interest to the nine city authorities, and which could be analysed by all nine city models. The full set of policy variables is listed in Table 3. One measure, public transport infrastructure provision, was defined by the city authorities, who were asked in Project OPTIMA to define a high level of provision, usually rail based, and a medium level of provision, usually bus-based, which they were considering. Inevitably the scale of these differed considerably from one city to another.
FATIMA: FINANCIAL ASSISTANCE FOR TRANSPORT INTEGRATION IN METROPOLITAN AREAS: FINAL REPORT PART 1
the city authorities provided estimates of the capital and operating costs for each of the measures (Section 3, Part 2). In the consultation on Project OPTIMA, some changes were suggested in the ranges of values for the continuous variables, and the new ranges are shown in Table 3. It was also suggested that some measures might be implemented at different levels in the peak and off peak (as shown in Table 3) and that the capital and operating costs should be revised. All of these changes were reflected in Project FATIMA.
Policy measure Range
Name Aggregation Min
Value
Max Value High public transport
infrastructure investment
n/a 0 1
(dummy) Medium public transport
infrastructure investment
n/a 0 1
(dummy) Increase/decrease of road
capacity
whole city -20% +10%
Increase/decrease in public transport frequency
whole city; all-day, peak, off-peak -50%
(-30% for Torino)
+100%
(+30% for Torino) Road pricing # city centre; all-day, peak, off-peak 0 5.0 euros
Increase/decrease in parking charges
city centre; long & short term, long term, short term
-100% +300% (+100% for Torino)
Increase/decrease in public transport fares
whole city; all-day, peak, off-peak -100%
(-50% for Helsinki)
+100%
[image:11.595.54.525.192.401.2]# The value of the measure Road Pricing refers to the cost per trip incurred to the car driver (typically into a city centre)
Table 3: Measures tested in FATIMA, their aggregation and ranges
1.4
Transport policy models
The approach taken in FATIMA has been to use city-specific transportation models which had already been set up, calibrated and used by the city authorities before the start of FATIMA. This has allowed the project to make the working assumption that the models used are properly calibrated and, on an appropriate level of aggregation, transferable. Broadly speaking, the models fall into two main categories: strategic and tactical models.
Strategic models are used for running simulations at a very high level of aggregation. The physical transport network is not directly represented and the number of spatial zones is low (typically less than 40). Travel costs are either calculated in terms of "area speed-flow" curves or (at the highest level of aggregation) are fixed inputs for each origin-destination zone pair. The main advantage of using these models is that they are very fast to run, which can be an important factor if a large number of runs are required. Furthermore, the preparation time for creating the input files is typically short. Even though strategic models are well suited for optimisation work, their use is restricted because few cities have a strategic model ready for use. Edinburgh, Merseyside, Vienna, Helsinki and Eisenstadt all used strategic models.
FATIMA: FINANCIAL ASSISTANCE FOR TRANSPORT INTEGRATION IN METROPOLITAN AREAS: FINAL REPORT PART 1
cities of Tromsø, Oslo, Helsinki, Salerno and Torino all used tactical models.
The models used in FATIMA were very similar to those used in OPTIMA; the main differences concerned the models of Helsinki, Vienna and Eisendstadt:
• In FATIMA, Helsinki streamlined the assignment procedures (as compared to OPTIMA), thus making the FATIMA model for Helsinki faster.
• In the FATIMA Vienna and Eisenstadt models, pedestrian delays were represented directly as a function of road capacity (which was not done in OPTIMA). Thus, in FATIMA, road capacity reductions led directly to improvements in pedestrian travel time.
1.5 The
optimisation
process
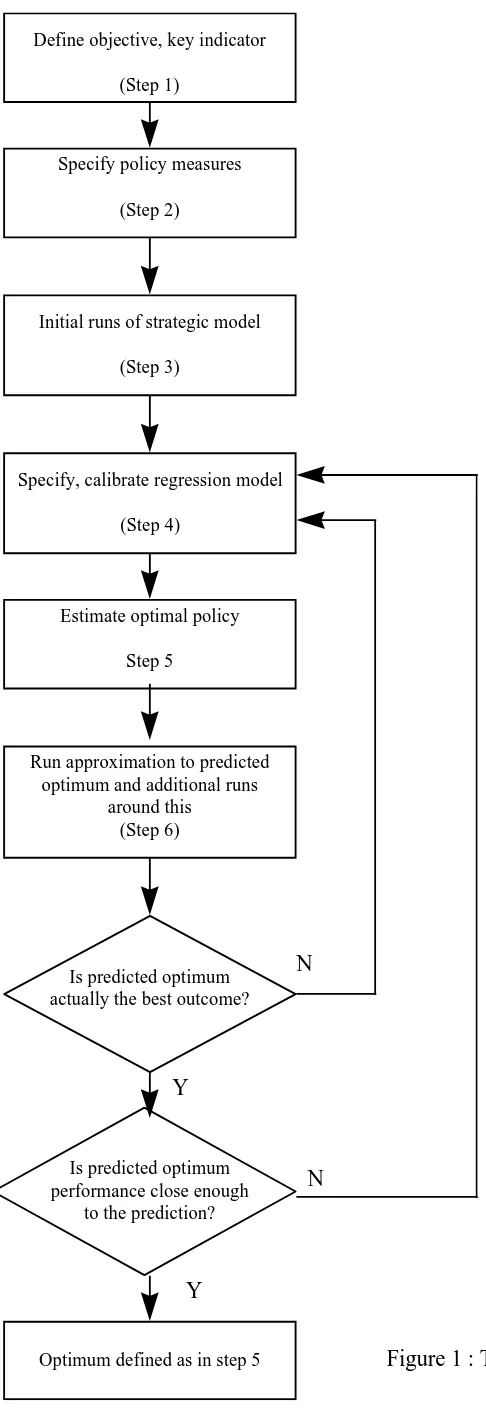
The optimisation procedure used was developed in an earlier study, designed to find a rapid means of determining the set of policy measures which performs best against a given objective function (Fowkes et al, 1998). The method assumes that there is a response surface, which defines the value of the objective function for each combination of policy measures in the policy space, and that maximum values can be identified, either as peaks in the response surface, or as high points at the specified boundaries. To find these, a regression model is generated, with the objective function as the dependent variable, and the values of the policy measures (e.g. fare level, change in capacity) as independent variables. This is then differentiated to determine the optimum.
The process is shown in Figure 1. Step 1 defines the objective function (as in Section 1.2), and Step 2 the policy measures (Section 1.3). Step 3 uses the transport model (Section 1.4) to conduct an initial set of policy combinations, which were predefined for all nine cities using an orthogonal design. Step 4 generates a regression model from this first set of tests; Step 5 differentiates this to estimate an optimal strategy; Step 6 involves further runs of the policy model to test the predicted optimum strategy and variants of it. Two convergence tests are then conducted to see if the "optimum" tested is in practice the best performing strategy of those tested to date, and to check whether the "optimum" value of the objective function is sufficiently close to that predicted by the regression equation. Steps 4 to 6 are then repeated until the convergence tests are satisfied. In early tests of the method using the Edinburgh model, an optimal strategy was identified after 24 runs of the transport model, and its EEF value was around 20% higher than the best strategy identified in a previous consultancy study.
1.6
Consultation with city authorities
FATIMA: FINANCIAL ASSISTANCE FOR TRANSPORT INTEGRATION IN METROPOLITAN AREAS: FINAL REPORT PART 1
Define objective, key indicator
(Step 1)
Specify policy measures
(Step 2)
Initial runs of strategic model
(Step 3)
Specify, calibrate regression model
(Step 4)
Estimate optimal policy
Step 5
Run approximation to predicted optimum and additional runs
around this (Step 6)
Is predicted optimum actually the best outcome?
Is predicted optimum performance close enough
to the prediction?
Optimum defined as in step 5 N
Y
N
[image:13.595.61.304.78.789.2]Y
FATIMA: FINANCIAL ASSISTANCE FOR TRANSPORT INTEGRATION IN METROPOLITAN AREAS: FINAL REPORT PART 1
2.
OPTIMAL STRATEGIES
2.1
Results with public sector control
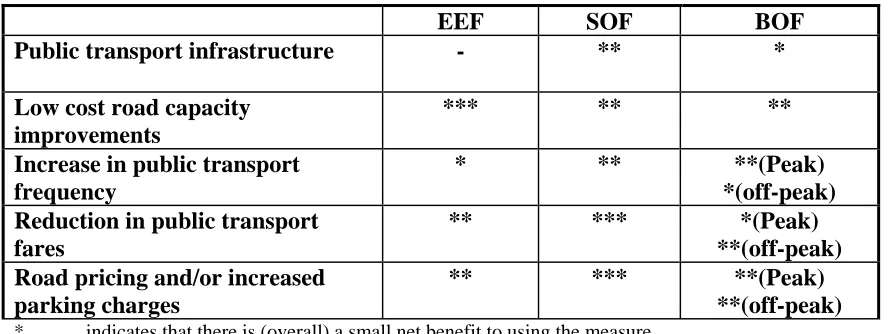
Table 4 provides a summary comparison of the optimal Benchmark Objective Function (BOF) policies with the optimal policies from the OPTIMA objective functions (EEF and SOF). Detailed results are given in Part 2, Section 6. Table 4 shows that the benchmark optimum is most likely to involve:
• limited public transport infrastructure investment;
• low cost improvements in road capacity;
• improvements in public transport by increasing frequency and/or reducing fares; and
• restrictions on car use involving either road pricing or increased parking charges.
Generally the policies lie between those for the economic efficiency and sustainability optima from OPTIMA, which is consistent with the weighting of these two objectives in the Benchmark Objective Function.
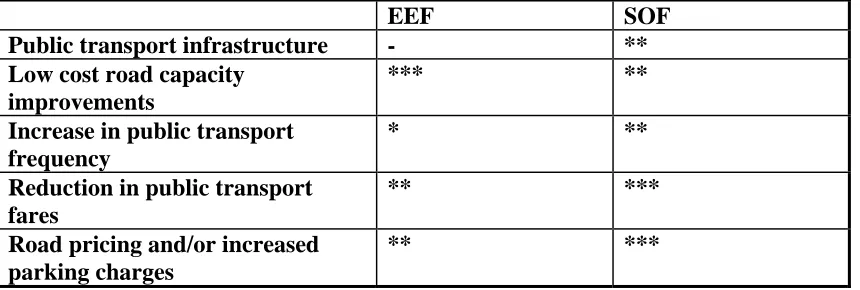
Public transport investment is included at the medium level only, and in only three cities. Road capacity improvements are included in five cities, but it is notable that the Austrian cities have a reduction in road capacity, which can be explained by the impact of this on pedestrian time savings in their models. Public transport frequencies are increased in the peak in all but three cities; off peak increases are typically lower. Fares are reduced in six cities; the only exceptions are the Italian cities where fares and frequencies are both raised to satisfy legal restrictions on subsidy, and Vienna where the costs of public transport use are increased to generate revenue. Road pricing or parking charges increases are introduced in all cities except Helsinki, but in three cities parking charge increases are limited to the off peak.
EEF SOF BOF
Public transport infrastructure - ** *
Low cost road capacity improvements
*** ** **
Increase in public transport frequency
* ** **(Peak)
*(off-peak) Reduction in public transport
fares
** *** *(Peak) **(off-peak)
Road pricing and/or increased parking charges
** *** **(Peak)
**(off-peak)
[image:14.595.50.495.500.667.2]* indicates that there is (overall) a small net benefit to using the measure ** indicates that there is (overall) a medium net benefit to using the measure *** indicates that there is (overall) a strong net benefit to using the measure
FATIMA: FINANCIAL ASSISTANCE FOR TRANSPORT INTEGRATION IN METROPOLITAN AREAS: FINAL REPORT PART 1
Table 5 shows, for the BOF optimal policies:
• the BOF value of the BOF optimal policy;
• the percentage change in car-kms (compared to the do-minimum); and
• the value of PVF (the Present Value of Finance: the measurement of net operator and government financial outlay, which is defined in full in Part 2 Section 2.2)
As described in Section 1, the BOF value of any strategy is a measure of the combined economic efficiency and sustainability of the strategy. The units of BOF do not have any absolute significance and the BOF figures in Table 5 do not have any interest in their own right. However, BOF values, as the name suggests, provide a useful benchmark for comparison of optimal strategies under different finance regimes, and so these values will be useful in the discussion below.
On the other hand, the percentage change in car-kms and PVF (both compared to the do-minimum) for the BOF optimal strategies are of interest in their own right. Due to the fuel consumption constraint in BOF (whereby fuel consumption cannot exceed the level specified in the do-minimum), it is almost certain that there will be a reduction in car-kms in any BOF-optimal policy; Table 5 shows that this is indeed the case in all nine cities. The level of reduction varies widely, from 25% in the Helsinki case to 1% for Torino and Salerno.
Edinburgh M’side Vienna Eisenstadt Tromsø Oslo Helsinki Torino Salerno
BOF values for BOF optima 492 687 142 3.9 22 696 183 128 24
Percentage change in car-km -16% -5% -8% -10% -14% -15% -24% -1% -1%
PVF [mio. EURO] 233 -2120 3903 9.5 -84 5976 -1779 710 88
Table 5: BOF values, % change in car-kms and PVF for BOF-optimal strategies
Table 5 shows that in all cities except Merseyside, Tromsø and Helsinki, the BOF optima were less expensive to the public authority than the do-minimum policies (as expressed by a positive PVF). This implies that the additional revenue from charges on travellers is more than sufficient to finance the extra costs of the strategy. As a result, no separate optimal policies were generated in Edinburgh, Vienna, Eisenstadt, Oslo, Torino and Salerno when public finance was constrained; no separate Constrained Objective Function (COF) optima were generated for these cities.
FATIMA: FINANCIAL ASSISTANCE FOR TRANSPORT INTEGRATION IN METROPOLITAN AREAS: FINAL REPORT PART 1
Merseyside Tromsø Helsinki Level of value capture for the optimal COF policy [mio.
EURO]
147 4 1
[image:16.595.50.544.125.178.2]Level of value capture as a % of PVF deficit for BOF optima 6.9% 4.8% 0.0006%
[image:16.595.50.531.297.468.2]Table 6: Level of value capture available in the COF-optimal policies
Table 7 gives a summary of optimal policies under COF and ROF (the constrained public finance regimes with and without value capture), and compares these with the optimal policies under BOF. Even when different, optimal policies under COF and ROF have the same basic structure as optimal policies under BOF, but are not implemented so robustly.
Time of day BOF COF ROF
Public transport infrastructure - * * *
Low cost road capacity improvements - ** ** **
Increase in public transport frequency Peak Off-peak ** * * - * - Reduction in public transport fares Peak
Off-peak * ** * * * * Road pricing and/or increased parking
charges Peak Off-peak ** ** *** *** *** ***
- indicates that the measure should not be applied
* indicates that there is (overall) a small net benefit to using the measure ** indicates that there is (overall) a medium net benefit to using the measure *** indicates that there is (overall) a strong net benefit to using the measure
Table 7: Summary of optimal measures for the FATIMA COFand ROF functions
Summary indicators for the optimal COF and ROF strategies are given in Table 8, and compared with the equivalent indicators for optimal BOF strategies. It can be seen that the COF-optimal strategies lead, in Merseyside and Helsinki, to significant reductions in social benefits (as measured by BOF) compared to the BOF-optimal strategies. For Merseyside and Tromsø, the reduction in car-kms for the COF-optima is slightly less than under the BOF-optima, whilst in Helsinki the reduction in car-kms for the COF-optima is very much less than under the BOF-optima. As would be expected, the PVFs for all three cities are positive but small for the COF-optima.
Merseyside optima Tromsø optima Helsinki optima
BOF ROF COF BOF COF BOF COF
BOF-value 687 425 404 22 17 183 46
Percentage change in car-km -5% -4% -4% -14% -11% -24% -7%
PVF [mio. EURO] -2120 -152 32 -84 9 -1779 52
[image:16.595.49.572.654.724.2]FATIMA: FINANCIAL ASSISTANCE FOR TRANSPORT INTEGRATION IN METROPOLITAN AREAS: FINAL REPORT PART 1
The results from optimising the Benchmark Objective Function (BOF) and the two objectives functions under public finance financial constraint (COF and ROF) were used to identify four classes of city, based upon the policy recommended and the constraints imposed upon it. Each of the nine case study cities fits into one of these classes. Although these cities are "representative" in the sense that they cover a wide range of different city types throughout Europe, they are not representative in a statistical sense. Thus formal conclusions should not be drawn which are based upon the relative number of cities in each class. The city classes are defined as:
Class 1. Cities where BOF optimal strategies are supportive of both car and public transport users, so that the city must provide finance, and where there is significant possibility for value capture in (public finance) constrained optimal strategies (Merseyside).
Class 2. Cities where BOF optimal strategies are supportive of both car and public transport users, so that the city must provide finance, but where there is no significant possibility for value capture in (public finance) constrained optimal strategies (Helsinki and Tromsø).
Class 3. Cities where BOF optimal strategies place financial restrictions on cars but are supportive of public transport users, so that the former are subsidising the latter. In this case, the city is not likely to make either a large surplus or deficit (Edinburgh, Eisenstadt, Torino, Salerno).
Class 4. Cities where BOF optimal strategies place restrictions on both cars and motorised public transport, and the city raises revenues from both user-types through road user charges (parking and/or road pricing) and increased public transport fares (with no significant increase in frequency). (Vienna, Oslo).
Class 4 can be further subdivided according to whether the main aim of charging users is to reduce fuel consumption or to provide surplus finance for the city. In the latter case the optimal strategy is clearly dependent upon the assumption that shadow pricing should apply to revenue generated. It should be noted that the restrictions referred to are only imposed on motorised transport. The revenues raised from motorised transport users can be used to provide a more attractive pedestrian environment, and improved pedestrian and cyclist facilities.
Several sensitivity tests were conducted to assess how robust the conclusions were to variations in the assumptions made in the Benchmark Objective function and in the treatment of value capture. These are presented in full in Part 2, Section 7. The main conclusions were:
• the BOF optimum was unaffected by the weighting between efficiency and sustainability except in situations where the sustainability element was very highly weighted; in some cities this resulted in greater infrastructure investment being recommended;
• the BOF optimum was fairly insensitive to the value assigned to environmental and safety externalities; higher values typically resulted in higher charges for car use;
• the BOF optimum in Merseyside was insensitive to the shadow price of finance, even though it required a very high level of financial support;
• the BOF optima in Vienna and Salerno were sensitive to the application of a shadow price for revenue generation; when this was removed an alternative strategy, with lower costs to users, was recommended;
FATIMA: FINANCIAL ASSISTANCE FOR TRANSPORT INTEGRATION IN METROPOLITAN AREAS: FINAL REPORT PART 1
2.2
Results with private sector control
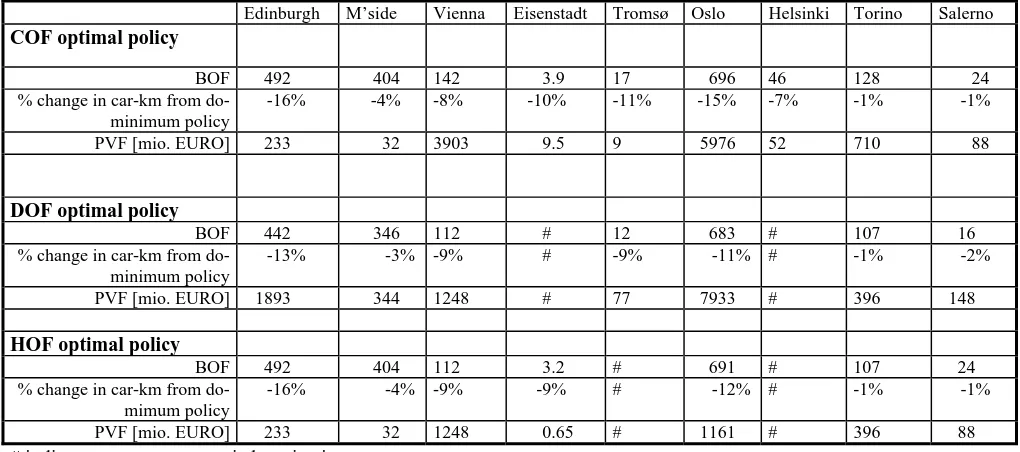
Optimal policies under a deregulated public transport regime (i.e. optimal DOF policies) proved difficult to generate; only very limited policy combinations achieved the required 15% internal rate of return, and a revision to the optimisation process was needed. Feasible DOF optima were generated in all cities except Eisenstadt and Helsinki, and are shown in summary in Table 9, where they are compared with optimal BOF policies (with no public finance constraint) and optimal COF policies (with a public finance constraint). Summary indicators for DOF optima (BOF-values, changes in car-kms and PVF) are given in Table 10. Further details about policies and indicators are given in Part 2 Section 5. Table 9 shows that, generally, DOF-optimal strategies were similar to BOF-optimal strategies with respect to measures other than public transport measures. With respect to the latter, DOF-optimal strategies led to reductions in frequencies and increases in fare.
Time of day BOF COF DOF HOF
Public transport infrastructure All day * * * *
Low cost road capacity improvements
All day ** ** ** **
Increase in public transport frequency Peak Off-peak ** * * - - - * - Reduction in public transport
fares Peak Off-peak * ** * * - - * * Road pricing and/or increased
parking charges Peak Off-peak ** ** *** *** *** *** *** ***
- indicates that the measure should not be applied
[image:18.595.50.536.259.426.2]* indicates that there is (overall) a small net benefit to using the measure ** indicates that there is (overall) a medium net benefit to using the measure *** indicates that there is (overall) a strong net benefit to using the measure
Table 9: Summary of optimal measures for the BOF, COF, DOF and HOF objective functions
Edinburgh M’side Vienna Eisenstadt Tromsø Oslo Helsinki Torino Salerno
COF optimal policy
BOF 492 404 142 3.9 17 696 46 128 24
% change in car-km from do-minimum policy
-16% -4% -8% -10% -11% -15% -7% -1% -1%
PVF [mio. EURO] 233 32 3903 9.5 9 5976 52 710 88
DOF optimal policy
BOF 442 346 112 # 12 683 # 107 16
% change in car-km from do-minimum policy
-13% -3% -9% # -9% -11% # -1% -2%
PVF [mio. EURO] 1893 344 1248 # 77 7933 # 396 148
HOF optimal policy
BOF 492 404 112 3.2 # 691 # 107 24
% change in car-km from do-mimum policy
-16% -4% -9% -9% # -12% # -1% -1%
PVF [mio. EURO] 233 32 1248 0.65 # 1161 # 396 88
# indicates test was not carried out in city
[image:18.595.52.562.521.747.2]FATIMA: FINANCIAL ASSISTANCE FOR TRANSPORT INTEGRATION IN METROPOLITAN AREAS: FINAL REPORT PART 1
In terms of BOF-values, Table 10 shows that DOF-optimal strategies were generally inferior to COF-optimal strategies when considered over a 30 year time horizon. This is reflected in smaller reductions in car-kms travelled in all but two of the cities for which DOF optima were generated. However, the DOF-optima obtained still provided large amounts of net social welfare when compared with the do-minimum. The main problem with a deregulated regime, however, is that there is a large number of feasible states that the transport sector might settle into, and there is no guarantee that the best of these will be obtained in practice.
Some of the cities had the opportunity to identify other feasible DOF solutions. These included:
• small increases in fares and small increases in frequency;
• large increases in fares and large increases in frequency;
• reductions in fares and reductions in frequency.
Each had different impacts on patronage, and the other policy measures, such as road pricing and infrastructure provision, were adjusted to maintain a level of patronage. Many of these combinations had much smaller social benefits than the DOF optimum. One disadvantage of the deregulated regimes is that the city authority has little ability to ensure that the private sector implements the optimal combination of fares and frequency. One benefit of the deregulated regime, however, is that the initial capital investment for the city authority is typically under half that for the benchmark objective, with the private sector supplying the remaining investment costs.
As can be seen from Table 9, the HOF optimal strategies (the deregulated regime in which subsidy was permitted) were typically between the COF and DOF strategies. From Table 10, it can be seen that for most cities the BOF value of the HOF optimum was close to that for the Constrained Objective Function (COF). Where this was the case, it could be argued that the HOF optimum was superior to the COF optimum in that it passes financial risks to the private sector. However, a basic problem with HOF is that it is the least well defined of all the FATIMA objective functions, in that it corresponds to any situation that lies between full-scale regulation and full-scale deregulation.
Other possible consequences of deregulated regimes, which have not been modelled, include :
• changes in efficiency (such as through changes in operating costs)
• attitudes towards risk in raising finance
• payment of interest on loans
• non-uniform changes to public transport services across routes
• quality of service (which could rise or fall).
FATIMA: FINANCIAL ASSISTANCE FOR TRANSPORT INTEGRATION IN METROPOLITAN AREAS: FINAL REPORT PART 1
3.
POLICY CONCLUSIONS AND RECOMMENDATIONS
3.1
General policy conclusions from FATIMA
In Project FATIMA the Benchmark Objective Function (BOF) largely reflected the two objective functions in Project OPTIMA, while incorporating a cost for local environmental and safety externalities, and a benefit for generation of finance. The results largely reflected those for Project OPTIMA, and the policy recommendations in Annex 1.4 were therefore endorsed, with the following exceptions:
• low cost reductions in road capacity may be justifiable where full allowance is given to the resulting time savings for pedestrians; this result requires further study;
• the higher cost strategies recommended for the sustainability objective (SOF) in Project OPTIMA are in most cases no longer justified when economic efficiency, local environment and future sustainability are all considered together;
• the inclusion of local environmental costs strengthens the case for improvements to public transport and increases in the costs of car use;
• the assignment of a shadow benefit to revenue generation may on occasion, as in Vienna, lead to a recommendation for strategies which increase the costs of both public and private transport users. The implications of this require careful consideration, since they suggest that transport policy can be used to subsidise other areas of public policy.
3.2
The effects of constraints on public finance
A particularly important result from FATIMA is that in six of the nine cities (Edinburgh, Vienna, Eisenstadt, Oslo, Torino and Salerno) an optimal strategy could be identified which required no net additional financial support (in addition to the do-minimum support) over the 30 year evaluation period. In all of these cases (Classes 3 and 4 in Section 2.1) the revenue from users more than covers the cost of any changes in infrastructure and operation. Even so, city authorities may be constrained, since typically they have to raise finance for investment initially, and only obtain repayment from users later. This represents one of the situations in which private finance may be used. In these situations the private sector can be reimbursed either directly by the users or indirectly from the city authority using revenues from users. In the former case, it is important that the charges on the user are consistent with the overall optimal strategy. With the exception of private sector operation of public transport (see 3.4 below) it has been assumed implicitly in the model tests that the private sector would require the same rate of return as the public sector. Where this is not the case, the optimal strategy may well be constrained, resulting in lower social benefits.
FATIMA: FINANCIAL ASSISTANCE FOR TRANSPORT INTEGRATION IN METROPOLITAN AREAS: FINAL REPORT PART 1
throughout the (30 year) evaluation period, an alternative strategy is required, represented here by the Constrained Objective Function (COF). As noted in Section 2, these strategies impose higher costs on the user, make reduced investment, and have smaller benefits to society. An alternative which in principle can avoid these constraints is to raise additional finance from the (secondary) beneficiaries of the strategy, through value capture.
3.3
The role of value capture
Value capture in Project FATIMA was represented by a percentage (typically 10%) of the user benefits and was raised where it could relieve the restrictions on availability of public finance. In practice value capture was only relevant in Class 1 cities, where there are substantial user benefits even under a constrained public finance regime. In these circumstances value capture can help towards financing the socio-economically optimal strategy (as represented by the Benchmark Objective Function). In Class 2 cities, there are no substantial user benefits under a constrained public finance regime and so there is limited scope for value capture. In Class 3 cities there is no significant financial constraint, and availability of additional finance will not lead to an enhanced strategy. In Class 4 cities there are typically no significant user benefits to be captured. Thus value capture appears to have a very limited role in financing optimal strategies.
3.4
Private sector operation of public transport
Private operation of public transport is possible in a regulated regime (as represented by the Benchmark Objective Function (BOF)) or in a deregulated regime (as represented by the Deregulated, and Half Regulated, Objective Functions (DOF and HOF)).
In both cases it is often argued that the operating costs, for a given level of service, are reduced if public transport is operated privately. We were unable to find any convincing evidence that this is the case although some evidence did subsequently emerge from the ISOTOPE project (ISOTOPE, 1998). However, we conducted sensitivity tests to assess the impact. These suggest that operating cost savings would have relatively small impacts on the overall social benefit, or the specification of the optimal strategy unless savings approaching 30% were to be achieved. There may be benefits to be gained or adverse effects from private sector operation, as listed in Section 2.2, but they need to be more convincingly demonstrated. As noted in Section 2.2, changes in operating costs as a result of private operation were not modelled in the main optimisation work, although they were considered in subsequent sensitivity tests. Furthermore, it should be noted that a change in operating costs has no effect on the assumption of a required internal rate of return of 15% for private sector operation in a deregulated regime.
FATIMA: FINANCIAL ASSISTANCE FOR TRANSPORT INTEGRATION IN METROPOLITAN AREAS: FINAL REPORT PART 1
The problematic nature of complete deregulation led to the consideration of HOF (the half-regulated regime) which allowed for subsidy to be paid to the private operator whilst still keeping an essentially deregulated regime. Since there are a large number of mechanisms for providing subsidy, the half-regulated regime was less clearly defined than either the fully deregulated regime or the fully regulated regime. In spite of this imprecision, though, the FATIMA results showed that whilst the HOF-optimal solutions were always preferable to DOF-optimal solutions (over a 30 year time horizon), they were never superior to Constrained Objective Function (COF) optima. Thus, over a 30 year period, all deregulated regimes (both HOF and DOF) were inferior to the constrained regulated regime.
3.5
Recommendations for the design of optimal transport strategies
The following recommendations can be made for policy makers on the design of optimal transport strategies:
1. Strategies should be based on combinations of measures, and should draw fully on the synergy between successful measures.
2. The key elements of a successful strategy should be public transport measures and car user charges. In most cases, the public transport measures should include increased service levels and/or reductions in fares. However, the degree of such changes will clearly depend on the service and fare levels in the base case. Car user charges can be applied through road pricing or parking charges.
3. There should generally be a distinction between peak and off-peak implementation of public transport and car user charge measures.
4. Low cost road capacity improvements should generally be included in a successful strategy. However, it should be emphasised that such improvements should come from measures that genuinely improve traffic efficiency, given a fixed level of infrastructure. Such measures would typically include: traffic signal coordination and optimisation; telematics measures; and other traffic management measures. Low cost road capacity improvements should not be introduced if they have a negative effect on plans for city centre pedestrianisation, traffic calming in residential neighbourhoods, or enhancements to pedestrian mobility or safety.
5. Large-scale public transport infrastructure projects would typically not be part of an optimal strategy. However, medium-scale and small-scale infrastructure projects, such as guided bus or improvements to the public transport vehicle fleet, may be beneficial.
6. In many situations, car user charges will generate sufficient revenue to finance the other elements of the optimal strategy, assuming that the initial capital costs can be raised and financed from revenue. It is important that the revenues are used to finance the optimal strategy, rather than to support other transport schemes which may detract from the strategy.
FATIMA: FINANCIAL ASSISTANCE FOR TRANSPORT INTEGRATION IN METROPOLITAN AREAS: FINAL REPORT PART 1
transport policy can be used to subsidise other areas of public policy.
3.6
Recommendations for the involvement of the private sector
The following recommendations for policy-makers can be extracted from the discussion above:
1. In many cities it will be possible, following the methodology outlined in Section 3.7, to identify strategies which are optimal, and whose costs over a 30 year evaluation period are met in full by payments from users. Care will needed to ensure that the pattern of charges on users is politically acceptable and legally feasible.
2. Even in the circumstances in (1), city authorities may not be able to raise the finance required for initial investment in the strategy. In such situations, the private sector may be able to finance the strategy, and be repaid either directly by users or by the city authorities using payments by users. Examples include investment in new infrastructure and the introduction of road pricing schemes. In either case, the user charges should be consistent with the strategy: fares or charges imposed at higher than optimal levels to satisfy the private sector can significantly reduce the performance of the strategy. Furthermore, where the private sector requires a higher rate of return than the public sector discount rate, this may result in a more constrained, and less beneficial, strategy. The implications of this for involving the private sector need to be carefully assessed.
3. Where the financial costs of the strategy exceed the revenues, it may still be acceptable for city authorities to finance them. The optimal strategies in FATIMA have been generated on the basis that the opportunity cost of using finance for them is fully justified. Where city authorities cannot raise the initial finance, it may be appropriate to involve the private sector, as in (2). However, the private sector will need to be reimbursed in part from future tax revenue, or from future revenue generated by reducing public expenditure on other sectors.
4. Where public finance is limited, the optimisation procedures used in FATIMA can identify the appropriate modification to the strategy to achieve the optimal performance within the financial constraint. Such strategies will usually have smaller social benefits than those without such constraints.
5. In the situation in (4), value capture may offer an opportunity for raising additional finance to help support the transport system. Such finance, which would not involve (later) repayments by transport users or the city authority, should be distinguished from the private finance arrangements in (2), which do involve such repayments. However, within the range of conditions tested, value capture appears not to offer the potential for significantly improving the overall strategy.
FATIMA: FINANCIAL ASSISTANCE FOR TRANSPORT INTEGRATION IN METROPOLITAN AREAS: FINAL REPORT PART 1
7. Private sector operation has been implemented through deregulation, in which operators are free to determine service levels and fares, and through franchising, where the city authority specifies them. If a city authority decides that private operation is beneficial, it should use, where legally possible, a franchising model in which it specifies the objectives and the optimal service levels and fares.
8. If a deregulation model is required (in order to comply with national law), private operators should not be given complete freedom to determine the operating conditions which meet their profitability target, even if the level of profitability is itself constrained as a result. There are typically a number of combinations (e.g. of fares and frequency) which achieve a given level of profitability, and not all will be equally effective in terms of public policy objectives.
3.7 Methodological
recommendations
The key steps for strategy/policy formulation, in the order they should occur, are given below. Of these steps, the most problematic in terms of practical transport policy-making are steps 1 and 2, and they should be given special attention by policy-makers:
1. identify the policy objective(s) clearly;
2. where a set of policy objectives is identified, indicate what the appropriate trade-off is between them (assuming, usually correctly, that they are to some extent in conflict);
3. identify the set of policy measures which are to be considered, and which can be expected to have a strategic impact (in particular, list those which meet the latter requirement);
4. specify the range(s) within which the measures in point 3 can be applied, and the factors which limit that range (financial, political, legislative etc.);
5. specify any other overall constraints (e.g. financial) on the specification of optimal strategies;
6. employ a transport model which enables the full range of measures in point 3 to be assessed against all the objectives (from point 1), taking into account of all the user responses (mode, time of day, destination, frequency, route) of strategic relevance, and all the supply interactions (congestion, overcrowding, queuing) of strategic relevance;
7. follow the optimisation procedure (as set out in Section 1.5 of this report) to identify the optimum, taking into account constraints where appropriate;
8. check that this optimum is feasible and acceptable and modify if necessary;
9. decide whether it is appropriate to use private finance or private sector operation, or both. If so, decide how best to employ them within the context of a socio-economically optimum strategy.
FATIMA: FINANCIAL ASSISTANCE FOR TRANSPORT INTEGRATION IN METROPOLITAN AREAS: FINAL REPORT PART 1
3.8
Recommendations for further research
The general approach taken in FATIMA was well accepted, particularly by the city authorities involved in the consultation procedure. However, the approach could be further refined in a number of directions, as given below:
1. The objective functions have no measure of equity in them. Issues of equity arise in two different aspects, amongst others. Firstly, there is the issue of intrazonal equity, concerning the relative differences in benefits received by different socio-economic groups living in the same neighbourhood. Secondly, there is the issue of interzonal equity, which concerns the differences in benefit received by inhabitants of different neighbourhoods. It is recommended that both issues of equity be considered in future research into the construction of objective functions. Furthermore, it is clearly necessary that the transport models used in the optimisation process can output the values of equity indicators; research is likely to be needed for the further development of transport models so that they can accomplish this.
2. The choice of measures to be used for forming optimal packages did not include land use measures. This was due to the lack of availability of appropriate models for representing combined land-use / transportation policies at the start of the project. However, as such models are currently being developed (including ones for several of our case study cities), the possibility should arise for including land use measures in future optimisation work.
3. Research should be carried out into making a comprehensive assessment of the consequences of private sector operation of public transport, both under regulated and deregulated regimes. Such an assessment should not be limited to financial costs of operation, but should also take into account potential external effects of private operation such as: increased levels of unemployment as a result of "downsizing"; changes in employees’ wages; changes in safety levels and changes in other environmental benefits or costs.
4. The policy measures considered by FATIMA were, for each city, relative to a “do-minimum” strategy specified by the respective city authority. Typically, the measures involved with such strategies are those to which an authority has made a full commitment. It follows that the recommendations given make an implicit critique of a city’s committed policies. However, it could be argued that such an approach might misrepresent a city’s intentions since it might be planning “likely” policies to which it has not made a full commitment. Such policies were not considered explicitly in the FATIMA optimisation work. It is thus recommended that, in future optimisation work, a method be devised which takes account of potential city policies to which there has not yet been full commitment.
FATIMA: FINANCIAL ASSISTANCE FOR TRANSPORT INTEGRATION IN METROPOLITAN AREAS: FINAL REPORT PART 1
4
REFERENCES
ISOTOPE (1998) Improved structure and organisation of urban transport operations of passengers in Europe (ISOTOPE). Final Report of Work Package 2. DG7 Urban Transport Research, 4th Framework Programme. EC, Brussels.
OPTIMA (1997) Optimisation of Policies for Transport Integration in Metropolitan Areas, Final Report, DG7 Urban Transport Research, 4th Framework Programme. EC, Brussels.
FATIMA: FINANCIAL ASSISTANCE FOR TRANSPORT INTEGRATION IN METROPOLITAN AREAS: FINAL REPORT PART 1
ANNEX 1
INFORMATION ON OPTIMA
A1.1 Objectives of OPTIMA
Project OPTIMA was conducted between December 1995 and May 1997, and had the following objectives:
(i) to identify optimal urban transport and land use strategies for a range of urban areas within the EU;
(ii) to compare the strategies which are specified as optimal in different cities, and to assess the reasons for these differences;
(iii) to assess the acceptability and feasibility of implementation of these strategies both in nine case study cities (Edinburgh, Merseyside, Vienna, Eisenstadt, Tromsø, Oslo, Helsinki, Torino and Salerno) and more widely in the EU; and
(iv) to use the results to provide more general guidance on urban transport policy within the EU.
A1.2 OPTIMA objective functions
Project OPTIMA was designed to identify strategies which were optimal in terms of economic efficiency and sustainability. Briefly, the efficiency objective function involved:
• calculating the net social benefits (to travellers, operators and government) generated by a given strategy in a future "horizon" year (typically 2015) when compared with a specified "do-minimum" strategy;
• calculating the net present value of these benefits, less any initial capital costs, using conventional discounting procedures and a nation-specific discount rate;
• calculating the net present value of the financial outlay (costs less revenues) for the strategy in the same way, and assigning a shadow price of 1.25 euro per euro of net financial outlay, to give a present value of finance (PVF).
Thus this objective function, denoted EEF (Economic Efficiency Function) represented a conventional cost-benefit analysis, with the addition of a shadow price for financial costs to the public sector. However it did not include environmental impacts or equity impacts.
The Sustainability Objective Function (SOF) focused solely on conditions in the horizon year, based on the net social benefits in that year (as in the EEF) less the costs of energy consumption. Energy consumption was used as a proxy for the depletion of scarce resources generally and was assessed using:
• a shadow price (of 5 euro per euro) for all energy consumption; and
• a high penalty for energy consumption which exceeded that in the do-minimum.
FATIMA: FINANCIAL ASSISTANCE FOR TRANSPORT INTEGRATION IN METROPOLITAN AREAS: FINAL REPORT PART 1
A1.3 Policy measures
The policy measures tasted in OPTIMA were identical to those in FATIMA, but without the distinction between peak and off-peak values and short and long-stay parking charges. The maximum values for capacity increases, road pricing and parking charges were roughly double those used in FATIMA, and the costs of implementation and operation estimated by the cities were in some cases different from those in FATIMA. Direct comparisons between the results of the two projects are thus unreliable.
[image:28.595.53.483.299.444.2]A1.4 Results from OPTIMA
Table A1 provides an overview of the OPTIMA results; more detailed output is given in Part 2 (Section 6).
EEF SOF
Public transport infrastructure - ** Low cost road capacity
improvements
*** **
Increase in public transport frequency
* **
Reduction in public transport fares
** ***
Road pricing and/or increased parking charges
** ***
* indicates there is (overall) a small net benefit to using the measure ** indicates there is (overall) a medium net benefit to using the measure *** indicates there is (overall) a strong net benefit to using the measure
Table A1 : Summary of beneficial measures for the two objective functions in OPTIMA
The Economic Efficiency optimum (EEF)
From Table A1 and the more detailed results, the economic efficiency optimum is likely to involve:
• no new public transport infrastructure investment;
• low cost improvements in road capacity;
• no use of road capacity reductions to discourage car use;
• improvements in public transport by increasing frequency and/or reducing fares; and
• restrictions on car use involving either road pricing or increased parking charges.
Public transport infrastructure investment is included in the two UK case studies, where the level of public transport subsidy is currently lowest. However, they are included only at the medium level, which implies bus-based improvements. Elsewhere, the high resource cost of investment makes such measures economically inefficient.
FATIMA: FINANCIAL ASSISTANCE FOR TRANSPORT INTEGRATION IN METROPOLITAN AREAS: FINAL REPORT PART 1
generate increased efficiency provided that the costs of doing so are low, and the growth of car use is controlled by other means. Conversely there is no justification on efficiency grounds, for using road capacity reductions to discourage car use.
Public transport changes generally include an increase in frequency and a decrease in fares. Exceptions to this are Vienna (which has an increase in fares), Tromsø and Oslo (which have a decrease in frequency) and Helsinki (which has both an increase in fares and a decrease in frequency). There is some correlation between such changes and high levels of public transport subsidy, suggesting that some reduction in the resources used for public transport may improve efficiency.
Restrictions on car use may involve introduction of a road pricing charge, or an increase in parking charges, but never both. For a large number of trips these measures are essentially interchangeable, although road pricing will impact on through traffic in the city centre, and parking charges will not, in practice, apply to private parking. Typically, road pricing charges are combined with a reduction in parking charges, while still achieving a reduction in car use. In three cases (Merseyside, Tromsø and Helsinki) no extra financial restriction is imposed on car use suggesting that current parking charge levels are optimal. This appears to be associated with lower levels of congestion in the do-minimum conditions.
In consultation with the city authorities, these results were broadly accepted, except that both Merseyside and Salerno considered the recommended strategies financially infeasible. There were, in addition, concerns over the feasibility of the higher levels of road capacity increase and the introduction of zero fares; the need for new legislation for road pricing and comprehensive parking control; and the public's attitude to higher charges and to increased road capacity. Where possible these were addressed in Project FATIMA.
The Sustainability optimum (SOF)
When compared with the economic efficiency optimum, Table A1 and the more detailed results show that the sustainability optimum is most likely to involve:
• investment in new public transport infrastructure;
• similar levels of low cost improvement in road capacity;
• further improvement in public transport by increasing service levels and/or reducing fares; and
• further restrictions on car use, involving either road pricing or increased parking charges.
Public transport infrastructure investment becomes more acceptable when no emphasis is given to initial investment costs and the importance of reducing fuel consumption, and hence car use, is increased. Road capacity improvements are typically at the same level as for the economic efficiency optimum, and the arguments above apply. Public transport changes may still include service level reductions (in Tromsø, Oslo and Torino) but the reductions are typically lower than with the economic efficiency optimum. Fares are reduced dramatically in all cases except Vienna, where there is a small increase. Restrictions on car use still involve either road pricing charges or increases in parking charges. However, the charges now apply in all cities and are (except for Eisenstadt and Torino) higher than in the economic efficiency optimum.
FATIMA: FINANCIAL ASSISTANCE FOR TRANSPORT INTEGRATION IN METROPOLITAN AREAS: FINAL REPORT PART 1
Comparison of EEF and SOF optima with the BOF optima from FATIMA
Table A2 gives the BOF values (i.e. the values calculated by the Benchmark Objective Function) of the policies that optimised BOF, and compares them with the BOF values of the policies that optimised EEF and SOF (in OPTIMA). It can be seen that in general, as would be expected, no EEF- or SOF-optimal policy has a higher BOF value than that of the BOF-optimal policy. The one exception to this rule, concerning the Merseyside SOF-optimal policy, occurs because a higher level of road capacity increase was allowed in OPTIMA.
Edinburgh M’side Vienna Eisenstadt Tromsø Oslo Helsinki Torino Salerno
BOF optima 492 687 142 3.9 22 696 183 128 24
EEF optima 458 651 -875 -7.0 19 271 -945 91 15
SOF optima 412 736 -1195 -7.0 13 541 -54 -271 12
Table A2: Summary table - BOF values of BOF-optima (from FATIMA), and EEF- and SOF-optima (from OPTIMA)
A1.5 Policy recommendations from OPTIMA
The following recommendations for policy makers were drawn in project OPTIMA:
• strategies should be based on combinations of measures, and should draw fully on the synergy between success measures;
• economically efficient measures can be expected to include low cost improvements to road capacity, improvements in public transport (increased service levels or reductions in fares), and increases in the cost of car use;
• public transport infrastructure investment is not likely, in the majority of cases, to be a key element in economically efficient strategies;
• reductions in capacity to discourage car use are not likely to be economically efficient;
• the scale of changes in service levels and fares will be influenced by the current level of subsidy; in some cases a reduction in service levels or an increase in fares may be justified on economic grounds;
• the scale of increase in costs of car use will depend in part on current levels of congestion; the study suggests that road pricing and parking charge increases are broadly interchangeable, but this needs assessing in more detail;
• in most cases economically efficient strategies can be designed which are financially feasible, provided that revenues can be used to finance other strategy elements;
• the pursuit of sustainability is likely to justify investment in public transport infrastructure, further improvements to public transport services and/or fares, and further increases in the cost of car use;
• availability of finance will be a major barrier to implementation of many sustainability-optimal strategies, and further work is needed to investigate the extent to which financial costs can be reduced by strategies which are slightly sub-optimal;