University of Southern Queensland
Faculty of Engineering and Surveying
The Effects of Small Distributed
Generation on the Electrical Distribution
etwork
A dissertation submitted by
Paul Gordon Millers
In fulfilment of the requirements of
Courses EG4111 and EG4112 Research Project
Towards the degree of
Bachelor of Electrical and Electronic Engineering
ABSTRACT
The traditional electrical supply network relies on large remote power generating stations feeding energy radially over long transmission lines, through distribution networks to the electrical energy customer. This network has been optimised for the radial flow of power from the large power stations to the customer.
There has been increasing political and social pressures to move towards renewable power sources to generate electrical energy. A substantial portion of the renewable generation is being installed within the distribution networks. The smallest of the distributed generation (DG) systems are installed at residential and commercial customer’s premises. In Queensland these systems can be up to 10 kW per phase and can export energy back onto the electrical grid.
The addition of large numbers of Small DG Systems onto a distribution network can see the power flowing back into the upstream network. This research project examines the effect that high numbers of these Small DG Systems will have on the protection systems and quality of supply (QoS) of distribution networks.
This research project sought to examine the effects of high penetration of Small DG Systems on two representative distribution feeders. The feeders chosen were a high quality residential feeder called Ross Plains number 4 (ROPL-04) and a long rural single wire earth return (SWER) known at Karara. These two feeders represented the extremes of the possible distribution feeder types. They were chosen so that an understanding of the extent of issues surrounding high penetration of Small DG Systems on distribution networks could be developed.
The power system modelling software PSS Sincal was used to develop models of the two distribution feeders and the Small DG Systems. The models were tested with a number of credible Small DG Systems penetration scenarios in order to see if and at what level of penetration the QoS became unacceptable. This was achieved by modelling the networks with realistic customer load and solar insolation values to see if the feeder low voltage (LV) exceeded prescribed limits. The QoS became unacceptable when eth prescribed limits had been exceeded. Testing was also was conducted using credible changes in insolation due to cloud movement in order to test for unacceptable LV values. Further testing was carried out using reactive compensation to resolve excessive voltage problems.
The protection systems were tested by comparing the protection device settings and ratings with fault current values obtained from the network models when the Small DG System penetrations were high.
It was found that the ROPL-04 feeder had substantial resilience to high levels of Small DG System penetrations for both QoS and protection performance. The Karara SWER network was much less resilient and showed excessive voltage problems at low levels of Small DG System penetrations. The protection systems on the Karara SWER were not seriously compromised by high levels of Small DG System penetration.
DISCLAIMER
University of Southern Queensland
Faculty of Engineering and Surveying
EG4111 & EG4112 Research Project
Limitations of Use
The Council of the University of Southern Queensland, its Faculty of Engineering and Surveying, and the staff of the University of Southern Queensland, do not accept any responsibility for the truth, accuracy or completeness of material contained within or associated with this dissertation.
Persons using all or part of this material do so at their own risk, and not at the risk of the council of the University of Southern Queensland, its Faculty of Engineering and Surveying or the staff of the University of Southern Queensland.
This dissertation reports an educational exercise and has no purpose or validity beyond this exercise. The sole purpose of the course pair entitled “Research Project” is to contribute to the overall education within the students chosen degree program. This document, the associated hardware, software, drawings and other material set out in the associated appendices should not be used for any other purpose: if they are used, it is entirely at the risk of the user.
Prof Frank Bullen Dean
CERTIFICATION
I certify that the ideas, designs and experimental work, results, analyses and conclusions set out in this dissertation are entirely my own effort, except where otherwise indicated and acknowledged.
I further certify that the work is original and not been previously submitted for assessment in any other course or institution, except where specifically stated.
Paul Gordon Millers
Student umber: 0050078154
__________________________________ Signature
ACKNOLEDGEMENTS
TABLE OF CONTENTS
ABSTRACT ... ii
DISCLAIMER... iii
CERTIFICATION... iv
ACKNOLEDGEMENTS ...v
LIST OF FIGURES... xiv
LIST OF TABLES ... xvii
LIST OF APPENDICIES ... xviii
NOMENCLATURE ... xix
GLOSSARY OF ABREVIATIONS AND TERM ...xx
CHAPTER 1 - INTRODUCTION...22
1.1 Overview ...22
1.2 Fundamental Information ...22
1.2.1 Electrical Supply Network Overview...22
1.2.2 Electrical Supply Networks in Australia ...23
1.2.3 Queensland Electrical Supply Network ...23
1.2.4 Generation in Queensland ...24
1.2.5 Distributed Generation in Queensland ...24
1.2.6 The Present State of Small DG Systems in Queensland ...24
1.2.7 Increasing Distributed Generation...25
1.2.8 The Future of Small DG Systems in Queensland...25
1.2.9 Small DG Systems Defined...26
1.2.10 Low and High Voltage Distribution...26
1.2.11 Voltage Control ...27
1.2.12 Impacts of Small DG Systems...27
1.2.13 Quality of Supply ...28
1.2.14 Protection Systems ...28
1.3 Research Project Justification ...28
1.3.1 Effects on the LV Distribution ...29
1.3.2 Effects on the HV Distribution...29
1.3.3 General Research Objectives...29
1.4 Methodology ...29
1.4.2 Distribution Feeder Types ...30
1.4.3 Expected Small DG System Dispersion ...30
1.4.4 Expected Small DG System Types ...30
1.4.5 Network Model Permutations ...31
1.4.6 Small DG System Weather Performance ...32
1.4.7 Methodology to Investigate Protection Problem...32
1.4.8 Methodology to Investigate QoS Problem ...33
1.4.9 Corrective Network Devices ...33
1.5 Objectives ...33
1.6 Dissertation Outline...34
1.6.1 Background Information ...34
1.6.2 Literature Review ...34
1.6.3 Test Data...35
1.6.4 Network System Modelling...35
1.6.5 Network System Modelling...35
1.6.6 Quality of Supply Modelling...35
1.6.7 Analysis of Protection Impacts...35
1.6.8 Analysis of QoS Impacts ...35
1.6.9 Conclusions ...36
CHAPTER 2 - BACKGROUND INFORMATION...37
2.1 Outline of Background Information ...37
2.2 Legislation and Regulations ...37
2.2.1 Queensland Electricity Act 1994...37
2.2.2 Australian Standards...37
2.2.3 AS4777.3 Clause 5.3 ...38
2.2.4 Inverter Operating Limits ...39
2.2.5 IEC 60909...40
2.2.6 IEC 60255...40
2.3 Distribution Feeder Protection ...40
2.3.1 Inverse Definite Minimum Time...41
2.3.2 Over-Current, Earth-Fault and Sensitive Earth-Fault Protection ...42
2.3.3 Three Phase Network HV IDMT Protection ...43
2.3.4 SWER Network HV IDMT Protection ...44
2.3.5 Distribution Network HV Fuse Protection ...44
2.3.7 Distribution Network Protection Grading ...44
2.3.8 Protection Failure ...45
2.4 Distribution Feeder Quality of Supply ...46
2.4.1 QoS and Grid Connected Inverters...46
2.4.2 Responsibility of a Generator...46
2.4.3 Responsibility of an Electrical Supply Authority...46
2.5 Voltage Control ...47
2.5.1 Zone Substation Voltage Control ...47
2.5.2 Line Regulators ...47
2.5.3 Residential Distribution Network Voltage Control...47
2.5.4 SWER Network Voltage Control ...48
2.5.5 Reactive Power and Network Voltage Control ...48
2.6 Distribution Feeders ...48
2.7 Residential Distribution Feeder...48
2.7.1 Major Urban Residential Feeder ...49
2.7.2 Ross Plains Zone Substation Configuration ...50
2.7.3 ROPL-04 Feeder Configuration ...51
2.7.4 ROPL-04 Loads...51
2.7.5 ROPL-04 Protection Systems...52
2.7.6 ROPL-04 Voltage Control...53
2.7.7 ROPL-04 Weather Data ...53
2.8 SWER Distribution Feeder...53
2.8.1 SWER Feeder Location...53
2.8.2 Lemontree and Karara SWER Feeder Configuration...55
2.8.3 SWER Network Loads ...57
2.8.4 SWER Network Protection Systems ...59
2.8.5 SWER Network Voltage Control ...61
2.8.6 Karara SWER Weather Data ...63
2.9 The Small DG Systems ...63
2.9.1 Photo Voltaic Panels ...63
2.9.2 Grid Connect Inverters ...65
2.9.3 Complete System...65
2.9.4 Grid Connect Performance ...66
2.9.5 Weather Related Performance...67
2.10.1 Anticipated Protection System Problems ...69
2.10.2 Anticipated QoS Problems ...70
2.11 Network Support Devices ...70
2.11.1 Voltage Regulators ...70
2.11.2 Reactive Compensation ...70
2.11.3 Static Reactive Compensation...71
2.12 Network Modelling ...72
2.12.1 Major Urban Residential Feeder Models ...73
2.12.2 SWER Feeder Models ...73
CHAPTER 3 - LITERATURE REVIEW...75
3.1 Outline of Literature Review...75
3.2 Steady State DG In-Feed Issues ...75
3.2.1 Steady State – Paper One ...75
3.2.2 Steady State – Paper Two...75
3.2.3 Steady State – Paper Three...76
3.3 Fluctuating DG In-Feed Issues...76
3.3.1 Fluctuating In-Feed – Paper One...76
3.3.2 Fluctuating In-Feed – Paper Two ...76
3.3.3 Fluctuating In-Feed – Paper Three ...77
3.3.4 Fluctuating In-Feed – Paper Four...77
3.3.5 Fluctuating In-Feed – Paper Five ...78
3.3.6 Fluctuating In-Feed – Paper Six ...78
3.4 Protection Systems and DG Issues ...78
3.4.1 DG Protection Issues – Paper One ...78
3.4.2 DG Protection Issues – Paper Two...78
3.4.3 DG Protection Issues – Paper Three...79
3.4.4 DG Protection Issues – Paper Four ...79
3.4.5 DG Protection Issues – Paper Five...79
3.4.6 DG Protection Issues – Paper Six...80
3.4.7 DG Protection Issues – Paper Seven ...80
3.4.8 DG Protection Issues – Paper Eight ...80
3.4.9 DG Protection Issues – Paper Nine ...81
3.4.10 DG Protection Issues – Paper Ten...81
3.5 Conclusions to Literature Review ...81
CHAPTER 4 - SMALL DG SYSTEM TEST DATA ...83
4.1 Testing ...83
4.2 Small DG System Fault Contribution Test...83
4.2.1 Fault Contribution Results...84
4.3 Small DG System Cloud Movement Test ...85
4.3.1 Solar Radiation Data Collection...88
4.3.2 Typical Sunny Day...88
4.3.3 Cloudy Day Data ...90
4.4 Testing – Other Issues ...93
4.4.1 Inverter One Response ...93
4.4.2 Inverter Two Response...94
4.4.3 Laboratory Fault Testing ...94
4.4.4 Laboratory Testing Conclusions...95
4.5 Conclusions to Testing ...95
CHAPTER 5 - NETWORK MODELLING ...97
5.1 Network Models ...97
5.2 ROPL-04 Feeder Model ...97
5.2.1 ROPL-04 Feeder Model – Zone Substation ...97
5.2.2 ROPL-04 Feeder Model – HV Distribution Network ...99
5.2.3 ROPL-04 Feeder Model – HV Distribution Substations...99
5.2.4 ROPL-04 Feeder Model – LV Distribution Network...101
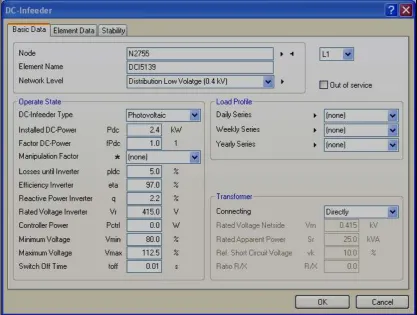
5.2.5 ROPL-04 Feeder Model – DC-Infeeder ...102
5.2.6 ROPL-04 Model and Lumped Installations ...103
5.3 Karara SWER Feeder Model...104
5.3.1 Karara SWER Feeder Model – 11kV Source...104
5.3.2 Karara SWER Feeder Model – SWER Isolators...105
5.3.3 Karara SWER Feeder Model – Regulator ...107
5.3.4 Karara SWER Feeder Model – Distribution Transformer ...109
5.3.5 Karara SWER Feeder Model – DC-Infeeder ...110
5.3.6 Complete Karara SWER Feeder Model ...111
5.3.7 Karara SWER Model and Lumped Installations ...112
5.4 Model Validation...113
5.4.1 ROPL-04 Model Validation ...113
5.4.2 ROPL-04 with Lumped Load Model Validation ...114
5.4.4 Karara SWER with Lumped Load Model Validation ...116
CHAPTER 6 - PROTECTION SYSTEM MODELLING...117
6.1 Protection System Models...117
6.1.1 PSS Sincal Fault Calculations ...117
6.1.2 PSS Sincal DC-Infeeder and Fault Calculations ...119
6.1.3 PSS Sincal LV and Fault Calculations ...122
6.1.4 PSS Sincal HV Fault Calculations ...123
6.1.5 PSS Sincal Fault Modelling Conclusions...125
6.2 Small DG System Fault Model ...126
6.2.1 Example of Fault Contribution by Small DG System ...126
6.3 Faults on the ROPL-04 Network...128
6.3.1 ROPL HV Fault Levels ...128
6.3.2 ROPL HV Transformer Fault Levels ...130
6.3.3 ROPL LV Fault Levels...130
6.4 Faults on the Karara SWER Network ...131
6.4.1 Karara SWER HV Fault Levels ...131
6.4.2 Karara Recloser Section HV Fault Levels ...131
6.4.3 Reedy Creek Recloser Section HV Fault Levels...132
6.4.4 Karara SWER LV Fault Levels...132
CHAPTER 7 - QUALITY OF SUPPLY MODELLING ...133
7.1 QoS System Models ...133
7.1.1 PSS Sincal Load Flow ...133
7.2 Constant PV In-feed ...135
7.2.1 ROPL-04 and Constant PV In-feed...135
7.2.2 ROPL-04 and Constant PV In-feed Modelling - Results ...137
7.2.3 Karara SWER and Constant PV In-feed ...138
7.2.4 Karara SWER and Constant PV In-feed Modelling - Results...139
7.3 Fluctuating PV In-feed ...141
7.3.1 ROPL-04 and Fluctuating PV In-feed at High Demand ...141
7.3.2 ROPL-04 Maximum Load and Fluctuating PV - Results ...143
7.3.3 ROPL-04 at Minimum Load and Fluctuating PV - Results ...145
7.3.4 Karara SWER and Fluctuating PV In-feed Modelling Results ...147
7.4 Reactive Compensation ...148
7.4.1 PSS Sincal Reactive Compensation Devices ...148
7.4.3 ROPL-04 and Reactive Compensation - Results ...149
7.4.4 Karara SWER and Reactive Compensation - Results ...149
7.5 QoS Modelling Summary...150
7.5.1 ROPL-04 QoS modelling Summary...150
7.5.2 Karara SWER QoS Modelling Summary...151
CHAPTER 8 - ANALYSIS ...152
8.1 Protection System Modelling ...152
8.1.1 Three Phase Distribution HV Protection...152
8.1.2 ROPL-04 HV Protection ...152
8.1.3 ROPL-04 HV Transformer Fuse Protection...153
8.1.4 ROPL-04 LV Transformer Fuse Protection ...154
8.1.5 Karara SWER HV Protection...154
8.1.6 Karara Recloser HV Protection ...154
8.1.7 Reedy Creek Recloser HV Protection ...155
8.1.8 Karara SWER HV and LV Distribution Substation Fuses...156
8.2 Quality of Supply Modelling...156
8.2.1 ROPL-04 Constant In-Feed QoS Modelling ...156
8.2.2 ROPL-04 Fluctuating In-Feed QoS Modelling ...156
8.2.3 ROPL-04 Reactive Compensation QoS Modelling...157
8.2.4 Karara SWER Constant In-Feed QoS Modelling...157
8.2.5 Karara SWER Fluctuating In-Feed QoS Modelling...158
8.2.6 Karara SWER Reactive Compensation QoS Modelling ...158
CHAPTER 9 - CONCLUSIONS ...159
9.1 Network Modelling ...159
9.1.1 PSS Sincal and Protection Modelling ...159
9.1.2 PSS Sincal and QoS Modelling...160
9.1.3 Future Modelling ...160
9.2 Protection System Modelling Conclusions ...160
9.2.1 ROPL Protection System Modelling Conclusions ...160
9.2.2 Karara SWER Protection System Modelling Conclusions ...161
9.2.3 General Protection Conclusions ...161
9.3 Quality of Supply Modelling Conclusions ...162
9.3.1 ROPL-04 Residential Feeder QoS ...162
9.3.2 Karara SWER Long Rural Feeder QoS...162
9.3.4 ROPL-04 and Reactive Compensation...163
9.3.5 Karara SWER and Reactive Compensation ...163
9.3.6 Reactive Compensation Conclusions ...163
9.4 Future Research ...164
APPENDIX A ...166
LIST OF FIGURES
Figure 2.1 – Various IDMT Curves
Figure 2.2 – Example Three Phase Protection Curves Figure 2.3 – Example of Grading Margin
Figure 2.4 – Location of Distribution Feeder ROPL-04
Figure 2.5 – HV Lines and Cables of Distribution Feeder ROPL-04 Figure 2.6 – Ross Plains ZS Total Loads
Figure 2.7 – ROPL-04 Load Profiles
Figure 2.8 – Location of the Lemontree 11kV Feeder Figure 2.9 – Lemontree Feeder 11kV and 12.7 kV SWER
Figure 2.10 – Configuration of the Lemontree Feeder and Karara SWER Figure 2.11 – Extent and size of the Karara SWER network
Figure 2.12 – Lemontree Feeder Load Profiles
Figure 2.13 – Assumed Karara SWER network load profiles Figure 2.14- Lemontree Feeder protective device arrangement Figure 2.15- Lemontree Feeder regulating device arrangement
Figure 2.16 – Typical Silicon PV Wavelength verses Output (Apogee Instruments 2010) Figure 2.17 – PV Panel Current, Voltage and Power Relationship to Solar Radiation (Suntech 2010)
Figure 2.18 – Typical Small DG System Arrangement
Figure 2.19 - Typical Clear Day PV Array Output Power versus Time of Day Figure 2.20 – Simplified Electrical Supply Network and Radial Power Flow Figure 2.21 – Possible Power Flows as a Result of DG Inclusion
Figure 2.22 – Examples of Shunt Capacitor Banks (ABB 2010) Figure 2.23 – STATCOM Block Diagram (Suresh Kumar 2010) Figure 4.1 – Fault Test Circuit
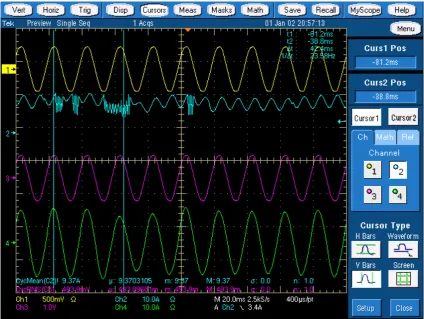
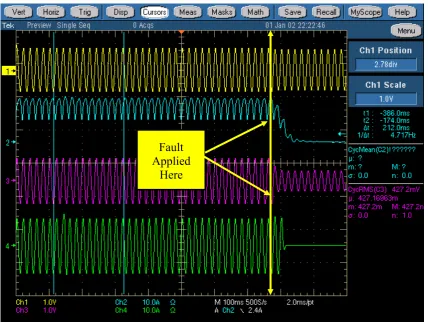
Figure 4.2 - Grid Side Current Before and After the Fault Event Figure 4.3 – Inverter Side Current Before and After the Fault Event
Figure 4.4 – Inverter Side and Grid Current Before and After the Fault Event
Figure 4.5 – Apogee SP-110 Pyranometer Output verse Solar Radiation Spectrum (Apogee 2010)
Figure 4.9 - Cloud Free Data for PV Array voltage and current Figure 4.10 - PV Array Power and Solar Radiation Power
Figure 4.11 – PV Array Voltage and Current during Cloud Movement Figure 4.12 – Solar Radiation and PV Array Power during Cloud Movement Figure 4.13 – Five Minute PV Array Voltage and Current during Cloud Movement Figure 4.14 – Five Minute Solar and PV Array Power during Cloud Movement Figure 4.15 – PV Array Power Rates of Change during Cloud Movement
Figure 4.16 – Aurora PVI-2000 Input and Output Voltage and Current Waveforms Figure 4.17 – SMA 1700 Input and Output Voltage and Current Waveforms Figure 4.18 - SMA 1700 Fault Test Input and Output Currents and Voltages
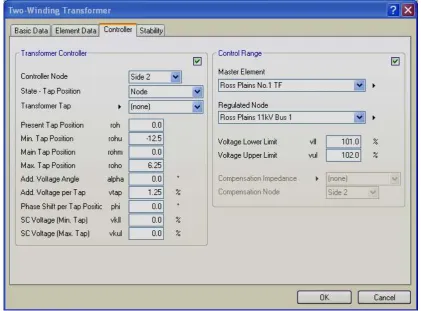
Figure 5.1 – PSS Sincal Transformer Basic Data Ross Plains ZS 66/11 kV Ttransformer Figure 5.2 – PSS Sincal Transformer Controller Ross Plains ZS 66/11 kV Transformer Figure 5.3 – Ross Plains ZS Arrangement.
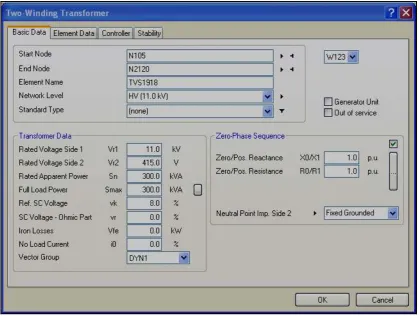
Figure 5.4 – PSS Sincal Two Winding Transformer Basic Data for Distribution Transformer
Figure 5.5 – PSS Sincal Two Winding Transformer Controller for Distribution Transformer
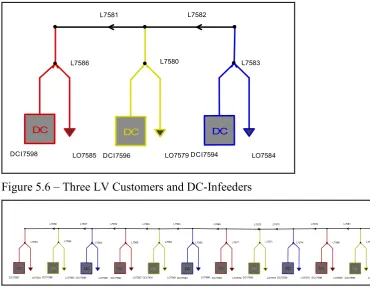
Figure 5.6 – Three LV Customers and DC-Infeeders Figure 5.7 – Twelve LV Customers and DC-Infeeders
Figure 5.8 – Complete LV Network Supplied by Distribution Substation Figure 5.9 – PSS Sincal DC-Infeeder Basic Data Page
Figure 5.10 – Complete ROPL-04 Model with Lumped Installation Figure 5.11 – 11 kV Source Infeeder Basic Data
Figure 5.12 – Karara SWER Isolating Transformer
Figure 5.13 – PSS Sincal Two Winding Transformer Basic Data for SWER Isolator Figure 5.14 – PSS Sincal Two Winding Transformer Controller for SWER Isolator Figure 5.15 - SWER Regulator
Figure 5.16 – PSS Sincal Two Winding Transformer Basic Data for SWER Regulator Figure 5.17 - PSS Sincal Two Winding Transformer Controller for SWER Regulator Figure 5.18 - SWER Distribution Transformer
Figure 5.19 - PSS Sincal Two Winding Transformer Basic Data for SWER Distribution Transformer
Figure 5.20 - PSS Sincal Two Winding Transformer Controller for SWER Distribution Transformer
Figure 5.23 – PSS Sincal Complete Karara SWER Geographic View Figure 5.24 – Karara SWER Lumped Installation
Figure 5.25 – ROPL-04 Load data for the 4th of February 2010
Figure 5.26 – Karara SWER Estimated Load Data for the 23rd of February 2010 Figure 6.1 – Sequence Network for Phase to Earth Fault
Figure 6.2 – PSS Sincal Infeeder Basic Data Page Showing Sequence Impedances Figure 6.3 - PSS Sincal Single Phase to Earth Fault
Figure 6.4 – PSS Sincal DC-Infeeder Basic Data Page
Figure 6.5 – PSS Sincal single phase to earth fault with DC-Infeeder
Figure 6.6 – PSS Sincal Fault Results with two Infeeders and a DC-Infeeder Figure 6.7 – Delta Star Transformer Fault Current Paths
Figure 6.8 - PSS Sincal Delta Star Transformer Fault Current Paths Figure 6.9 - Simple Infeeder and DC-Infeeder Circuit
Figure 6.10 - Results of the phase to earth fault.
Figure 6.11 – Differing Results of Phase to Earth Fault Figure 6.12 – Third Results for Phase to Earth Fault Figure 6.13 – Simplified Single Phase Circuit Diagram Figure 7.1 – Simple Load Flow Example
Figure 7.2 – Simplified Three Phase Load Flow Example
LIST OF TABLES
Table 1.1 – Models for Major urban residential Network Table 1.2 – Models for Principally SWER Network Table 2.1 – IDMT Curve Formulae Data
Table 2.2 – ROPL-04 Protection Settings
Table 2.3 – Lemontree Feeder Protection Settings Table 2.4 – ROPL-04 Protection Settings
Table 7.1 – ROPL-04 Constant In-feed and Even Distribution Results Table 7.2 – ROPL-04 Constant In-feed and Lumped Installation Results Table 7.3 – Karara SWER Constant In-feed with Even Distribution Results Table 7.4 – Karara SWER Constant In-feed and Lumped Installation Results
Table 7.5 – ROPL-04 Fluctuating In-feed and Even Distribution Results at Maximum Demand Period
Table 7.6 – ROPL-04 Fluctuating In-feed and Lumped Installation Results at Maximum Demand Period
Table 7.7 – ROPL-04 Fluctuating In-feed and Even Distribution Results at Minimum Demand Period
LIST OF APPENDICIES
APPENDIX A – Project Specification
NOMENCLATURE
Term Description Unit
V Voltage V
A Ampere A
W Watt W
P Power W
S Apparent Power VA
Q Reactive Power VAr
pf Power Factor
GLOSSARY OF ABREVIATIONS AND TERM
Abbreviation Description
RMS Root mean square.
d.c. Direct Current, containing less than 10% RMS ripple (AS 3000:2006) a.c. Alternating Current. In this document shall be taken to mean at the
frequency of 50Hz (AS 3000:2006)
LV Low Voltage, defined in the AS3000 as being between 50 and 1000V ac (AS 3000:2006).
In the context of this document shall be taken to mean the Queensland distribution low voltage of 415V (three phase a.c.)
HV High Voltage, defined in the AS3000 as exceeding 1000V ac.
In the context of this document shall be taken to mean the Queensland distribution high voltage of 6.6, 11 or 22kV (three phase a.c.)
DG Distributed Generation, generation distributed through out the lower voltage electrical supply network.
Small DG Distributed Generation below 10kW single phase and 30kW three phase.
PV Photo Voltaic, technology using cells of material such as silicon that converts solar energy into electrical energy and in this document taken to mean a panel of cells.
Small DG System
Single phase Distributed Generation system being supplied by 2kW of PV array
OC Over Current, protection method that operates as a result of higher than expected current.
EF Earth Fault, protection method that operates as a result of higher than expected current flowing in the earth path.
SEF Sensitive Earth Fault, protection method that operates when a higher than expected current is flowing in the earth path (although lower than that for EF).
IDMT Inverse Definite Minimum Time, protection system operating parameter that see faster operation at high currents and slower at low currents.
Abbreviation Description
EI Extremely Inverse – Another of the common IDMT curves
Grid Supply Supply of electrical energy taken from the interconnected electrical supply network or the grid.
QoS Quality of Supply, referring to the quality of electrical supply in term of voltage, stability and harmonics
SWER Single Wire Earth Return, a long low density rural network built to economically supply a few widely spaced customers
OLTC On Load Tap Changer – device used to change winding ratio of a transformer automatically in order to maintain the output voltage. Reclosing The closing of a circuit breaker after recently tripping for a fault. Done
so because most faults are transient and supply can be restored without further tripping.
Auto-Reclosing
Automatic closing of a circuit breaker after recent tripping for a fault.
Islanding Distributed Generation system continuing to operate after being isolated from the rest of the electrical supply network or the grid.
Anti-Islanding
A process where a generator connected to a network ceases to operate soon after the grid supply is interrupted to the network.
CT Current Transformer – Device for reducing the high voltage line currents down to manageable levels for use in control and protection devices.
AEMC The Australian Energy Market Commission – Independent Authority which controls and regulates the electrical and gas energy markets in Australia
CHAPTER 1 -
INTRODUCTION
1.1
Overview
The electrical energy supply network is presently in the process of change. There is increasing impetus for the customers of electrical supply authorities to install their own small scale electrical generation systems powered by a variety of sources such as solar energy. These generation systems are usually connected to the electrical supply network and are able to export energy to this network when the total output is not consumed by the load within the owner’s premises. This method of generation is loosely known as Distributed Generation (DG).
There is also increasing numbers of electric vehicles that can both take energy from the electrical supply network to charge their batteries and deliver energy to the network from their batteries through inverters. The electrical supply authorities are considering the ability to deliver energy into the electrical supply network as a method to relieve infrastructure constraints at peak energy demand periods. These systems would also effectively be considered DG.
The traditional configuration of the electrical supply grid is to have large remote power generators feeding electrical energy to the customers over a complex transmission and distribution grid in a radial manner. The operation of the entire existing electrical supply grid is optimised for this configuration.
The inclusion of DG into the existing electrical supply grid will change the operation of this network. This research project investigates the effects that the increasing number of Small DG Systems will have on the operation of the lower levels of the electrical supply network and endeavours to understand the saturation (or penetration) levels where the effect becomes significant.
This research project focuses on the Queensland electrical supply network and the effects of these Small DG Systems. There will be a number of parallels with the effects on similar electrical supply networks.
1.2
Fundamental Information
The following information will provide the fundamental information required to understand the basics of this research project and set the scene for this document. Greater details will be provided in the next chapter of this document.
In this document the phrase “this research project” will be taken literally and so only refer to aspects of “The Effects of Small Distributed Generation on the Electrical Distribution Network”.
1.2.1
Electrical Supply Network Overview
The majority of the world’s electrical energy is produced by large generators that are owned and operated by specialist generation entities, both government and privately owned. The electrical energy is distributed and sold to customers using a large interconnected network of generators, transformers and power lines, which is usually known as the electricity supply network or electrical grid. In general the electrical energy flows radially away from the generators to the customers.
1. The value of the items of plant that constitute the electrical grid. 2. The cost of generation equipment and fuel sources.
3. The cost of supply failure due to lost revenue.
4. The losses associated with transmitting the energy to the customer.
As a result of the high costs the electrical grid is controlled and protected in a way that is intended to balance the optimisation of performance whilst minimise the costs. The control and protection systems are generally set up for power flowing from the generators towards the customers.
1.2.2
Electrical Supply Networks in Australia
The generation of electrical energy in Australia is essentially controlled by a regulation authority called The Australian Energy Market Commission (AEMC). The AEMC describes its formation and purpose as follows “The Council of Australian Governments (COAG), through the Ministerial Council on Energy (MCE) established the Australian Energy Market Commission (AEMC) in July 2005 to be the rule maker for national energy markets.” The AEMC goes on to be more specific as follows: “The Australian Energy Market Commission is the rule maker and developer for the nation's energy markets. As a national, independent body we make and amend the detailed rules for the National Electricity Market and elements of natural gas markets.” (AEMC Who we are web page, viewed 19th Sept 2010, < http://www.aemc.gov.au/About-Us/Who-we-are.html>)
The AEMC produces the National Electricity Rules that sets out the conditions for which the supply of electrical energy is achieved in the interconnected networks within Australia.
The Australian Energy Regulator (AER) is the authority that determines the factors affecting the transmission and distribution networks. “The AER regulates the wholesale electricity market and is responsible for the economic regulation of the electricity transmission and distribution networks in the national electricity market (NEM).” (AER About us web page, viewed online 19th Sept 2010, < http://www.aer.gov.au/content/index.phtml/tag/aerAboutUs/>)
1.2.3
Queensland Electrical Supply Network
The generation, distribution and supply of electrical energy in Queensland are controlled by the legislation, “Electricity Act 1994”. This act points to a number of other legislated documents, including the National Electricity Rules and a number of Australian Standards.
The Queensland electrical supply network consists of a number of large electrical generators, which are owned by private companies or government owned corporations. An interconnected network of lines and cables takes energy from the generators and supplies the customers.
1.2.4
Generation in Queensland
The electrical energy generators in Queensland are connected to Powerlink, Energex and Ergon Energy networks. They are all subjected to rigorous connection conditions that ensure that they do not negatively impact the supply network security and quality of supply.
The large generators are generally connected to the Powerlink Queensland network and range in size from a few MVA to over 1500 MVA. A large number of smaller generators are connected to the sub-transmission and distribution networks of both Energex and Ergon Energy.
1.2.5
Distributed Generation in Queensland
The electrical supply network in Queensland is extensive with over 13,000 km of transmission lines, 350,000 km of distribution lines and 65,000 transformers (Queensland Department of Employment, Economic Development and Education, Queensland electrical supply network statistics, viewed online on the 19th of September 2010, <http://www.dme.qld.gov.au/Energy/transmission_and_distribution.cfm>). There are over 50 individual generation sites within these networks. These generators are distributed through out the Queensland electrical supply network and so it could be said that they are all distributed generators, although most are not considered to be due to their large size.
Distributed generators are generally distinguished from other generators in two main aspects. Firstly their size is at the smaller end of the generation spectrum of sizes. Secondly they are usually powered by either renewable energy or energy that is a by product of another process (co-generation).
1.2.6
The Present State of Small DG Systems in Queensland
The Queensland Electricity Act 1994 sets down a set of definitions and conditions that allow for the connection of small DG systems to the electrical supply network (grid connection). These small DG systems do not require the rigorous compliance that larger generators must undergo in order to ensure network security and supply quality.
The Electricity Act 1994 (Qld) defines that which constitutes a Small DG System in Queensland as follows:
qualifying generator means a small photovoltaic generator that—
(a) is installed at the premises of a small customer in a way that allows electricity generated by the generator to be first used by the small customer and, if not used by the small customer, supplied to a supply network; and
(b) complies with any safety or technical requirements prescribed under a regulation.
The Queensland Electricity Act 1994 also defines the size of Small DG Systems in Queensland as follows:
small photovoltaic generator means a photovoltaic system with capacity up to
10 kilovolt amperes for a single phase connection and up to 30 kilovolt amperes for a 3 phase connection.
• Distribution Authority (Energex and Ergon Energy) must connect a qualifying generator to their network if it is technically and economically practical.
• Excess electrical energy may be exported to the electrical supply network and the distribution authority must pay the customer 44c per kWhr.
• This scheme must be reviewed by 2018 and expires in 2028.
• Must be reviewed if the total capacity of all the qualifying generators exceeds 8 MW.
1.2.7
Increasing Distributed Generation
A number of issues are increasing the attractiveness for the installation of DG systems, and these include:
1. The concerns over carbon dioxide (CO2) production as a result of electrical
energy generation using fossil fuels, which can be reduced by the installation of renewable energy sources to produce electricity.
2. The reducing costs of production for equipment that can convert energy sources into electrical energy that can be exported onto the electrical grid.
3. The increasing incentives provided by government entities for:
• Larger electrical energy producers to develop renewable and clean (low CO2 production compared to coal) energy DG systems;
• Electrical energy customers to install their own renewable energy small DG systems that can export excess energy onto the electrical grid and be paid for this excess energy at rates that are more than the cost of importing energy.
4. The increasing flexibility and encouragement by government entities for the installation of renewable and cleaner electrical energy production (for both the larger producers and electricity customers).
This research project will be concentrating on the effects of small DG systems, which are connected to the low voltage distribution network (in Queensland this means three phase 415V). The small DG systems in Queensland are presently almost exclusively supplied by solar energy. The numbers connected to the electrical grid (or penetration) is increasing at a steady rate that does not look like reducing any time soon.
1.2.8
The Future of Small DG Systems in Queensland
The Queensland Government Department of Employment, Economic Development and Innovation Office of Clean Energy are presently the organisation that advises the state government on policy and initiatives regarding renewable and clean energy. The following quote is taken from their web site home page and encapsulates the present thinking of future renewable and clean energy directions, “Global concerns over climate change and demand for cleaner, greener energy will be major drivers of strong growth in the clean energy sector in the years ahead” (Queensland Department of Employment, Economic Development and Education, Office of Clean Energy, web site home page, viewed online on the 25th of September 2010,
of this there will continue to be some encouragement of the establishment of small DG systems.
Small DG systems in Queensland are presently powered almost exclusively by renewable energy sources; however there are other avenues of use presently being developed. These avenues include the use of battery storage systems that integrate to the grid using an inverter that can both charge the batteries and export the battery energy to the grid. These systems are intended to assist electrical supply authorities with grid management. Hydrogen fuel-cell technology could employ grid connected inverters to interface the discharge of energy to the electrical supply network. The battery systems that power electric vehicles are mostly charged with on-board inverters and there is interest by electrical supply authorities to control and utilise the available storage capacity in the batteries for grid management also.
The increasing interest in small DG systems and other grid connect inverter applications such as battery storage, hydrogen fuel-cells and electric vehicles battery systems may see the continued penetration of these systems into the electrical supply network. It is likely that these penetration levels may approach saturation where every dwelling and commercial establishment could include one or more grid connect inverters connected to the electrical supply network.
1.2.9
Small DG Systems Defined
The great majority of small DG systems use either wind or solar as their energy source and in Queensland almost all systems use solar. Small DG Systems using solar energy almost exclusively use panels of Photovoltaic (PV) cells to convert the sun’s energy to electrical energy. The PV panels produce d.c. voltages up to about 48V each and a number of these panels are connected in series to form a PV array with outputs up to several hundred volts. The d.c. output of the PV array is fed into an inverter that converts the d.c. into a sinusoidal voltage of one or three phases and with an amplitude dependent on the application (in Queensland 240V single-phase and 415V three-phase). The inverters can supply local isolated loads, which sometimes integrate some form of battery storage. The alternate would be that they connect to the electrical supply network (the grid), mostly without any storage and this is presently the most common arrangement in Queensland (and for that matter globally).
In this research project the term “Small DG System” will be taken to mean a PV grid connected inverter system of less than 10 kW per phase.
1.2.10
Low and High Voltage Distribution
This research project is intended to investigate the effects that the increasing penetration of Small DG System may have on the lower levels of the electrical grid. The lowest level of the electrical grid is the Low Voltage (LV) Distribution where the nominal supply voltage in Queensland is 415V (three-phase). The next level is the High Voltage (HV) Distribution where the nominal voltages in Queensland range from 6.6kV to 33kV. The next level is the Sub-Transmission voltages, which in Queensland are 33kV, 66kV, 110kV and 132kV.
An individual HV Distribution network could be defined as a single 11kV distribution feeder which is the entire network downstream of a zone substation circuit breaker and could comprise several kilometres of HV lines supplying ten to twenty LV Distribution networks.
The Zone Substation is usually configured as one or two large transformers stepping down a sub-transmission voltage to the HV distribution voltage. The zone substation transformers in Queensland range in size from 1MVA to 63MVA. The transformer low voltage windings feed the various distribution feeders through an arrangement of circuit breakers.
1.2.11
Voltage Control
The HV distribution network is presently arranged with a number of distribution substations supplied by the HV lines and cables running radial away from the zone substation. These distribution substations incorporate fixed tap transformers, which are set to provide the appropriate voltage when the flow of electrical energy is away from the zone substation.
The voltage of the distribution feeders at the zone substation is generally controlled at somewhere from 101% to 103% of nominal voltage. This is achieved by automatically changing the winding ratio of the zone substation transformer incrementally to maintain these values regardless of load levels. The incremental changes of winding ratio range from 1% to 2.5% of the nominal ratio and these ratio changes can boost the output voltage by up to 20% and buck by up to 10%. The load supply is not broken by this process and the method is usually known as On Load Tap Changing (OLTC). The OLTC operation can be complicated but are essentially set up to operate when voltage deviates from the prescribed range by a set amount for a set time, for example if the voltage deviates outside the limits of 101% and 102.5% for more than 90 seconds. The majority of distribution feeders have only the voltage at their source (at the zone substations) regulated to a set value and rely on their construction and set up of the distribution substations to keep the customer voltage within an acceptable range. On some excessively loaded distribution feeder this arrangement does not deliver suitable voltages to the customer. These feeders require additional voltage support, which is generally provided by Voltage Regulators. A Voltage Regulator is a transformer with a winding ratio of nominally 100% and an OLTC with a tap range of up to 20% boost and 20% buck and tap step from 0.5% to 2%. The Voltage Regulator OLTC is controlled to maintain the output voltage in the same way as that done for Zone Substation transformers. These regulators can be operated to maintain the voltage on their downstream side regardless of the direction of power flow and so can be bi-directional.
1.2.12
Impacts of Small DG Systems
The typical domestic customer uses on average about 3.5kW with peaks of little more than 10kW. The inclusion of Small DG Systems will subtract from this load and export energy when exceeding the load. This means that the Small DG Systems will have some effect on the dynamics of the electrical grid. Whilst the numbers of Small DG Systems are small the effects will be negligible, however large numbers could potentially see the electrical grid operating in a manner for which is was not designed.
time away and issues will be investigated and strategies developed to cope with the problems as they become apparent.
At this point in time the penetration of Small DG Systems is low and so the impacts are presently negligible. The penetration level is however increasing and it is possible that in the near future the effects on the lower levels of the electrical grid will become noticeable.
1.2.13
Quality of Supply
It is generally expected that the supply of electrical energy to the consumer is of a reasonable quality or in other words the Quality of Supply (QoS) meets relevant standards. In the perspective of this research project, QoS is measured in two ways. They are:
1. The duration and frequency of power supply failure.
2. The size, duration and frequency of voltage fluctuations outside the limits considered reasonable.
1.2.14
Protection Systems
The electrical supply network protection systems are intended to interrupt supply to a section of network where there is a fault. A fault is defined as an abnormal system occurrence. In general protection systems operate during a fault to:
• Prevent damage to network equipment.
• Prevent the occurrence of a situation that is dangerous.
• Reduce the disturbance to other network customers (or increase QoS).
In general protection systems are intended to cover a specific section of network and usually not operate for faults outside of their intended network section (unless acting as a back up when the primary protection system fails). The methods and equipment used in protection systems vary widely and depend on the type of network being protected. This research project will be concentrating on the LV and HV Distribution network only and for this reason only the protection systems typically used on these network sections will be discussed.
LV Distribution almost exclusively employs fuses to protect this network type. HV Distribution use fuses also as well as circuit breakers controlled by some type of protection relay. Protections relays measure current or current and voltage and send a signal for the circuit breaker to operate when a predetermined fault condition is experienced.
1.3
Research Project Justification
It is anticipated that high penetration levels of Small DG Systems will at some level begin to negatively effect the operation of the LV Distribution portion of the electrical grid. As the penetration level increase further then it is possible that effects will become more widespread and will be noticed on the HV Distribution. The level of penetration where these issues become noticeable will depend on many variables, which will mostly relate to the network type.
1.3.1
Effects on the LV Distribution
One of the measures of Quality of Supply (QoS) of the electrical energy is the number and size of voltage fluctuations. The control of the present distribution network relies totally on power flows towards the customers. It is likely that the uncontrolled and variable nature of generation of power by the Small DG Systems away from the customers will cause voltage fluctuations on the LV Distribution grid that will be considered excessive and so the QoS will as a result be substandard.
It is also possible that during fault conditions the input from the Small DG Systems will negatively change the way that the protection systems deal with the disruption and removal of the faulted network.
1.3.2
Effects on the HV Distribution
It is probable that the effects seen on the LV Distribution network will be more pronounced than those on the HV network. Therefore it is likely that they will become noticeable on the HV Distribution at a higher level of penetration compared to the LV Distribution.
The problems seen on the HV Distribution network may also be similar in nature to those seen on the LV Distribution.
1.3.3
General Research Objectives
The most likely consequence of high levels of penetration of Small DG Systems will manifest in two specific ways that are:
1. Reduction of Quality of Supply to unacceptable standards.
2. Negatively affecting the operation of HV and LV Distribution network protection systems.
This research project will investigate how the increasing penetration of Small DG System will affect QoS and protection system operations.
1.4
Methodology
The following sections describe the methodology that will be used in the investigation that the effects of increasing penetration of Small DG Systems have on the HV and LV Distribution network.
1.4.1
Investigation Overview
Distribution feeders vary widely in their makeup within the electrical supply network. One end of the spectrum is represented by heavy commercial, which are short systems that supply a large load within the central business districts of large cities or single large commercial customer such as a shopping centre. The opposite extreme is an extremely long rural network that incorporates large Single Wire Earth Return (SWER) networks and supplies few widely spaced small loads.
It is unlikely that enough Small DG Systems can be installed within heavy commercial distribution feeders to negatively affect the network and so they will not be considered in this project.
where there is the possibility of high levels of Small DG Systems penetration. Information on these two feeders will be collected to develop models and data sets. Data will be collected on the behaviour of the Small DG Systems in various operational circumstances. Further data will also be assembled on electrical network equipment that may be used to mitigate the negative impacts of Small DG Systems.
The network models will incorporate various permutations of penetration levels of Small DG Systems and will be run to determine the effects of system faults and fluctuation in the output of the Small DG Systems. The models that demonstrate problems will be run with the additional equipment intended to correct the problems in order to investigate their effectiveness.
1.4.2
Distribution Feeder Types
The two distribution feeder types with the addition of Small DG Systems that will be investigated in this research project will be:
A. Major urban residential – regional city purely suburban with very little commercial or industrial customers. This feeder will be referred to as a residential feeder.
B. Principally SWER – very isolated long rural network with small loads representative of free range livestock farming. This feeder will known as a SWER feeder.
1.4.3
Expected Small DG System Dispersion
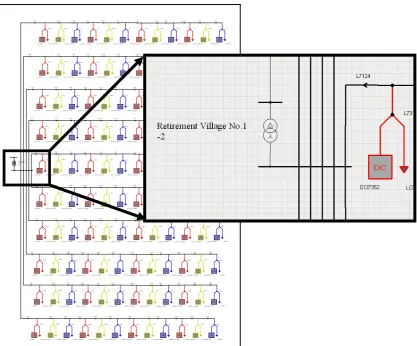
The initial uptake of Small DG Systems in Queensland was stimulated by federal and state government subsidisation. This subsidisation was means tested and was most attractive to residential customers. The net result is that at the moment the majority of Small DG Systems are installed in residential customer’s premises. As a result the dispersion of Small DG Systems within the community is reasonably random and evenly dispersed across residential customers. The exception to the even residential dispersion is seen in retirement villages where the density of dwellings is high and the uptake of Small DG Systems can be up to 100%. There are cases in Queensland where up to 300 installations are lumped in a 25ha community in the midst of residential feeder networks.
There have been instances where individual property owners have several connections to the grid and have installed Small DG Systems on each of their connection to SWER network. These are further examples of lumped installations and can be up to 10 in number on a SWER feeder.
The future growth and dispersion of Small DG Systems is difficult to predict at this point in time. It is not an entirely unreasonable possibility that the penetration levels could reach 100%.
1.4.4
Expected Small DG System Types
1.4.5
Network Model Permutations
The permutations of models that could be tested on the representative feeders are large in number. The possibilities range from 0 to 100% penetration with dispersions ranging from even to concentrated groups or lumped installation. It is likely that the lumped installations will initially only be seen in retirement villages and other medium density residential arrangements.
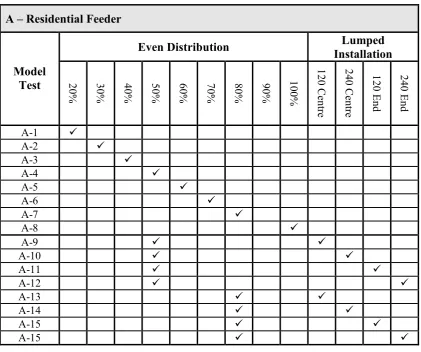
[image:31.595.108.530.375.727.2]In order to keep the number of differing network models to a reasonable quantity and to progress across a spectrum of penetration levels where problems may become obvious it will be necessary to use some judgement to select suitable penetration arrangements. This has been done by selecting appropriate incremental even distribution of Small DG Systems penetrations and also situations where a concentrated group of Small DG Systems are lumped onto a network section as well as combinations of both. The following tables show which permutations of these penetration levels will be developed into models and tested. Each model tested will be either even distribution or a combination of even distribution and lumped installations near the centre or end on the HV network; for example the Model Test A-9 would involve 50% even distribution as well as a lumped installation of 120 Small DG Systems at the centre of the residential feeder.
Table 1.1 – Models for Major urban residential Network A – Residential Feeder
Even Distribution Lumped
Installation Model
Test 20% 30% 40% 50% %06 70% 80% 90% 100
%
1
2
0
C
en
tr
e
2
4
0
C
en
tr
e
1
2
0
E
n
d
2
4
0
E
n
d
A-1
A-2
A-3
A-4
A-5
A-6
A-7
A-8
A-9
A-10
A-11
A-12
A-13
A-14
A-15
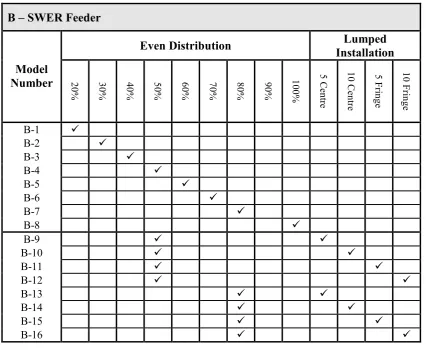
Table 1.2 – Models for Principally SWER Network B – SWER Feeder
Even Distribution Lumped
Installation Model
umber 20
%
3
0
%
4
0
%
5
0
%
6
0
%
7
0
%
8
0
%
9
0
%
1
0
0
%
5
C
en
tr
e
1
0
C
en
tr
e
5
F
rin
g
e
1
0
F
rin
g
e
B-1
B-2
B-3
B-4
B-5
B-6
B-7
B-8
B-9
B-10
B-11
B-12
B-13
B-14
B-15
B-16
1.4.6
Small DG System Weather Performance
The change in the output from Small DG Systems will vary from 0 to 100% depending on the time of day and weather conditions. The output values experienced during a sunny day are relatively easy to predict and apply as are those at night.
The output and behaviour of the Small DG Systems during the transition of clouds over head is less simple to predict. It is likely that there will be some change that can range from very little to up to 80% drop in output over a matter of seconds.
The inclusion of the dynamic cloud related performance in models of feeder networks that include Small DG Systems may highlight problems related to QoS. A comparison of Small DG System performance data, feeder load data and wind speed would be needed to determine the greatest step change of power in-feed into each feeder type.
1.4.7
Methodology to Investigate Protection Problem
The importance of a protection system operating is paramount and so they are designed to function when the network that they are protecting is operating in its most arduous state.
fault levels through the protective devices will be examined to see whether the device has operated correctly or not.
1.4.8
Methodology to Investigate QoS Problem
The investigation of the QoS issues will be split into two areas, which are:
1. The network voltage fluctuations caused by the steady state operation of the Small DG Systems.
2. The network voltage fluctuations as a result of cloud movement affecting the output of the Small DG Systems.
The HV Distribution network is presently arranged with a number of distribution substations supplied by the HV lines and cables running radial away from the zone substation. These distribution substations incorporate fixed tap transformers, which are set to provide the appropriate voltage when the flow of electrical energy is away from the zone substation. The inclusion of Small DG Systems will see this energy flow during sunny periods in a less radial manner than previously experienced. During low insolation periods the energy flows will be radial as before. This difference will see the voltages fluctuating depending on the amount of energy being fed in by the Small DG Systems and the feeder loads.
The feeder network models will again be used with differing penetration levels and location of Small DG Systems and load flows conducted to see how the system voltages are affected.
1.4.9
Corrective Network Devices
The investigation of the models of the representative group of distribution feeders with the various incremental penetration levels of Small DG Systems will produce data on the affects of these systems for both Protection Systems and QoS. This data will allow an analysis that will highlight a point where these problems begin. This further information can be used to expand the investigation to test the corrective effects of additional network devices and so generate a second data set.
1.5
Objectives
The key objectives of this research project are as follows:
1. Develop a data set of fault levels using network models of the two representative distribution feeders with various incremental penetration levels of Small DG Systems.
2. Develop a data set of voltage levels using network models of the representative distribution feeders with various incremental penetration levels of Small DG Systems.
3. Determine at what level of Small DG System penetration cause incorrect operation of protection systems for each representative distribution feeder. 4. Determine at what level of Small DG System penetration cause an unacceptable
QoS for each representative distribution feeder.
6. Develop secondary data sets of voltage levels using network models incorporating corrective devices.
1.6
Dissertation Outline
The following sections will give a brief description of the content of the subsequent chapters of this document.
1.6.1
Background Information
The section will contain the information relating to the two distribution feeders as well as related equipment, data and software used in this research project. These will include the following:
• Legislation, regulation and standards relevant to this research project.
• Distribution feeder protection systems overview.
• QoS overview.
• Voltage regulation.
• Distribution Feeder Related - The information regarding the two representative distribution feeders selected for this research project, which includes:
o Physical and electrical characteristics. o Customer numbers and types.
o Load profiles o Protection Systems. o Weather data.
• Small DG Systems Related – Such as types, sizes and performance characteristics of the equipment that comprises a Small DG System.
• Expected problems with high penetration of Small DG Systems on the distribution networks.
• Feeder Modelling – Describing the selection and choice of modelling tools and the various model permutations.
1.6.2
Literature Review
This chapter will include a brief examination of research papers on the following categories:
• The effects of steady state in-feed from high penetration levels of DG.
• The effects of transient in-feed (cloud induced) from high penetrations of DG.
• The effects on protection systems by high penetration levels of DG.
1.6.3
Test Data
An outcome from the literature review is that there was insufficient data available to develop aspects of this research project. A small number of experimental data sets were collected for this research project in order to effectively enable the modelling and analysis phase of this research project.
The experimental data sets include:
• Actual fault contributions data from a Small DG System
• Performance of a Small DG System as a result of cloud movement.
• Experimental performance of grid-connect inverters using laboratory power supplies.
1.6.4
Network System Modelling
This chapter describes the development of the network models of the two representative distribution feeders.
1.6.5
Network System Modelling
This chapter describes the outcomes produced from the fault modelling exercise of the two representative distribution feeders. The intention is to develop a data set that shows the fault levels at protective devices with and without the inclusion of Small DG Systems.
The chapter also provides an analysis of the fault modelling techniques in order to ascertain whether confidence can be had in the results.
1.6.6
Quality of Supply Modelling
This chapter describes the outcomes produced from the load flow modelling exercise of the two representative distribution feeders. The intention is to develop a data set that shows the voltage levels at the customers LV supply with and without the inclusion of Small DG Systems during both steady state and fluctuating in-feed.
The chapter also provides an analysis of the load flow modelling techniques in order to ascertain whether confidence can be had in the results.
1.6.7
Analysis of Protection Impacts
The data collected during the protection system modelling exercise will be analysed in order to develop a better understanding of the methods and problems associated with the existing power network modelling software.
1.6.8
Analysis of QoS Impacts
1.6.9
Conclusions
The section of the report will see the development of conclusions drawn from the analysis of the information and data collected. This will be followed by a summary of the negative issues discovered during this research project. A set of recommendations can be developed for use as a guide for electrical supply authorities in their handling of future high penetration levels of Small DG Systems. This recommendation may also be used to develop future policy in the connection of these systems.
CHAPTER 2 -
BACKGROUND INFORMATION
2.1
Outline of Background Information
The previous chapter provided a broad outline of information relevant to this research project and this chapter will present the specific information that will be considered in the development of this research project.
2.2
Legislation and Regulations
2.2.1
Queensland Electricity Act 1994
The overriding legislation that governs the production and supply of electricity in Queensland is called the Electricity Act 1994.
The key points to be taken from the Queensland Electricity Act 1994 that relate specifically to this research project include:
• A feed in tariff where grid-connected inverter systems can receive 44c per kWh of energy exported onto the electrical supply network.
• Only small grid-connected inverter systems powered by photovoltaic arrays with a capacity up to 10 kW per phase qualify for feed in tariffs.
• That supply authorities must agree to connect these Small DG Systems to their network so long as there are no technical or financial barriers.
The Queensland Electricity Act 1994 has an additional and subordinate legislation known as the Electricity Regulation 2006. The key points taken from this document that relate specifically to this research project include:
• The nominal supply frequency will be 50 Hz.
• The low voltage (LV) distribution is a three-phase and multiple earthed neutral system.
• The nominal distribution LV is 415 V RMS phase to phase and 240 V RMS phase to neutral.
• The distribution LV must be maintained at the customer’s terminals (point of connection) at 6% more or less than the nominal voltage.
• The distribution HV at 22 kV or less must be maintained at the customer’s terminals at 5% more or less than the nominal voltage.
• The distribution HV at more than 22 kV must be maintained at a voltage agreed between the electricity entity and the customer.
2.2.2
Australian Standards
The Small DG Systems considered in this report will be connected to the LV distribution networks in Queensland. The supply authorities who own and operate this network are principally Ergon Energy and Energex. These two authorities provide guidelines for the connection of Small DG Systems that say that they shall comply with the Australian Standards AS3000 and AS4777 (Ergon Energy web site, Renewable Energy System Connection information, viewed online on the 2nd of October 2010,
The Australian Standard AS3000 is titled the Wiring Rules and as its name suggests, covers information relating to wiring standards. This information is not used in this research project as it is assumed that the installation of the Small DG Systems is compliant with this standard.
The Australian Standard AS4777 is composed of three volumes and is titled “Grid connection of energy systems via inverters”. The first two AS4777.1 and AS4777.2 cover installation and inverter requirements respectively. The assumption will again be made that the inverters and their installations are compliant. The third volume AS4777.3 is of interest in this research project and covers the grid connection requirements.
2.2.3
AS4777.3 Clause 5.3
The first key area of AS4777.3 which is relevant to this research project is the clause 5.3, which describes the conditions by which the inverter must disconnect in order to prevent generation when the supply from the grid is lost (anti-islanding). The clause is as follows:
5.3 Voltage and frequency limits (passive anti-islanding protection)
The grid protection device shall incorporate passive anti-island protection in the form of under- and over-voltage and under- and over-frequency protection. If the voltage goes outside the range Vmin to Vmax or its frequency goes outside the range fmin to fmax, the disconnection device (see Clause 5.2) shall operate within 2 s, where—
(a) Vmin shall lie in the range 200-230 V for a single-phase system or 350-400 V for a three-phase system;
(b) Vmax shall lie in the range 230-270 V for a single-phase system or 400-470 V for a three-phase system;
(c) fmin shall lie in the range 45-50 Hz; and (d) fmax shall lie in the range 50-55 Hz.
The limits Vmax, Vmin, fmax and fmin may be either preset or programmable. The values Vmax, Vmin, fmax and fmin may be negotiated with the relevant electricity distributor. The settings of the grid protection device shall not exceed the capability of the inverter.
It can be seen that the operation voltages range from -16.7% to +12.5% of the nominal 240 V to neutral and this is well outside the legislated limits of ±6%. This means that the network voltages could extend to these limits set by the inverters.
The second key area of AS4777-3 is clause 5.5 as follows: 5.5 Active anti-islanding protection
It is possible that the passive anti-islanding would not operate if a number of inverters were in operation and the load was similar to their collective output. The active anti-islanding described would acts as a backup in the rare event that the passive functions do not operate.
The third key area of this standard describes the procedure of reconnection of the inverters at start up and after anti-islanding has been detected and they have automatically disconnected themselves. This feature is described under clause 5.6 and is as follows:
5.6 Reconnection procedure
Only after all the following conditions have been met shall the disconnection device operate to reconnect the inverter to the electricity distribution network– (a) the voltage of the electricity distribution network has been maintained within the range Vmin–Vmax for at least 1 minutes, where Vmin and Vmax are as defined in Clause 5.3; and
(b) the frequency of the electricity distribution network has been maintained within the r