College staff survey
2018
Technical report
November 2018
2
Contents
List of tables 4
1. Survey methodology 5
Methodology 5
Sample design 6
Soft launch sample 9
2. Questionnaire and survey design 11
Coverage of research questions 11
Questionnaire design 13
Cognitive testing 13
Soft launch 15
Usability testing 16
Changes to the questionnaires ahead of the main stage 16
3. Fieldwork management 18
Survey communications 18
Advance packs 19
Survey invites 20
Queries received from colleges 20
Differences in soft launch fieldwork approach 22
Telephone fieldwork 22
Reminder strategy 22
4. Response rate analysis 24
5. Weighting and analysis 25
Weighting the staff return data 25
Weighting the principals’ survey data 26
Weighting the teachers and leaders survey data 27
Teachers 27
Governors 27
Leaders (excluding governors) 28
Leaders overall 28
3
Data processing and coding 29
Cleaning and editing of data 29
Coding 29
SPSS and table outputs 30
Subgroup analysis 31
Statistical significance 32
Appendix A: Questionnaires 34
Appendix B: Advance correspondence 81
Appendix C: Reminders 91
4
List of tables
Table 1 College Staff Survey sample design 8
Table 2 College Staff Survey soft launch sample design 9
Table 3 Timetable of communications 18
Table 4 Summary of questionnaire topics: teachers and leaders 21
Table 5 Survey response rates 24
Table 6 Subgroup analysis for teachers and leaders 31
Table 7 Profile of population, unweighted and weighted sample from the Staff Return 99 Table 8 Profile of principal population, unweighted and weighted sample 101 Table 9 Profile of teacher population, unweighted and weighted sample 103 Table 10 Profile of governor population, unweighted and weighted sample 105 Table 11 Profile of leaders (excluding governors) population, unweighted and weighted
sample 107
5
1. Survey methodology
This technical report accompanies the College Staff Survey 2018 research report.1 Kantar Public working with RCU were commissioned to deliver the survey by the Department for Education in 2018, to improve the workforce data held by DfE on teachers and leaders in general and specialist Further Education (FE) colleges in England; provide insights into the experience, qualifications and expectations of FE teachers and leaders in general and specialist FE colleges; and provide insights into churn within the sector. The research was overseen by an advisory board, consisting of representatives from the sector.2
Methodology
The College Staff Survey 2018 comprised of three component surveys which were administered via general and specialist college principal’s offices:
• Principals survey: principals were asked to complete an online survey about their background and experience; perception of recruitment and retention in their
college(s); and demographic measures. Principals were given the option to complete the survey by telephone.
• Survey of teachers and leaders: teachers and leaders (including governors) in
colleges were invited to take part in an online survey via their principal’s office. The survey covered their background and experience in FE, teaching
qualifications held, a series of measures about their satisfaction working in FE, and a number of demographic measures.
• Staff return survey: colleges were sent a paper questionnaire which asked for administrative data on the number and type of staff employed at their institution. Colleges were offered the chance to complete the survey online.
The survey design and approach was chosen to reduce the burden placed on colleges in completing the survey and practically, how best to distribute the surveys to in-scope staff and colleges.
Section 1.2 discusses the sampling process in more depth. An attempted census
approach was agreed, including all in-scope colleges, and teaching and leadership staff. The Department held contact details for college principals so distributing the principal
1https://assets.publishing.service.gov.uk/government/uploads/system/uploads/attachment_data/file/757381 /College_Staff_Survey_main_report.pdf
6
and staff return surveys held no practical barriers. It was decided to offer principals the opportunity to complete the principals survey online initially, which allowed them to complete it at a convenient time and across multiple sittings if required. Kantar Public also offered principals the chance to complete by telephone, if this was more convenient. The staff return survey was originally designed as an online survey which principals could send to staff in their organisation to complete. This was the college’s HR
department in most cases. However, during cognitive testing for the surveys, HR staff said they preferred the paper version as it allowed them to write notes and provide clarifications for the research team at Kantar Public and for their own benefit. A paper copy also made it easier to see what they needed to collect in advance of completing the return. As a result of this feedback, a paper staff return questionnaire was sent to all in-scope colleges with the advance packs. An online version was also made available to colleges.
College principals were asked to distribute the teachers and leaders survey directly to their teaching and leadership staff as the only way to directly survey all in-scope staff. An online survey was the easiest way to distribute the survey, particularly given the volume of responses required. Cognitive testing confirmed that colleges had existing email distribution lists to support this approach, which included governors, other leadership staff and in-scope teaching staff.
The Department for Education sent survey invitation emails to college principals. The main body of the email explained the purpose of the research and included a unique survey link to the principal’s survey. There was a separate outlook attachment to the survey invitation which principals were asked to forward to in-scope teaching and leadership staff using existing email distribution lists.3 The email attachment was pre-populated (although principals could tailor the text) and contained a survey link to the teachers and leaders survey, which was unique to the college.
This approach minimised the burden on principals and staff to participate in the research. It avoided colleges collating information in advance or having to go through an onerous sampling exercise to randomly select staff to take part. Other methods would also have prevented some staff taking part, which went against the survey objectives.
Sample design
Kantar Public agreed with DfE that the research should take an attempted census
approach of General Further Education and specialist colleges. The Department supplied
7
a database of all in-scope colleges. This database included college name and, name and contact details for the college principal / CEO.4 Kantar Public conducted a cleaning exercise to ensure all details were accurate and appended a secondary telephone number (where possible) from the ‘Get Information about Schools’ database.5 RCU provided a database with college contact details for Kantar Public to cross reference contact details and append any further relevant information to the sample file. The college’s income band (from 2015/16); Ofsted grade; last Ofsted inspection date; whether the college was part of a college group; had gone through a merger; or were a land-based college were all appended to the sample file from RCU’s database. Kantar Public derived the colleges’ Index of Multiple Deprivation decile (IMD) and Government Office Region (GOR), and added these to the sample file.
Kantar Public checked for any upcoming or recent college mergers, to ensure the sample reflected the college landscape at the time of research. There were a number of college mergers in the two years leading up to the research, partly as a result of the area review plan.6 Six mergers occurred between January and April 2018 which overlapped with the survey soft launch and main stage.7
It was agreed that college groups should administer one set of surveys across the group. 8 This was agreed following initial calls with college groups, suggesting that college groups have a single central HR and leadership team covering all colleges within the group. Further, all staff tend to be employees of the group rather than employees of the individual colleges. In practise this meant only one staff return and one principal survey was sent per group. The exception to this was the Newcastle College Group (NCG), which is made up of five in-scope colleges which are geographically dispersed and managed as separate entities within the group.9 Therefore the individual colleges within NCG were surveyed where individual colleges held their own HR data and had their own college principals.
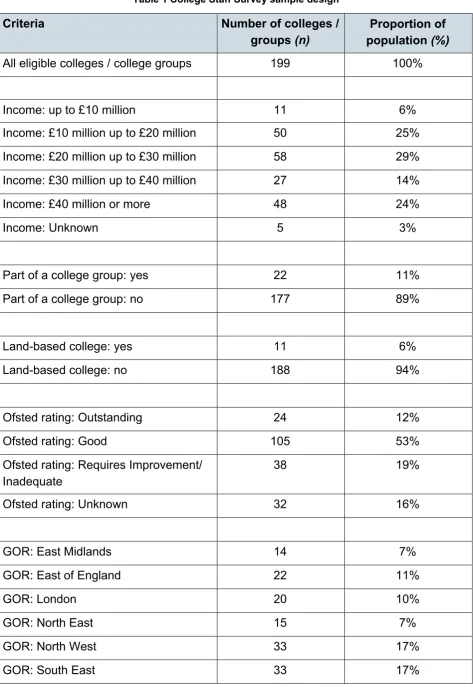
All eligible General Further Education and specialist colleges at the time of the research were invited to take part in the research, which comprised of 199 college and college groups. Sixth form colleges were not in scope for the research this year. Table 1 below shows a breakdown of all eligible colleges by key sample criteria.
4 Contact details included: college address, telephone number, email address.
5 This is a new service which has replaced Edubase - https://get-information-schools.service.gov.uk/ 6 https://www.gov.uk/government/collections/further-education-area-reviews-guidance-for-providers 7 https://www.aoc.co.uk/about-colleges/college-mergers
8 College groups were identified in the file RCU provided and represented groups made up of more than one college.
8
Table 1 College Staff Survey sample design
Criteria Number of colleges /
groups (n) population Proportion of (%)
All eligible colleges / college groups 199 100%
Income: up to £10 million 11 6%
Income: £10 million up to £20 million 50 25%
Income: £20 million up to £30 million 58 29%
Income: £30 million up to £40 million 27 14%
Income: £40 million or more 48 24%
Income: Unknown 5 3%
Part of a college group: yes 22 11%
Part of a college group: no 177 89%
Land-based college: yes 11 6%
Land-based college: no 188 94%
Ofsted rating: Outstanding 24 12%
Ofsted rating: Good 105 53%
Ofsted rating: Requires Improvement/
Inadequate 38 19%
Ofsted rating: Unknown 32 16%
GOR: East Midlands 14 7%
GOR: East of England 22 11%
GOR: London 20 10%
GOR: North East 15 7%
GOR: North West 33 17%
9
Criteria Number of colleges /
groups (n) population Proportion of (%)
GOR: South West 21 11%
GOR: West Midlands 22 11%
GOR: Yorkshire and the Humber 19 10%
Soft launch sample
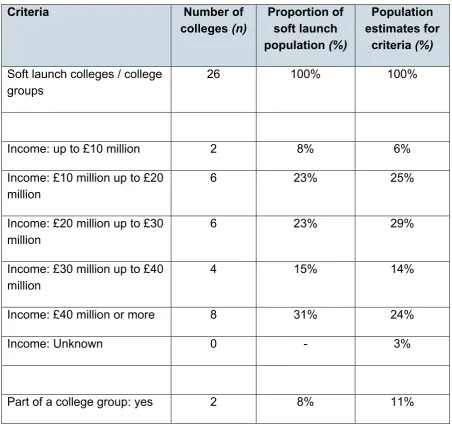
[image:9.595.66.519.325.754.2]Kantar Public conducted a soft launch of the research on 19th February 2018. A random representative selection of 26 colleges and college groups was agreed with DfE to form the soft launch sample. Table 2 below shows the composition of the soft launch sample.
Table 2 College Staff Survey soft launch sample design
Criteria Number of
colleges (n) Proportion of soft launch population (%)
Population estimates for
criteria (%)
Soft launch colleges / college
groups 26 100% 100%
Income: up to £10 million 2 8% 6%
Income: £10 million up to £20
million 6 23% 25%
Income: £20 million up to £30
million 6 23% 29%
Income: £30 million up to £40
million 4 15% 14%
Income: £40 million or more 8 31% 24%
Income: Unknown 0 - 3%
10
Criteria Number of
colleges (n) Proportion of soft launch population (%)
Population estimates for
criteria (%)
Part of a college group: yes 24 92% 89%
Land-based college: yes 2 8% 6%
Land-based college: no 24 92% 94%
Ofsted rating: Outstanding 3 12% 12%
Ofsted rating: Good 12 46% 53%
Ofsted rating: Requires
Improvement/ Inadequate 5 19% 19%
Ofsted rating: Unknown 6 23% 16%
GOR: East Midlands 4 15% 7%
GOR: East of England 3 12% 11%
GOR: London 1 4% 10%
GOR: North East 3 12% 7%
GOR: North West 3 12% 17%
GOR: South East 4 15% 17%
GOR: South West 4 15% 11%
GOR: West Midlands 1 4% 11%
GOR: Yorkshire and the
11
2. Questionnaire and survey design
Kantar Public and RCU undertook an extended survey development phase to ensure the approach and content of the surveys met the survey objectives. The development
comprised a round of cognitive testing; a soft launch of the surveys; and usability testing.
Coverage of research questions
The research was designed to add to existing data held on the teaching and leadership workforce, including the Staff Individualised Record (SIR) data,10 the Training Needs Analysis survey,11 and the College Workforce Survey.12 The research was designed to provide insights into the experience, qualifications and perceptions held by teachers and leaders in general and specialist FE colleges. The three surveys were designed to support this overall research objective. More specifically, the surveys were designed to support the following research objectives:
1. Provide data on the composition and background of the FE profession including how it differs across key sub-groups. In particular, what the leadership population looks like and how the deployment of the FE teaching profession, including leadership staff may affect the success of an institution.
Kantar designed the staff return to create estimates of the size of the workforce in general and specialist FE colleges. The staff return included metrics to build how many leadership, teaching and agency staff were in college at time of the survey; numbers of staff by contract type; numbers of staff by subject(s) taught; and number of vacancies held at time of survey.
The teachers and leaders survey collected demographic measures, including age, gender, ethnicity, nationality and disability. The teachers and leaders, and principals’ surveys also collected staff’s background including experience outside of education, length of time working in FE, length of time working in industry, and length of time at college.
2. How teachers and leaders are supported by their organisations in terms of professional development. What works well, where are the gaps?
10Education and Training Foundation’s Staff Individualised Record (SIR) data. SIR provides robust estimates for workforce demographics, staffing numbers and pay across all FE and training.
11 Training needs analysis survey https://www.et-foundation.co.uk/research/training-needs-analysis/
12AoC college workforce survey
12
This objective was not pursued, as this was covered by research on the training needs of the sector carried out by the Education and Training Foundation (ETF) in 2017.13 The teachers and leaders survey did ask how satisfied staff were with the opportunities they had to develop their career in FE.
3. The strengths and weakness of the profession.
Teachers and leaders were asked what they felt were the best and most difficult parts of working in FE. Principals were asked about the ease of recruitment and any recruitment challenges, as well as number of vacancies the college had for each subject.
4. The qualifications and skills of teachers and leaders- from industry and teaching perspectives.
The teachers and leaders survey collected what teaching qualifications and status teaching staff held and whether teaching and leadership staff had ever or currently worked in industry. Teaching staff were particularly asked about experience in industry which related to subject(s) they taught. Teachers were also asked what level they felt they were qualified to teach to.
5. Churn within the sector, identifying any demographic pressures including how teachers and leaders move into/around/out of the sector and why.
The staff return questionnaire collected the number of vacancies at the time of the survey and how many supply staff had been employed by the college to fill vacancies over the past year. Principals were asked how easy or difficult they felt recruitment of teaching staff was in college; which subjects were most difficult to recruit in; and a series of statements to measure how they felt recruitment had changed over the last three years. Principals were also given the opportunity to openly feedback on recruitment and
retention challenges their college faced.
The teachers and leaders survey asked staff how likely they were to leave the FE sector in the next twelve months. Those who said they already had a job outside FE or were likely to leave were asked why this was the case at the main stage.
There will be a follow-up survey of teachers and leaders in 2019 which will ask staff whether they have moved role in college or left FE, and if so explore why. This will add further evidence to this objective.
13
Questionnaire design
The Department provided an outline of key question areas to be covered at the outset of the project. Kantar Public used this as the basis of questionnaire design and drew on existing questions as far as possible during the initial questionnaire design. The research team conducted a desk review of relevant questions from: the training needs analysis survey;14 childcare and early years survey;15 Longitudinal Study of Young People in England;16 evaluation of the Further Education and skills plan;17 and the Teacher’s workforce survey.18 There were two rounds of questionnaire design between Kantar Public and DfE to agree the survey content for cognitive testing. RCU and the advisory board consisting of representatives from the sector also reviewed the questionnaires and provided feedback.
Cognitive testing
Kantar Public conducted cognitive testing with four colleges between December 2017 and January 2018. The four colleges were selected to provide a range by size (college turnover); geographic location; and the mix of provision offered. The aims of cognitive testing were to:
• Test the questionnaire content for the three surveys
• Understand how Kantar could bests deliver the research to colleges to avoid undue burden on staff within institutions
• How to deliver the research to ensure the best response rates possible The cognitive testing visits covered three key areas:
• A discussion with the principal and other members of the senior management
team to discuss what challenges they felt the colleges faced, particularly any challenges around the introduction of T Levels, and recruitment and retention.
• A discussion with principals and a member of HR about the technical set-up in colleges which was required to deliver the surveys (particularly email distribution
14 https://www.et-foundation.co.uk/research/training-needs-analysis/
15 https://www.gov.uk/government/statistics/childcare-and-early-years-providers-survey-2016
16 https://www.gov.uk/government/publications/longitudinal-study-of-young-people-in-england-cohort-2-wave-2
17
https://assets.publishing.service.gov.uk/government/uploads/system/uploads/attachment_data/file/248709/ bis-13-1234-evaluation-of-new-challenges-new-chances-further-education-and-skills-reform-plan.pdf 18
14
lists) and feedback on the content of the staff return questionnaire. In particular, whether the data in the staff return was available from existing HR reports.
• Full cognitive testing of the teachers and leaders survey to check the
questionnaire content and overall flow of the questions.
Cognitive interviews showed the questionnaire content worked well for the staff return and teacher and leader surveys, and the survey design was able to be delivered in
colleges. The survey of teachers and leaders was around the 10 minutes proposed so no substantial changes were recommended. The topics covered in the principals’ interview were relevant and the questions in the staff return were clear. No substantial changes to questionnaire content were recommended before the soft launch.
Some key findings from the cognitive testing visits were:
• All colleges confirmed they had the necessary email distribution lists to target in-scope teaching and leadership staff, including supply staff and governors. Colleges did note that supply staff (employed by agencies) might be difficult to reach where they were only in the college for a short period, as they would not be set up on the college’s systems.
• There were a range of mixed responses relating to how to achieve a higher
response rate within colleges. Some college representatives felt it would be more effective for the invitation to come from the principal’s office whilst other colleges representatives felt the survey would get more attention if issued via department or curriculum heads. Advance communication was adjusted to emphasise that colleges could distribute the survey to teachers and leaders in the way they felt most suitable.
• Views on how the staff return was to be completed varied. Estimates of the time needed to complete varied from between an hour and up to half a day. The questions in the staff return asking for the number of teaching staff per subject were identified as the most challenging during cognitive testing. Colleges felt other measures including the number of staff employed overall and the number of staff by contract type (permanent/fixed term/zero, minimal or flexible hours, and full-time / part-full-time / sessional or flexible hours) were easy to report.
15
• It was agreed with DfE that vocational subjects taught would be mapped to the new T Level routes,19 as this would be a key area for analysis. Example subjects were added to the vocational groupings to make it easier for staff to respond.
• Most staff were happy to answer potentially sensitive questions, such as
nationality, ethnicity and salary.
• There was some confusion in how to record which subjects staff taught within the
teachers and leaders survey. Changes were made for the main stage and the questions on subjects taught were separated into three questions: one asked for vocational subject(s) taught; one asked whether they taught ‘other provision’;20 and finally one asked about academic subject(s) taught. The instructions were made clearer to emphasise that the first question focused on vocational provision and separate questions asked for academic or ‘other’ provision.
• At least one college had completed the staff return with a mix of head count and
FTE during cognitive testing. It was clarified in the instructions for the main stage that head count only was required.
Soft launch
Kantar Public conducted a soft launch of the research from 19th February 2018. Table 2 in Chapter 1 outlined the composition of the 26 colleges and college groups selected for the soft launch. The sample was representative of a range of colleges based on size (by turnover), region, and Ofsted rating. Fieldwork management for the soft launch is
described in section 3 but broadly the soft launch replicated the planned approach and timings for the main stage.
The aims of the soft launch were to:
• Accurately measure the likely main stage response rates (for each element of the survey)
• Provide a comprehensive test of the survey content ahead of main stage • Further test for challenges with survey administration (which had not been
detected during the smaller scale cognitive testing exercise)
19 T-Level routes can be found
https://assets.publishing.service.gov.uk/government/uploads/system/uploads/attachment_data/file/650969/ T_level_Action_Plan.pdf
16
The questions were largely clear, unambiguous and framed in a language which was appropriate for the sector. Most teachers and leaders who started the online survey completed the whole questionnaire, with low levels of drop out. There were low levels of non-response (those selecting ‘Prefer not to say’) on potentially sensitive questions such as nationality, ethnicity and their income from the college.
Colleges understood and followed the instructions sent on how to administer the three surveys. No negative feedback was received based on the survey content or difficulty accessing the survey.
Usability testing
In parallel with the soft launch, RCU conducted a final round of usability testing in four colleges with teaching and leadership staff. The visits focused on how teachers and leaders experienced the online teachers and leaders survey and how accessible the online interface was. Feedback on the survey content was received from staff whilst conducting these tests, which was incorporated for the main stage. This included
providing more opportunity for teachers to record reasons for their answers to questions such as whether they are likely to stay working in the sector. Staff felt this was only a partial answer and believed the data would be richer if they could give the reasons why (particularly those who were likely to leave).
Usability testing showed that the online survey was easy to complete and there were no technical barriers. No issues were found with the layout or set-up of the online survey which might have caused respondents to drop out of the survey.
Changes to the questionnaires ahead of the main stage
The following changes were made to the questionnaires between cognitive testing and the main stage.
• It was decided to send the staff return questionnaire as a paper
questionnaire in the first instance and offer the online version if colleges preferred. It was felt that the paper questionnaire was easier for colleges to complete and allowed them to leave any queries or clarifications for the Kantar research team.
• It was agreed that the staff return would collect headcounts of staff rather
17
• Questions asking which subjects teachers taught were divided into three
categories. Cognitive testing showed there was some confusion in how to record which subjects staff taught within the teachers and leaders survey. Changes were made for the main stage and the questions on subjects taught were separated into three questions: one asked for vocational subject(s) taught; one asked whether they taught ‘other provision’;21 and finally one asked about academic subject(s) taught. The instructions were made clearer to emphasise that the first question focused on vocational provision and separate questions asked for academic or ‘other’ provision.
• Subjects were added to the ‘other provision’ category. The soft launch
showed there were some subjects within ‘other provision’ which needed to be added to the questionnaire. These included SEN provision; life skills; and
preparation for work. These subjects were added to both the teachers and leaders survey, and the staff return.
• Stand-alone and embedded literacy and numeracy teaching were included
as separate items. Usability testing findings showed that it would be useful to separate standalone literacy and numeracy teaching, and literacy / numeracy teaching delivered within other provision. The teachers and leaders questionnaire was updated for the main stage to account for this.
• Questionnaires were updated to allow staff to enter multiple roles rather
than just one main role. A key finding from both cognitive and usability testing was that some staff had multiple roles within college. The teachers and leaders survey was updated for the main stage to allow staff to enter multiple responses, with a follow-up question where they could enter what they considered to be their main role.
• Question wording was updated to ask why staff were (considering) leaving
FE. Staff welcomed the opportunity to say how likely they were to leave the sector but wanted to say why, if they were likely to leave. The teachers and leaders questionnaire was updated to tailor question wording to ask why staff were leaving (or considering leaving) FE. Those who were not considering leaving were asked about the main difficulties of working in FE.
Final versions of the questionnaires used at the main stage can be found in Appendix A.
18
3. Fieldwork management
This chapter outlines the procedures used during the survey fieldwork. All fieldwork documents are included in Appendix B and C. Soft launch fieldwork started in February 2018. The main stage fieldwork started in mid-April 2018 and ran for eight weeks. Both stages were closed in June 2018.
Survey communications
In advance of main stage fieldwork, all in-scope colleges were sent an email from the Department of Education containing a ministerial letter, co-signed by the FE
Commissioner. The ministerial letter was addressed to the principal of each college and explained the purpose and importance of the research. It also provided the option for principals to speak to the project manager at the Department of Education about the research if they wished to do so.
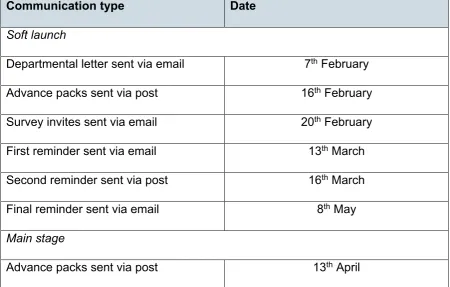
[image:18.595.67.518.463.750.2]Advance packs were posted to colleges two days before the scheduled survey email invites. Each pack contained an advance letter, explaining the research and providing the option to get in touch for more information, a paper copy of the staff return questionnaire, and other supporting documents (these are covered in more detail later in this section). The main survey email invites were distributed to the principal’s offices in all in-scope college in mid-April.
Table 3 Timetable of communications
Communication type Date
Soft launch
Departmental letter sent via email 7th February Advance packs sent via post 16th February Survey invites sent via email 20th February First reminder sent via email 13th March
Second reminder sent via post 16th March
Final reminder sent via email 8th May
Main stage
19
Communication type Date
Ministerial letter sent via email 16th April Survey invites sent via email 17th April
First reminders sent via email 10th May
Targeted telephone reminders w/c 14th May
Second reminder sent via email 21st May
FE commissioner reminder sent via
email 4
th June
Final reminder sent via email 4th June
A small number of principal’s contact details were updated following feedback after the ministerial letter had been sent. This included cases where the principal had recently been replaced and details of the new or interim principals were provided. In these cases, the sample frame was updated and the emails resent to the new principal. Overall, there were six colleges where updated details of college principals were recorded and resent.
Advance packs
Advance packs were posted to all in-scope colleges, addressed to the principal’s office. Each pack contained the following, all of which are included in Appendix B:
• An advance letter, explaining the purpose of the research, importance and design of the research, and providing contact details for the research team and Kantar Public should the college wish to raise queries or opt out of the research
• A paper copy of the staff return questionnaire
• A staff return guidance sheet, which mapped example subjects to the vocational and technical areas contained within the staff return
questionnaire
• A pre-paid envelope, for returning the completed staff return questionnaire
20
Survey invites
All invitations to take part in the research were emailed to college principals and/or chief executive officers. The email contained a unique link to the principals’ survey for
principals to complete. There was a separate outlook attachment to the survey invitation which principals were asked to send out to all in-scope teaching and leadership staff using existing email distribution lists. The email attachment was pre-populated with text inviting teachers and leaders to participate (although principals could tailor the text) and contained a survey link to the teachers and leaders survey, which was unique to the college.
Email invites also contained a survey ‘flyer’ which colleges could use to promote the research internally. Finally, a set of summary instructions was included, summarising how the three surveys should be administered.
Queries received from colleges
Throughout the fieldwork period there were a number of queries from colleges regarding the research. The most common queries, and answers are included below:
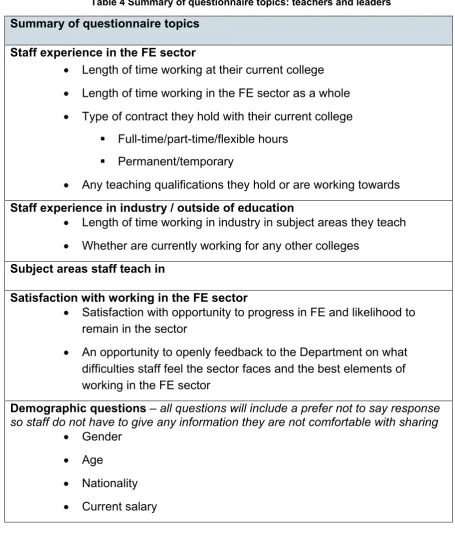
• The content of the teachers and leaders survey – Kantar Public and DfE produced a summary of the topics covered within the teachers and leaders survey, shown in Table 4, this was sent to colleges who asked for
clarification.
• The end date of the survey – Kantar Public advised colleges to complete all of the survey aspects by the end of May but encouraged colleges to distribute the teachers and leaders survey as soon as possible, to allow the maximum amount of time to take part.
• Resending the advance pack – Kantar Public resent the advance pack to approximately five colleges due to misplaced packs, or asking it to be resent to a named person within the HR department
• Out of scope staff – Kantar Public responded by letting colleges and staff know that the current research is only aimed at teachers and leaders, however appreciate that all staff within colleges are vital to the organisation and if this survey is successful, DfE plan to extend the programme of surveys, expanding the coverage to more providers and the wider workforce.
21
[image:21.595.63.519.164.700.2]Addition of final screen – one college contacted Kantar Public to request an additional screen to be added on the teacher and leader survey, to let staff know that this was the last chance to go back and review their responses, which was added to the survey.
Table 4 Summary of questionnaire topics: teachers and leaders Summary of questionnaire topics
Staff experience in the FE sector
• Length of time working at their current college • Length of time working in the FE sector as a whole • Type of contract they hold with their current college
Full-time/part-time/flexible hours Permanent/temporary
• Any teaching qualifications they hold or are working towards Staff experience in industry / outside of education
• Length of time working in industry in subject areas they teach • Whether are currently working for any other colleges
Subject areas staff teach in
Satisfaction with working in the FE sector
• Satisfaction with opportunity to progress in FE and likelihood to remain in the sector
• An opportunity to openly feedback to the Department on what difficulties staff feel the sector faces and the best elements of working in the FE sector
Demographic questions – all questions will include a prefer not to say response so staff do not have to give any information they are not comfortable with sharing
• Gender • Age
22
Differences in soft launch fieldwork approach
The soft launch fieldwork approach mirrored the main stage as far as possible. However, there were a number of small differences in the communications. In advance of the soft launch, principals were sent a departmental letter (from DfE) rather than a ministerial letter. The advance pack that was mailed out also contained several A3 copies of posters designed to promote the survey. Feedback from the soft launch suggested that as the survey was only aimed at teaching and leadership staff, it would be best to distribute the flyer via an email from the principal’s office to allow them to direct it at the appropriate staff for the mainstage.
Telephone fieldwork
All non-responding principals were offered the opportunity to take part in the principal survey over the telephone for both the soft launch and main stage. Telephone fieldwork began four weeks after the online survey had been emailed to principals and all
interviewers were briefed by the Kantar Public research team. During the soft launch, telephone fieldwork ran from 22nd March until 29th March. During the main stage, telephone fieldwork ran from 21st May until 8th June. The online survey remained open throughout this period if principals preferred to complete this way. Principals could arrange appointments if they were too busy to complete at time of contact.
In total there were 26 principals who completed the survey over the telephone.
Reminder strategy
Throughout the fieldwork, reminders were sent to colleges who had not completed all three elements of the research.
• Email reminders – different text was used based on how each college had responded to the survey when the reminders were sent out, on 10th May. Full reminders, were sent to colleges where no survey element had been completed. Minimal reminders were sent to colleges where the principal and staff return questionnaire had been completed. There was also a separate reminder for colleges where a principal interview had been received but no teacher and leader interviews and no staff return. All the reminders encouraged staff participation, and can be viewed in full in Appendix C. The second email reminder was sent out on 21st May.
23
• Telephone reminders – during the week commencing 14th May, colleges who had not yet taken part in the research or those who had a low number of teacher and leader interviews were called by the Kantar Public research team. Colleges had the chance to ask any questions they had about the research and were reminded of the three survey components and how to complete these. From the 22nd May, the Department for Education called colleges who had yet to return their staff return questionnaire. The purpose of this was to emphasise the importance of the staff return in being able to send the college benchmarked data.
• Postal reminders – A letter and a new copy of the staff return
24
4. Response rate analysis
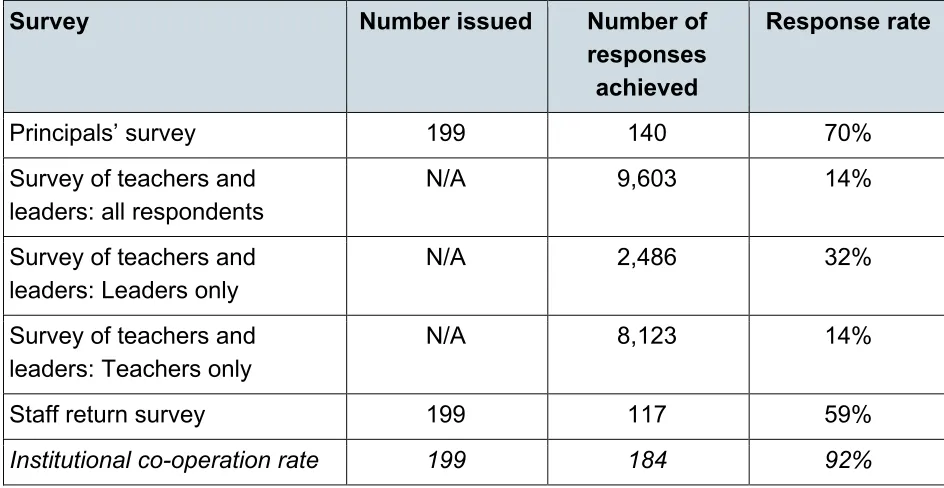
In total, 199 colleges or college groups were invited to participate in the College Staff Survey. Overall, 184 (92%) participated in at least one of the three elements, described as the institutional co-operation rate in Table 5. As discussed in Section 1, each college was sent one staff return survey and one principal survey. A response rate of 58% was achieved for the staff return survey, and a response rate of 70% was achieved for the principals’ survey.
[image:24.595.66.538.327.571.2]As the survey of teachers and leaders was distributed through the principal’s office to an unknown number of staff, population estimates from the staff return data were used to estimate the total population of teachers and leaders and subsequently to calculate the response rate for these elements.
Table 5 Survey response rates
Survey Number issued Number of
responses achieved
Response rate
Principals’ survey 199 140 70%
Survey of teachers and
leaders: all respondents N/A 9,603 14%
Survey of teachers and
leaders: Leaders only N/A 2,486 32%
Survey of teachers and
leaders: Teachers only N/A 8,123 14%
Staff return survey 199 117 59%
25
5. Weighting and analysis
This section outlines the processes used to produce the final data outputs from each survey, covering weighting the data, cleaning the data and the coding of open-ended questions.
Weighting was applied to ensure the final interviewed samples from all three surveys were as representative as possible of the FE sector. The final weights for each survey were calculated as the product of the design weight and the non-response weight
(described below for each survey). The precision of survey estimates is primarily related to the achieved sample size, but can also be affected by aspects of the study design. For this study, the precision of estimates is affected by the weighting which was required to compensate for systematic non-response. The loss of precision can be summarised by various measures, such as the effective sample size and the design effect.
• The effective sample size is an estimate of the sample size that a survey conducted using simple random sampling would have required to achieve the same sampling error as computed for this study.
• The design effect is the ratio of the unweighted sample size to the effective sample size.
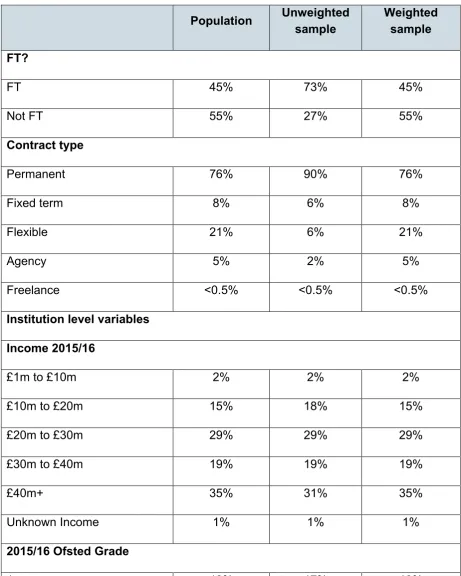
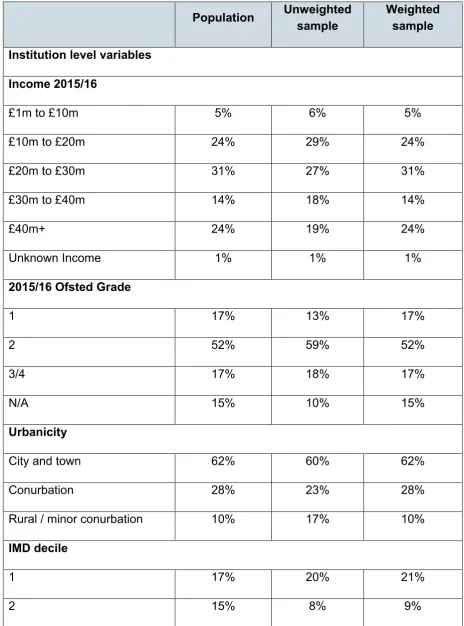
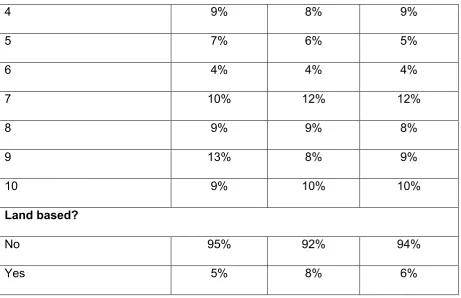
The profile of the population, along with weighted and unweighted counts for all surveys can be found in Appendix D.
Weighting the staff return data
Weights were required to compensate for non-response at the institution level. Each institution’s probability of response was estimated by means of a logistic regression model with known characteristics (sourced from ‘Get Information About Schools’ and the ESFA financial benchmarking tool) as predictor variables.
Multiple combinations of variables were tested to achieve a good fit to the survey data without an excess of predictor variables. The variables which tested in the non-response model are listed below:
• IMD decile
• Region
• ONS rural / urban
• Group / not a group
• Land based
• 2015/16 income (6 bands)
26
• ONS rural / urban
• Group / not a group
• Land based
• 2015/16 income (6 bands)
The final non-response weight was calculated by inverting the response probability of each respondent.
The design effect resulting from the non-response weighting was 1.0822, meaning that the overall effective sample size is estimated as c.107. To calculate accurate effective sample sizes and margins of error for survey estimates the complex samples package of SPSS (or the survey package of Stata or R) should be used.
Weighting the principals’ survey data
Weights were required to compensate for non-response at the institution level. Each respondent’s probability of response was estimated by means of a logistic regression model with known characteristics (sourced from ‘Get Information About Schools’ and the ESFA financial benchmarking tool) as predictor variables.
Multiple combinations of variables were tested to achieve a good fit to the survey data without an excess of predictor variables. The variables which tested in the non-response model:
• IMD decile • Region
• ONS rural / urban • Group / not a group • Land based
• 2015/16 income (6 bands)
• 2015/16 Ofsted grade (for new groups this was coded as N/A)
The final non-response model used the following predictors:
• Region • Land based
The final non-response weight was calculated by inverting the response probability of each respondent.
27
The design effect resulting from the non-response weighting is 1.03 (Kish estimator), meaning that the overall effective sample size is estimated as c.135. To calculate accurate effective sample sizes and margins of error for survey estimates the complex samples package of SPSS (or the survey package of Stata or R) should be used.
Weighting the teachers and leaders survey data
A number of different weights were calculated in order to account different types of staff.
Teachers
Weights were required to compensate for differential non-response. Estimates of the population size and profile were obtained from the weighted staff return survey. Response probabilities were then estimated by comparing the sample profile with the estimated population profile (from the weighted staff return data). Calibration weights were produced to ensure the sample matched the population estimates at the margins. The design effect resulting from the non-response weighting is 1.70 (Kish estimator), meaning that the overall effective sample size is estimated as c.4,787.23 To calculate accurate effective sample sizes and margins of error for survey estimates the complex samples package of SPSS (or the survey package of Stata or R) should be used taking into account the non-response weighting and the clustered nature of the data collection.
Governors
Weights were required to compensate for differential non-response. Estimates of the population size and profile were obtained from the weighted staff return survey. Response probabilities were then estimated by comparing the sample profile with the estimated population profile (from the weighted staff return data). Calibration weights were produced to ensure the sample matched the population estimates at the margins. The design effect resulting from the non-response weighting is 1.22 (Kish estimator), meaning that the overall effective sample size is estimated as c.179. To calculate accurate effective sample sizes and margins of error for survey estimates the complex samples package of SPSS (or the survey package of Stata or R) should be used taking into account the non-response weighting and the clustered nature of the data collection.
28
Leaders (excluding governors)
Weights were required to compensate for differential non-response. Estimates of the population size and profile were obtained from the weighted staff return survey. Response probabilities were then estimated by comparing the sample profile with the estimated population profile (from the weighted staff return data). Calibration weights were produced to ensure the sample matched the population estimates at the margins. The design effect resulting from the non-response weighting is 1.15 (Kish estimator), meaning that the overall effective sample size is estimated as c.1,970. To calculate accurate effective sample sizes and margins of error for survey estimates the complex samples package of SPSS (or the survey package of Stata or R) should be used taking into account the non-response weighting and the clustered nature of the data collection.
Leaders overall
The governors and senior staff weights were also used to construct a combined leaders weight. The separate weights (outlined above) were scaled according to the estimated population of each group; this ensures that governors and senior staff members are represented in correct proportion to their population size.
The design effect resulting from the non-response weighting is 2.51 (Kish estimator), meaning that the overall effective sample size is estimated as c.991. To calculate accurate effective sample sizes and margins of error for survey estimates the complex samples package of SPSS (or the survey package of Stata or R) should be used taking into account the non-response weighting and the clustered nature of the data collection.
Overall teacher and leader weight
The teacher and leader weights were also used to construct an overall weight. The separate weights (outlined above) were scaled to ensure that the two groups are represented in correct proportion to their population size.
Some individuals are classified as both teachers and leaders; the overall weight for these individuals was calculated as the mean of their (scaled) teacher and leader weights. The design effect resulting from the non-response weighting is 1.84 (Kish estimator), meaning that the overall effective sample size is estimated as c.5,231.24 To calculate accurate effective sample sizes and margins of error for survey estimates the complex
29
samples package of SPSS (or the survey package of Stata or R) should be used taking into account the non-response weighting and the clustered nature of the data collection.
Data processing and coding
Cleaning and editing of data
The staff return questionnaire completed by each college was checked for internal consistency, completeness and accuracy. Where issues were identified, the Kantar Public research team attempted to contact the college to clarify these issues and to obtain more accurate information.
The staff data was also cleaned to ensure that the data for each college was consistent, this involved:
• Where fields were left empty (at which an answer of zero would not be valid) the missing data was imputed. The imputation was based on the college size (the number of teachers provided at Q2), region and
deprivation based on responses from colleges with similar characteristics. Four colleges did not provide a number for ‘other senior leadership’
at Q1, so these figures were imputed
Two colleges had left parts of Q3 blank, so the blank fields were imputed
One college had lower sum of teachers Q5 compared to the total number of teachers provided at Q2 and they had left two parts of Q5 blank. These values were imputed.
• Where colleges provided disaggregated figures of teachers (at Q3 part-time / full-time) and these did not sum back up to the total number of teachers (entered at Q2) the disaggregated figures were scaled back to the correct totals.
• At Q4 and Q6, Q7 and Q8 teachers could be counted more than once in the disaggregated figures (due to the fact a teacher can have more than one contract and teach more than one subject). At these questions the disaggregated figures were only scaled if they summed up to less than total number of teachers given (Q2)
Coding
30 Two types of coding were undertaken:
• Partial open-ended questions allow respondents to enter an answer which cannot
be categorised into a pre-existing response option. For each partial open-ended question, the coding team checked whether any of the verbatim responses given in the ‘other specify’ category could be coded as an existing response option (this exercise is commonly known as back-coding). On questions where the ‘other’ answer category exceeded 10% of the total number of responses, answers were reviewed, and new codes were created if necessary
• For full open-ended questions, verbatim responses were reviewed by the coding
team and a code frame was created out of frequently recurring responses Initial coding was reviewed by the research team to check the quality of coders’ work in terms of what had been back-coded to each answer category and what new codes had been added to the code frame.
On both the teachers and leaders survey staff were asked what subject they taught. Subjects were separated over three questions, one for vocational subjects, one for
academic subjects, and one for other provision, all of which gave an option to write in any other subjects that had not been specified. Cases where a respondent specified an
academic subject where the question asked for a vocational subject were back-coded to the academic question, and vice versa to improve the accuracy of data.
SPSS and table outputs
The SPSS datasets were checked and cleaned25, and underwent basic editing. This included: the addition of sample variables needed for analysis; the addition of weighting variables; and the derivation of new variables required for analysis.
The final outputs consisted of three SPSS datafiles and three sets of tables which included all in scope staff for the principal survey and the teachers and leaders survey:
• Staff return SPSS datafile
• Principal survey SPSS datafile and tables
• Teacher and Leader survey SPSS datafile and two sets of tables, one showing only teachers, and one showing only leaders
31
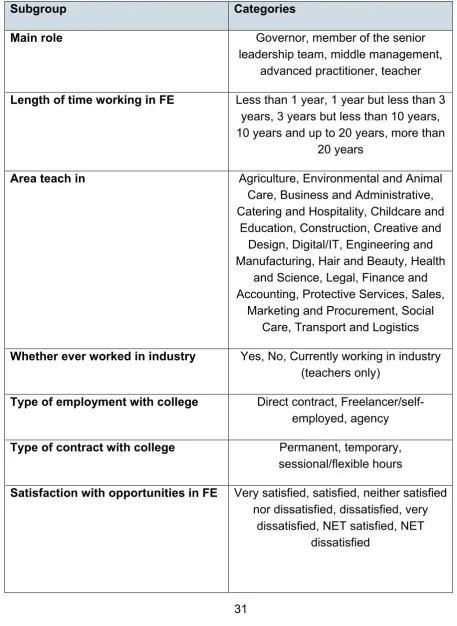
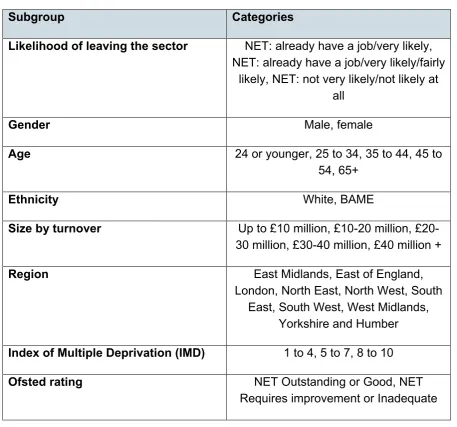
Subgroup analysis
The results for teachers and leaders were analysed as two distinct groups. In addition to the teacher/leader split, additional subgroup analysis was carried out on the
[image:31.595.63.521.176.803.2]cross-tabulations detailed in Table 6.
Table 6 Subgroup analysis for teachers and leaders
Subgroup Categories
Main role Governor, member of the senior
leadership team, middle management, advanced practitioner, teacher Length of time working in FE Less than 1 year, 1 year but less than 3
years, 3 years but less than 10 years, 10 years and up to 20 years, more than
20 years
Area teach in Agriculture, Environmental and Animal
Care, Business and Administrative, Catering and Hospitality, Childcare and
Education, Construction, Creative and Design, Digital/IT, Engineering and Manufacturing, Hair and Beauty, Health
and Science, Legal, Finance and Accounting, Protective Services, Sales,
Marketing and Procurement, Social Care, Transport and Logistics Whether ever worked in industry Yes, No, Currently working in industry
(teachers only)
Type of employment with college Direct contract, Freelancer/self-employed, agency Type of contract with college Permanent, temporary,
sessional/flexible hours
Satisfaction with opportunities in FE Very satisfied, satisfied, neither satisfied nor dissatisfied, dissatisfied, very
32
Subgroup Categories
Likelihood of leaving the sector NET: already have a job/very likely, NET: already have a job/very likely/fairly
likely, NET: not very likely/not likely at all
Gender Male, female
Age 24 or younger, 25 to 34, 35 to 44, 45 to
54, 65+
Ethnicity White, BAME
Size by turnover Up to £10 million, £10-20 million, £20-30 million, ££20-30-40 million, £40 million +
Region East Midlands, East of England,
London, North East, North West, South East, South West, West Midlands,
Yorkshire and Humber Index of Multiple Deprivation (IMD) 1 to 4, 5 to 7, 8 to 10
Ofsted rating NET Outstanding or Good, NET
Requires improvement or Inadequate
Differences between subgroups were reported only when they were both statistically significant and relevant to the survey objectives. Additional ad hoc subgroup analysis was used in order to further investigate some of the key findings.
Statistical significance
[image:32.595.65.523.56.483.2]Results from all surveys are attempts to estimate “true values” in a wider population; all figures come with an associated margin of error. As such, all differences quoted in the main survey report have been tested for statistical significance; that is, the difference is significant once the margins of error have been accounted for.
33
trend. Such differences are sometimes described as being indicative, as opposed to statistically significant, or substantive. Applying weights to data as described earlier in this section, while tending to make the quoted figures more representative of the
34
Appendix A: Questionnaires
STAFF RETURN
Thank you for taking the time to complete this survey. The Department for Education have commissioned Kantar Public (an independent research company) to deliver the survey. The questions are about the composition of the workforce in your college.
The survey should take no longer than 5 minutes to complete, but may require you to look up certain pieces of information (for example the number of staff with teaching roles in particular subject areas or faculties). We will keep your answers completely confidential. All information provided will only be used for research purposes and all findings will be anonymised.
Please provide numbers of staff in terms of headcount (simply the number of staff, regardless of the hours they work per week). We do not need the numbers by Full-Time Equivalent (FTE).
Later in the year, as a thank you for your support, we plan to provide your college’s data back to you in a way that will allow you to benchmark your institution against the rest of the sector. In order for Kantar Public and RCU to do this, you must complete and return this questionnaire. Without a returned questionnaire, it will not be possible to calculate and provide your college level data.
Once you have finished the survey, please could you return to Kantar Public using the freepost envelope included in the pack of documents we sent to your college or send a scanned
completed copy of the document to [email protected]. Please contact the research team at Kantar Public on 0800 051 0883 or [email protected] if you have any questions about the research.
We ask that the person who completes this questionnaire enters their name, phone number and email address below. This is so the research team at Kantar Public can contact you if we need to clarify any information.
Name:
35
How many staff currently work for your college in the following leadership roles? Your best estimate is fine. Please enter one number per box below.
College governors……… Heads of faculty / subject……….. Other members of the senior leadership...
1. How many teaching, training or lecturing staff currently work for your college?
This should include all full and part-time staff as well as supply, agency, ‘occasional’ or sessional teaching staff. Please exclude any teaching assistants or teaching support staff.
Please enter the number of staff…………....
2. How many of these teaching staff work:
We are interested in the number of staff the college employ who have flexible hours contracts which would flex depending on curriculum and student demands. These contracts might also be called sessional or teaching hours contracts, or your college may use different terminology.
full-time hours (By full-time we mean 35 hours or more per week) part-time hours (By part-time we mean less than 35 hours per week) sessional or flexible hours
3. How many supply staff currently teach in your college? Please enter the number of staff…………....
4. And how many teaching, training or lecturing staff currently…? Please enter a number for each row / type of contract in the boxes below.
Hold a permanent contract with the college
Hold a fixed term or temporary contract with the college
Hold a zero, minimal or flexible hours contract with the college
Are employed through an agency
Are self-employed / work as freelancers
36
5. And how many teaching, training or lecturing staff currently teach in the following vocational or technical areas / subjects?
Please see enclosed document which gives example subjects within each of the below subject areas, if you are unsure of what to include within any of the categories
Please enter a number for each row. Please enter 0 if you have no teaching staff in that subject. We will ask about literacy, numeracy, ESOL, preparation for work, SEN or supported learning, life skills, A-levels, GCSEs and other academic subjects in following questions.
Your best estimates are fine if you do not have this information readily available.Please leave notes where you are unsure of anything and the research team can contact you to discuss. Alternatively, you can contact the research team on 0800 051 0883 or [email protected] if you have any queries.
Agriculture, Environmental and Animal Care……….
Other (specify)
Business and Administrative…………...
Catering and Hospitality……….
Childcare and Education………. Other (specify)
Construction………
Creative and Design………..
Digital / IT………. Other (specify)
Engineering and Manufacturing………
Hair and Beauty………
Health and Science………
Legal, Finance and Accounting………..
Protective Services………. Sales, Marketing and
Procurement….
Social Care………
37
6. How many teaching, training or lecturing staff currently teach in the following areas / subjects? Please enter a number for each row. Your best estimates are fine if you do not have this information readily available. Please enter 0 if you have no staff teaching in that subject.
By standalone literacy and numeracy courses, we mean provision which leads to qualifications in numeracy and literacy skills.
Please leave notes where you are unsure of anything and the research team can contact you to discuss. Alternatively, you can contract the research team on 0800 051 0883 or
[email protected] if you have any questions.
ESOL……… Standalone literacy or adult basic English skills ……… Standalone numeracy or adult basic maths skills……… Preparation for work……….
SEN or Supported learning provision……….
38
7. And how many teaching, training or lecturing staff currently teach in the following areas / subjects which lead to academic qualifications, including but not limited to A-levels or GCSEs? Please enter a number for each row. Your best estimates are fine if you do not have this information readily available. Please enter 0 where you have no staff in that subject or please tick the box at the bottom of the list ‘None of these subjects’ if your college does not deliver any of this learning provision.
Please leave notes where you are unsure of anything and the research team can contact you to discuss. Alternatively, you can contact the research team on 0800 051 0883 or
[email protected] if you have any questions.
Art and Design………. Psychology………..
Biology……….…………... Religious Studies.
Business Studies………..………. Sociology…………..
Chemistry……….………. Spanish………..
Design and Technology.……… Other (specify)
Drama……….………..
Economics………. None of these subjects
English………
French………
Geography…………..………
German………..………..
History.……….……….………
Law…..……….……….……….
Mathematics………
Media/Film/TV Studies……….
Physical Education………
Physics……….
39
The next few questions are about recruiting and retaining teaching staff. By that we mean staff who have direct responsibility for teaching, training and lecturing learners in your college.
8. In which of the following areas subjects do you have any vacancies?
Please include positions that are currently filled by supply staff while you are recruiting
If you are able please write in the approximate number of vacancies in each area in the boxes below.
Agriculture, Environmental and Animal Care……….
SEN or supported learning provision….
Business and Administrative…………... Life skills………..
Catering and Hospitality………. Other (specify)
Childcare and Education……….
Construction………
Creative and Design……….. Other (specify)
Digital / IT……….
Engineering and Manufacturing………
Hair and Beauty……… Other (specify)
Health and Science………
Legal, Finance and Accounting………..
Protective Services………. Sales, Marketing and
Procurement….
Social Care………
Transport and Logistics………
ESOL………
English/literacy………..
Maths/numeracy……….
Preparation for work………
40
9. Across the last academic year, how many vacancies have been filled by supply staff whilst you
have been recruiting?
If you are able please write in the approximate number of vacancies in each area in the boxes below.
Agriculture, Environmental and Animal Care……….
SEN or supported learning provision….
Business and Administrative…………... Life skills………..
Catering and Hospitality………. Other (specify)
Childcare and Education……….
Construction………
Creative and Design……….. Other (specify)
Digital / IT……….
Engineering and Manufacturing………
Hair and Beauty……… Other (specify)
Health and Science………
Legal, Finance and Accounting………..
Protective Services………. Sales, Marketing and
Procurement….
Social Care………
Transport and Logistics………
ESOL………
English/literacy………..
Maths/numeracy……….
41
Principal questionnaire
Thank you for taking the time to complete this survey. Kantar Public (an independent research organisation) has been commissioned by the Department for Education to deliver the survey on its behalf. The survey should take no longer than 10 minutes to complete and we will keep your answers completely confidential. All information provided will only be used for research
purposes and all findings will be anonymised. If you have any questions about the research please contact Kantar Public on [email protected] or call the research team at Kantar Public on 0800 051 0883.
If you need to leave the survey at any point, you can re-enter the survey where you left off.
Please click the forward arrow to begin the survey
SECTION 1 – BACKGROUND INFORMATION FOR PRINCIPAL
ASK ALL Single code Q_longPrincipal
How long have you worked as part of the senior leadership team at {insert name of college}?
Please exclude any career breaks. If you are not sure please choose the option that you think is nearest.
READ OUT
1. Less than 1 year
2. 1 year but less than 3 years 3. 3 years but less than 10 years 4. 10 years and up to 20 years 5. More than 20 years
ASK ALL Single code Q_longLeader
In total, how long have you been working as a leader in FE – including time working for colleges, sixth form colleges or any other Further Education providers?
Please exclude any career breaks. If you are not sure please choose the option that you think is nearest
42 1. Less than 1 year
2. 1 year but less than 3 years 3. 3 years but less than 10 years 4. 10 years and up to 20 years 5. More than 20 years
ASK ALL Single code Q_LeaderTeach
Have you ever worked as a teacher, lecturer or trainer in FE before becoming a leader? 1. Yes
2. No
IF WORKED AS A TEACHER (IF Q_LeaderTeach = 1)
Single code Q_longFE
In total, how long did you work as a teacher, trainer or lecturer?
Please exclude any career breaks. If you are not sure please choose the option that you think is nearest
READ OUT
1. Less than 1 year
2. 1 year but less than 3 years 3. 3 years but less than 10 years 4. 10 years and up to 20 years 5. More than 20 years
ASK ALL Single code Q_IndAny3
Did you ever work in industry or outside of education before you started working as a leader in FE?
43
ASK IF ANY INDUSTRY EXPERIENCE BEFORE LEADERSHIP ROLE (IF Q_IndAny3=1) Multi code
Q_IndAny4
In which of the following industries or sectors did you work? Please select all that apply
1. Agriculture, Environmental and Animal Care (For example, farming, horticulture, agricultural or environmental management)
2. Business and Administrative (For example, training related to human resources, or office management)
3. Catering and Hospitality (For example, catering or events management, culinary related qualifications (food hygiene, training to become a chef or baker)
4. Childcare and Education (For example, nursery and early years education, teaching and childminding)
5. Construction (For example, construction supervision, brick laying, joinery, building or civil engineering, carpentry, electrical engineering)
6. Creative and Design (For example, graphic design, journalism, fashion design)
7. Digital / IT (For example, systems design, software development, web design, programming) 8. Engineering and Manufacturing (For example, engineering, mechanics)
9. Hair and Beauty (For example, hair dressing, beauty)
10.Health and Science (For example, nursing, pharmacy, sports science, dentistry, nutrition) 11.Legal, Finance and Accounting (For example, accountancy, law, finance)
12.Protective Services (For example, policing, fire service, army)
13.Sales, Marketing and Procurement (For example, fashion buying, market research, estate agency, procurement)
14.Social Care (For example, care work)
44
ASK IF ANY INDUSTRY EXPERIENCE BEFORE LEADERSHIP ROLE (IF Q_IndAny3=1) Single code
Q_IndAny5
In total, how long did you work in industry / outside of education - before working as a leader in FE?
Please exclude any career breaks. If you are not sure please choose the option that you think is nearest
READ OUT
1. Less than 1 year