Article
Experimental Study of Particles Induced by Screw
Tightening Process for Hard Disc Drive Assembly:
Effects of ‘Bit’ Speed
Somchai Laksanasittiphan
1,a,*, Karuna Tuchinda
2,b, Anchalee Manonukul
3,c,
and Surasak Suranuntchai
1,d1 Department of Tool and Materials Engineering, King Mongkut’s University of Technology Thonburi,
Bangkok, Thailand
2 Department of Mechanical and Process Engineering, The Sirindhorn International Thai-German
Graduate School of Engineering (TGGS), King Mongkut's University of Technology North Bangkok, Bangkok, Thailand
3 National Metal and Materials Technology Center (MTEC), National Science and Technology
Development Agency, Pathumthani, Thailand
E-mail: a[email protected] (Corresponding author), b[email protected], c[email protected], d[email protected].
Abstract. The morphology of particles generated during screw tightening process in hard
disc drive assembly was studied using a media installing tool kit under a class 100 clean room condition. The screws were made of martensitic 410 stainless steel and the ‘bit’ was made of S2 tool steel. The ‘bit’ speeds used during the screw tightening process can be divided into two steps: the beginning and the final speeds. The effect of both speeds on the morphology of particles generated was investigated. The studied parameters were the aspect ratio and the appearance cross-sectional area of particles. Particles with different sizes were found suggesting that there were different wear mechanisms. Small particles were caused by adhesive wear, while the larger particles were generated by fatigue wear. The appearance cross-sectional area of particles was found to decrease with increase in both speeds within the speed of 250 r/min, after which the appearance crosssectional area appeared to be constant. The effect of cold-weld at asperities was obvious resulting in an increase in aspect ratio at a higher speed. The understanding of the effect of bit speed on the particles morphology during the screw tightening processes could be very useful in the design of the cleaning system in hard disc drive production.
Keywords: Screw tighten process, ‘bit’ speed, hard disc drive assemble, particles, wear.
ENGINEERING JOURNAL Volume 22 Issue 1
1.
Introduction
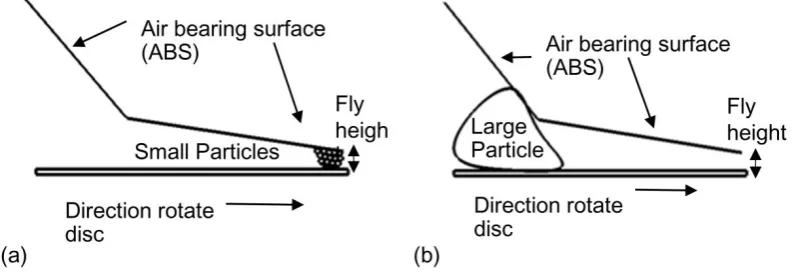
Hard disc drive (HDD) manufacturing industry plays an important role in driving the country’s economy in Thailand. The understanding of the major problems in the HDD industries is essential and could increase capability and create added value in the industries. One of the major problems in the HDD manufacturing industries is particle contamination as particles significantly affect the reliability of the HDD. Types of damage created on the disc are to a great extent dependent on the relative hardness of the interacting materials, particle shape and particle size. The HDD head flying height over the disc is in the sub-micron range. The particles smaller than the space between the head and disc can easily enter the space and later accumulate at the edges on the air bearing surface (ABS) as shown in Fig. 1 [1]. Accumulated particles will cause the head to move up and down or from side to side leading to the head damage (see Fig. 1(a)). Park et al. [2] designed a ‘comb-shaped’, ‘clamp’ and ‘spacer’ to improve the efficiency of the recirculation filter in the operation of the HDD. The designs were evaluated by numerical and experimental approaches, in terms of radial directional flow velocity, decay rate and percentage clean-up of particle concentration. The results showed that the ‘clamp’ and ‘spacer’ with the ‘comb-shaped’ pattern of 45º was the best candidate for reducing the nanoparticles inside HDD.
The large contaminated particle could also generate damage in HDD. The motor in HDD usually rotates at high speed leading to high travelling speed of larger particles at the entrance of the head and the disc space resulting in particle trapping in such area. The particle geometry can be very crucial. The slender the particles, the larger possibility they can be drawn into the space. As a result, the head could be damaged as it is pushed and tilted by the particles in contact with the disc [1] as shown in Fig. 1(b). Hence, controlling the morphology, that is, larger and roundness, of particle would be very useful towards reducing particle induced damage. Particles may be generated during the normal operation of the drives or during the manufacturing process, for example, screw tightening and robot picking up or placing components of HDD.
Fig. 1. Illustration of the effect of (a) small particles and (b) large particles.
[image:2.595.98.497.408.546.2]The screw tightening during the manufacturing process has been found to be one of the main contamination stage with significant amount of generated particles observed. As discussed earlier, the particles morphology could effect the degree of damage severity. The morphology of the particles induced during service largely resulted from material failure mechanism at contact area. Material failure behaviour depends strongly on the stress-strain distribution which varies with the working conditions. Therefore, the understanding of the effect of the in-service parameters during screw tightening process, that is, ‘bit’ speed, could be very useful.
The previously published work on the particle generated during the screw tightening process for HDD assembly has not yet been found. Hence, this research focuses on the influence of the speed of the ‘bit’ on particle morphology, that is, the shape and size of the particles generated. The parameters to characterise the particles include the aspect ratio (AR) and the appearance cross-sectional area. The research results could be used as the guideline to adjust screw tightening process parameter in the production line to minimise the particle-induced damage. Moreover, the understanding of the character of the particles induced from the stainless steel screw experienced different spindle speed histories during the screw tightening processes could help in identifying shape and size of the particles were generated. It can be used during the HDD process development and particle removal processes.
2.
Experimental Procedures
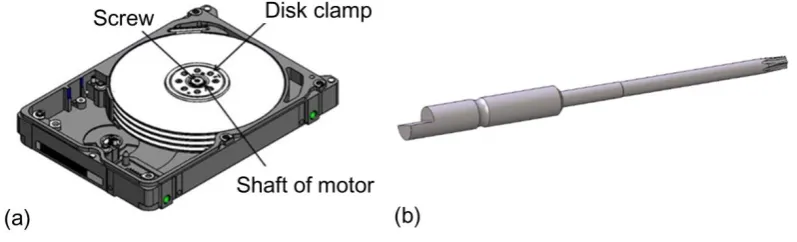
In this work, the screw tightening process was studied using a component-level HDD in the production line, which consists of ‘Motor to Base’ (MBA) and other related components. This is similar to the process assemble in the production line. Component-level HDD and ‘bit’ are shown in Fig. 2.
Fig. 2. Illustration of (a) component-level hard disc drive (HDD) assembly and (b) ‘bit’.
Prior to each test, the component-level HDD components, that is, the MBA, the screw, the disc clamp and the media, were thoroughly cleaned with isopropyl alcohol (IPA) to ensure the cleanliness. The experimental setup was carried out under a class 100 clean room condition. A new set of ‘bit’, screw and MBA was used at the beginning of each test. The load of the ‘bit’ was applied by controlling the air pressure in the chamber of air cylinder using the air regulator similar to the load control of the ‘bit’ in the
actual production. The force was measured by a load cell. In this work, the load of the ‘bit’ was fixed at 1.5 kgf. The tests were performed at different ‘bit’ speeds. The rotational speed of the ‘bit’ can be adjusted
[image:3.595.98.497.372.493.2]based on the mean values (average from 120 particles, that is, 60 samples per set with two sets of tests for each condition studied).
Table 1. Different “bit” beginning speeds studied.
Final speed (r/min) Beginning speed (r/min)
150 125 250 375 500 625
[image:4.595.66.528.217.258.2]450 125 250 375 500 625
Table 2. Different “bit” final speeds studied.
Beginning speed (r/min) Final speed (r/min)
125 50 150 250 350 450
500 50 150 250 350 450
Particles with different sizes ranging from 1 to 20 µm were found. The image of each individual particle was analysed using an image analysis software. The area (the appearance cross-sectional area) was directly obtained from the image based on total number of pixels enclosed by the boundary [7]. The AR was estimated from Eq. (1) given as follows [8].
L
L
AR
mn mj
(1)where Lmj is the length of major axis and Lmn is the length of minor axis. Major and minor axes are defined as the two perpendicular lines with the longest line called the major axis and the longest line perpendicular to the major axis called the minor axis. This is illustrated in Fig. 3. Continuous curve was used to study the particle distributions (see Fig. 4) plotted by connecting the midpoints of each histogram bar, that is, AR or area. The numbers representing the intervals (bin) and interval width (range) were calculated using Sturges’ [9]rule
𝐽 = 1 + 3.3𝑙𝑜𝑔
10𝑛
(2)j
value
Minimum
value
Maximum
Rang
(
_
_
)
(3)where J is the number of bins and n is the total number of measurements.
[image:4.595.218.377.536.723.2]Fig. 4. Histogram distributed data with continuous curve overlaid on the bins.
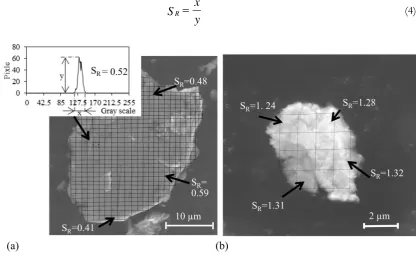
Surface analysis with scanning electron microscopy (SEM) showed that the particles could be classified into two different groups: smooth and rough surfaces. Figure 5 shows the micrographs of typical particles. The smoothness or roughness of particle surface can be quantified using grey-level (intensity) variations (fixed to be 0–255) [10]. Verma et al. [11] present a novel approach for histogram processing of irregular images for medical image analysis, and the method is applied in this research. The analysed region is selected by drawing squares of equal sizes of 1.5 x 1.5 µm2 on particle. From a frequency distribution,
particle surface image analysis (SR) is defined as a ratio between the horizontal axis of the graph that represents the width of the grey-scale (x) and the vertical axis of the graph that represents the maximum number of pixels (y) as shown in Eq. (4). If SR is
≤
1, the surface is identified as smooth, and the surface is considered rough if SR is > 1y
x
S
R
(4)Fig. 5. Examples of typical surface of particles and use distribution shapes to determine (a) smooth surface in large particles and (b) rough surface in small particles.
3.
Results and Discussion
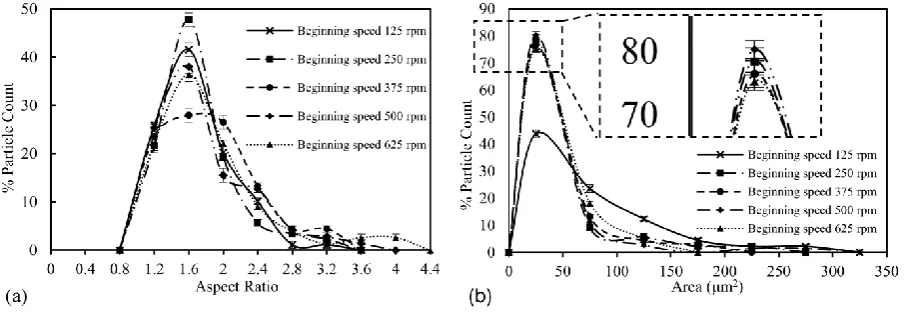
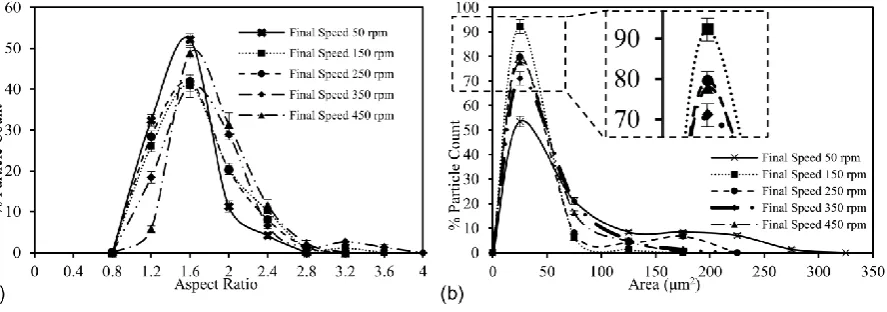
[image:5.595.178.419.83.230.2] [image:5.595.110.528.412.671.2]screw wear during tightening. The data distribution of the particle morphology for various beginning and final speeds is shown in Figs. 6–9. Figure 6 shows particle count distribution of the particle morphology for varied beginning speeds (the final speed was fixed at 150 r/min). It can be seen that the maximum population for all speeds falls in the same range, that is, 1.4–1.8 and 1–50 µm2 for AR and area,
respectively. However, the maximum percentage of particle count found for both AR and area varies with different beginning speeds. For example, the maximum population of 48.8% was found at the beginning speed of 250 r/min, whereas only 28.3% was found at the beginning speed of 375 r/min for AR (Fig. 6(a)). From Fig. 6(b), the maximum percentage of particle count for area was found to be 47% at the beginning speed of 125 r/min, whereas the maximum percentage of particle count of 80% was found at the beginning speed of 500 r/min. Figure 7 shows particle count distribution of the particle morphology for varied beginning speeds with the fixed final speed of 450 r/min. It can be seen that the beginning speed has similar effect on AR and area, that is, the maximum population for 125, 250, 500 and 625 r/min falls in the
same range, that is, 1.4–1.8 and 1–50 µm2 for AR and area, respectively. Except 375 r/min shows the AR
range of 1.6–2.4 µm2 and area range of 1–50 µm2. Figures 8 and 9 show particle count distribution of the
particle morphology for varied final speed at the fixed beginning speeds of 125 and 500 r/min, respectively. It can be seen that the maximum population for 50, 150 and 250 speeds falls in the same range, that is, 1.4– 1.8 and 1–50 µm2 for AR and area, respectively.
Fig. 6. Results of the (a) aspect ratio and (b) area of the particles at varied beginning speed. (The final speed was fixed at 150 r/min.)
Fig. 7. Results of the (a) aspect ratio and (b) area of the particles at varied beginning speed. (The final speed was fixed at 450 r/min.)
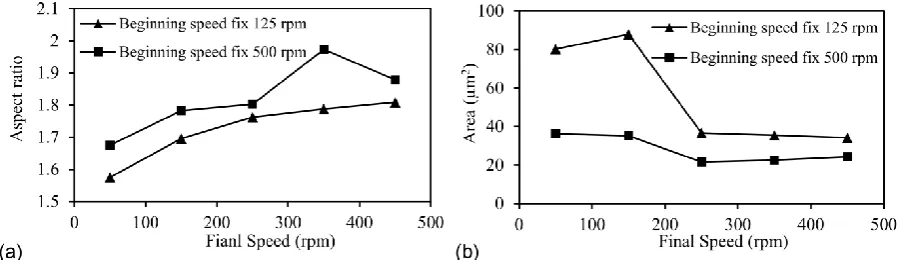
[image:6.595.72.525.306.463.2] [image:6.595.75.525.520.677.2]tend to have higher values of AR at higher beginning and final speeds (Figs. 10(a) and 11(a)). Increase in both speeds results in higher effective stress developed at the contact zone. Hence, a stronger adhesive strength at the interface resulted in elongation of the material before failure. From Figs. 10(b) and 11(b), it can be seen that lower ‘bit’ speed results in generation of bigger particles (Fig. 12). The maximum particle area of 87.9 µm2 was found for the beginning speed of 125 r/min, whereas the value of 37.2 µm2 was found
for the beginning speed of 250 r/min. This is caused by longer duration of contact leading to an increased area of contact [12]. The frictional force was increased at very high speed. This was expected due to the effect of the strain hardening on screw material, such effect is to increase material resistance to further plastic deformation. Increase in frictional force results in different patterns of stress distribution to be developed at the contact zone. At higher speed, the positions of the maximum effective stress shift closer to the surface and towards the leading edge of the area of contact resulting in the change in particle AR and area as observed [13]. However, above a critical speed, no further change in stress distribution in area that will later be worn off is significantly observed. This observation is in good agreement with that found in the previous work by Chen and Wang [13]. The critical speed is expected to vary with material type and contact conditions, which should be studied in more detail for certain applications. Such findings are shown in Figs. 10 and 11.
Fig. 8. Results of the (a) aspect ratio and (b) area of the particles at varied final speed. (The beginning speed was fixed at 125 r/min.)
[image:7.595.81.525.295.451.2] [image:7.595.73.524.514.664.2]Fig. 10. The average value of the (a) aspect ratio and (b) area of the particles at varied beginning speed. (The final speed was fixed at 150 r/min and 450 r/min.)
Fig. 11. The average value of the (a) aspect ratio and (b) area of the particles at varied final speed. (The beginning speed was fixed to be 125 r/min and 500 r/min.)
Fig. 12. SEM images of wear particles with different speed: (a) large particles; and (b) small particles.
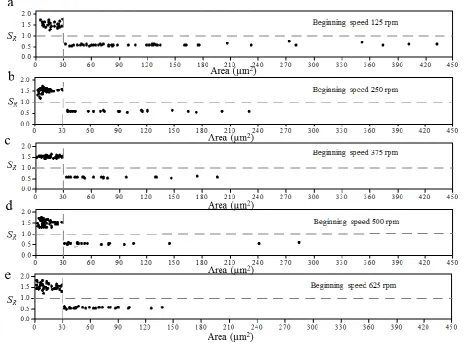
[image:8.595.79.508.488.707.2]respectively; from the results, it can grouped into two groups, that is, group 1 with area of
≤
30 µm2 and SRof >1.0 and group 2 with area of >30 µm2 and SR of
≤
1.0.It can be noted that the particles with smooth surface were found to be large with average area of
≥
30 µm2. The rough surface particles were found to be small with average area of <30 µm2. The smaller particlewas caused by adhesive wear. Its rough surface was as a result of large deformation related with adhesive wear [14]. The large particles show brittle manner of failure with smooth surface observed; hence, they are expected to be generated by fatigue wear [14, 15]. Large particles are mostly found at low speed for both beginning and final speeds. At the lower speed, the average contact pressure at asperity was lower due to bigger area of contact. Single contact may not result in material failure; however, material would finally worn off due to fatigue wear.
[image:9.595.72.543.270.615.2]From Figs. 13 and 14, it can be seen that both adhesive and fatigue wear induced particles were found at all speeds with the amount of particles generated by fatigue wear reduce at higher speed, that is, less big smooth particles are observed at higher speed.
Fig. 13. SR with different beginning speed: (a) 125 r/min; (b) 250 r/min; (c) 375 r/min; (d) 500 r/min; (e) 625 r/min. (The final speed was fixed at 150 r/min.)
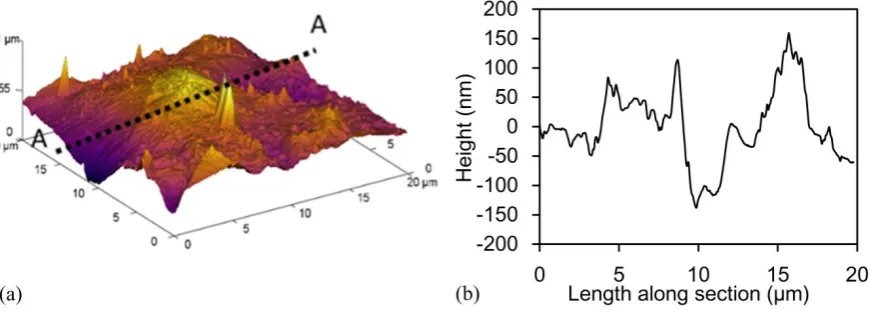
Figure 15 shows the image of the screw surface (before screwing) obtained from AFM. It can be seen that a major peak has an average width and height of approximately 1–4 µm and 0.1–0.3 µm, respectively. This is consistent with the low value of particle area found for small particles, that is, <30 µm2. The
Fig. 14. SR with different final speed: (a) 50 r/min; (b) 150 r/min; (c) 250 r/min; (d) 350 r/min; (e) 450 r/min. (The beginning speed was fixed at 125 r/min.)
Fig. 15. Atomic force microscopy (AFM) of screw surface: (a) surface 3D; and (b) section view A.
[image:10.595.84.519.493.652.2]controls the efficiency of the particle removing process. Therefore, the understanding of the failure mechanism and the morphology of the particles generated would be very useful for the research to develop and improve cleaning system in HDD production. Also, the results can guide engineer for recommendation of material improvement to minimise the problems induced by particle generation. It was suggested by the results that the main mechanism controlling surface particles generated is adhesive and fatigue wear. Although the predominant mechanism for different screwing conditions, that is, bit speed, should be studied in more detail, such observation suggested that reduction in material adhesive and fatigue wear would result in lower particle generations. Soft solid lubricant coatings such as molybdenum disulphide– based film may be considered for minimizing adhesion wear. Whereas higher fatigue strength materials or improving material fracture toughness using heat treatment or other process may be useful to reduce fatigue wear. The effect of bit speed on materials after treated with solid lubricant coating and cryogenic treatments has also been investigated, and the full analysis has been presented in Laksanasittiphanet al. [16, 17, 18]. The results showed that the use of solid lubricant coating prevents particle generation due to adhesive wear in laboratory conditions. However, for production conditions, the MoS2T coating had
insufficient strength under the multi-cycle loading conditions used in the screw tightening process. For cryogenic treatment, the result observed in the laboratory agreed well with that found for production conditions. The bit speed effect on particle morphology for treated materials was found to be similar to that for untreated ones, that is, at a slower bit speed, larger and rounder particles were generated.
4.
ConclusionIn this work, the morphology of particles generated during the screw tightening process with different ‘bit’ speeds for HDD assembly was studied using a component-level HDD in the production line. The relationship between the particle morphology and the beginning and final speeds was investigated. It can be seen that the particles have higher value of AR at higher beginning and final speeds. This is caused by stronger adhesive force developed at the contact regime. It was also found that increase in speed results in smaller particles generated. The particles could be classified into two different groups: (1) smooth and large and (2) rough and small. The surface of the large particles was found to be smooth due to fatigue wear.
The smaller particle with rough surface was caused by adhesive wear. It was a result of large deformation related to adhesive wear. The particles that are small and slender could increase the chance of the HDD being damaged. Hence, the best conditions for the range of bit speed investigated was found to be the case with the beginning speed of 125 r/min and final speed of 50–150 r/min to obtain big and round particles. This research leads to an understanding of mechanism responsible for particle generation, and the morphology of the particles becomes convenient and useful for the researches to develop and improve cleaning system in HDD production. The results can be used during the design process of the in-service parameters of the screw tightening process, and the related cleaning system in HDD production is used to minimise particle contamination problem.
Acknowledgements
This research work was financially supported by The Sirindhorn International Thai-German Graduate School of Engineering (TGGS) Research Fund.
References
[1] Western Digital, Internal Documents Training: Micro Contamination in Hard Disk Drive for Engineer. Phra Nakhon Si Ayutthaya: Western Digital (Thailand) Co., Ltd, 2010.
[2] S. E. Park, D. Y. Lee, J. H. Park, T. S. Kang, J. G. Yoo, and J. Hwang, “Design and performance test
of comb-shaped clamp/spacer for improvement of recirculation filter efficacy in a hard disk drive,” IEEE Transactions on Magnetics, vol. 45, no. 1, pp. 201-205, January, 2009.
[4] L. Zhang, R. Koka, Y. Yuen, and E. Lam, “Particle induced damage on heads and discs due to fine particles of different materials,” IEEE Transactions on Magnetics, vol. 35, no. 2, pp. 927-932, March, 1999.
[5] M. Roy and J. L. Brand, “Soft particle-induced magnetic erasure without physical damage to the media,” Journal of Tribol: T ASME, vol. 129, no. 4, pp. 729-734, April, 2007.
[6] Q. Zeng, R. Pit, R. Payne, P. Baumgart, and F. Y. Huang, “Modeling and simulation of hard-particle
interaction in head/disk interfaces,” IEEE Transactions on Magnetics, vol. 41, no. 2, pp. 604-609, February, 2005.
[7] T. C. Manjunath, “Detection of shapes of objects using sophisticated image processing techniques,”
International Journal of Computer Science & Emerging Technologies, vol. 1, no. 4, pp. 32-37, December, 2010. [8] J. C. Russ, The Image Processing Handbook, 6th ed. Boca Raton, FL: CRC Press, 2011.
[9] H. A. Sturges, “The choice of a class interval,” Journal of the American Statistical Association, vol. 21, no. 153, pp. 65-66, March, 1926.
[10] W. Khan, S. Kumar, N. Gupta, and N. Khan, “A proposed method for image retrieval using histogram values and texture descriptor analysis,” Int J Soft Comput Eng, vol. 1, pp. 33-36, 2011.
[11] K. Verma, L. K. Verma, and B. Singh, “Distance measurement using enhanced histogram approach
for irregular images,” International Journal of Computer Science and Information Technology & Security, vol. 2, no. 1, pp. 216-219, 2012.
[12] B. Bharat, “Adhesion and stiction: mechanisms, measurement techniques, and methods for reduction,”
J. Vac Sci Technol B, vol. 21, pp. 2262-2296, November, 2003.
[13] W.W. Chen and Q.J. Wang, “Thermomechanical analysis of elastoplastic bodies in a sliding spherical
contact and the effects of sliding speed, heat partition, and thermal softening,” J. Tribol: T ASME, vol. 130, no. 4, pp. 041402-1–041402-10, August, 2008.
[14] G. P. Stachowiak, G. W. Stachowiak, and P. Podsiadlo, “Automated classification of wear particles based on their surface texture and shape features,” Tribol Int, vol. 41, pp. 34-43, June, 2008.
[15] G. W. Stachowiak and A. W. Batchelor, Engineering Tribology, 3rd ed. Burlington, MA: Butterworth-Heinemann, 2005.
[16] S. Laksanasittiphan, K. Tuchinda, A. Manonukul, and S. Suranuntchai, “Use of MoS2T coating to
reduce wear particle generated in hard disc drive assembly,” Emerging Materials Research, vol. 5, no. 2, pp. 284–290, December, 2016.
[17] S. Laksanasittiphan, K. Tuchinda, A. Manonukul, and S. Suranuntchai, “Use of deep cryogenic treatment to reduce particle contamination induced problem in hard disk drive,” Key Engineering Materials, vol. 730, pp. 265-271, February, 2017.