White Rose Research Online URL for this paper: http://eprints.whiterose.ac.uk/78970/
Version: Accepted Version
Article:
Marsden, G, Kelly, CE and Snell, C (2006) Selecting indicators for strategic performance management. Transportation Research Record, 1956. 21 - 29. ISSN 0361-1981
https://doi.org/10.3141/1956-03
[email protected] https://eprints.whiterose.ac.uk/
Reuse
Unless indicated otherwise, fulltext items are protected by copyright with all rights reserved. The copyright exception in section 29 of the Copyright, Designs and Patents Act 1988 allows the making of a single copy solely for the purpose of non-commercial research or private study within the limits of fair dealing. The publisher or other rights-holder may allow further reproduction and re-use of this version - refer to the White Rose Research Online record for this item. Where records identify the publisher as the copyright holder, users can verify any specific terms of use on the publisher’s website.
Takedown
If you consider content in White Rose Research Online to be in breach of UK law, please notify us by
White Rose Research Online [email protected]
Universities of Leeds, Sheffield and York
http://eprints.whiterose.ac.uk/
This is the Author's Accepted version of an article published in Transportation Research Record
White Rose Research Online URL for this paper:
http://eprints.whiterose.ac.uk/id/eprint/78970
Published article:
Marsden, G, Kelly, CE and Snell, C (2006)Selecting indicators for strategic performance management. Transportation Research Record, 1956. 21 - 29. ISSN 0361-1981
SELECTING INDICATORS FOR STRATEGIC PERFORMANCE MANAGEMENT
For final published article, please see:
http://trb.metapress.com/content/e16x6rv852402683/?genre=article&id=doi%3a10.3141 %2f1956-03
Dr Greg Marsden (Contact) Charlotte Kelly
Institute for Transport Studies University of Leeds
Leeds LS2 9JT
UK
Tel: + 44 113 343 5325 Fax: + 44 113 343 5334 E-mail: [email protected]
Dr Carolyn Snell
Stockholm Environment Institute University of York
York YO10 5DD
UK
Tel: +44 1904 43 2897 Fax: +44 1904 43 2898 E-mail: [email protected]
ABSTRACT
There is a growing emphasis on the use of indicators for performance measurement and management in the transport sector. In the UK all local authorities are now required to set out five year programmes with commitments on progress on a range of mandatory and voluntary indicators linked to a series of key policy outcomes. Increasingly the financial settlements that they receive from central government will be related to their performance against these targets.
Different types of information are needed to fulfil different roles in the decision-making process. Research in the UK has indicated that there are too many indicators and yet too little clarity about what is being collected and reported on, at what level and why. This paper reports on a study examining the use of indicators in 16 local and regional authorities in the UK. Results from a questionnaire and a series of follow-up interviews are combined with the findings of a desk-top review of performance management in the public sector to propose a more logical and connected process for developing a suite of indicators that both supports strategy development and monitoring.
INTRODUCTION
Performance measurement as a means to inform performance management has been growing in sophistication and global application. Although lagging behind the fields of health and education, the assessment of transport system performance is rapidly expanding as a discipline(1, 2). Kelly and Snell(3)discuss the evolution of performance measurement in the UK public sector, from a monitoring of money spent (inputs) through to monitoring of what the money bought (outputs) following the expansion of the public sector post WWII. More recently, the emphasis has switched to monitoring outcomes, i.e. the end state that we wish to move towards (longer life expectancy, more efficient networks, emissions within environmental carrying capacity).
Since 2001, the UK Department for Transport has required local authorities to produce five year strategy documents setting out what they will attempt to achieve for the money they will be allocated. Authorities are required to set targets for their key indicators. Up to 2005, financial rewards (and penalties) were applied to authorities performing well (badly) against their targets. For the period 2006 to 2011, the link between performance against outcomes and financial reward has been made more explicit with up to 25% more (or less) than the indicative budget to be made available (withheld) relating to performance against targets (4). There is therefore a far greater emphasis on the development of coherent strategies that are well-linked to monitoring programmes.
In the transport field indicators such as traffic flows and road accidents have been monitored over many years. However, newer agendas such as social inclusion and climate change have a less established measurement tradition. This is further complicated by the expanse of different points in the decision-making process that monitoring takes place. Five broad stages to strategy development and implementation have been identified:
problem identification; strategy development; scheme design; implementation; and operation.
The implication of this is that different types of indicator will need to be used to capture the successful implementation of schemes compared to those used for an overall strategy assessment. How then do we make sense of the mass of different sorts of indicators we can measure so that reporting requirements do not grow out of control?
The paper begins by discussing the role of indicators and some principles underlying good practice in their selection. It then presents the results from a survey that was completed in the UK to determine how transport indicators are currently being used in the decision-making process and to investigate the ease with which local planning officers are satisfied with measuring and monitoring these indicators. The next section discusses how the different types of indicators that are collected might be linked in a logical framework for transport strategy development. The paper concludes with some recommendations for good practice in developing strategic performance management indicator frameworks. The data was collected as part of a wider programme of research into improving sustainable transport and land use planning (DISTILLATE - Design and Implementation Support Tools for Integrated Local land Use, Transport and the Environment).
Definition and purpose
Performance management provides the structures to aid in the process of planning, monitoring and reviewing to enable an organisations objectives to be achieved. The use of indicators allows an organisation to determine whether these policy objectives are being achieved. Ott (5) described indicators as “a means devised to reduce a large quantity of data down to its simplest form retaining essential meaning for the questions that are being asked of the data”. Mitchell et al. (6) state that indicators are needed to make sense of the ‘complex systems’ that we live in. In particular they identify four main reasons for using indicators to do this, which are:
They allow the synthesis of masses of data
They show the current position in relation to desirable states They demonstrate progress towards goals and objectives
They communicate current status to stakeholders so that effective management decisions can be taken that lead towards the targets
“Indicators are, therefore, a means of summarising the current position and the direction and rate of change of progress towards a particular goal or objective. As with any summary, the greater the degree of aggregation of the information the more the original picture can be lost. If indicators are to be useful to decision-makers they have to be simple enough to allow processing and trading off of performance between indicators that might be heading in different directions. At the same time, too many indicators may reduce the ability of an organisation to use the information effectively”(7).
Good practice in their selection
As one of the primary purposes of indicators is to communicate information to stakeholders about the position of a system or process it is essential that the suite of indicators selected matches the performance measurement that an organisation is focussed on. If not, those areas that are not considered risk being marginalised. What is counted is seen to be what counts – the so called ‘tunnel vision’ effect (8). The first stage in the process is to set clear organisational goals. Performance indicators are set which then reflect performance against these goals. There have been a number of reviews examining the factors that are important in selecting good indicators(9, 10, 11, 12). The key aspects picked out from this review that can be used in selecting indicators are listed below:
Clearly defined
Ambiguity over part of an indicator definition will lead to differences in measurement approach, e.g. “Number of people with good access to food shopping” should specify ‘good access’ and the quality of the food shopping that forms the benchmark.
Non-corruptible
Indicators should not include terms which would enable success to be achieved without really improving the situation. For example, indicators relating to the percentage of the population suffering from X could lead to the export of these problems to less dense areas.
Controllable
The Government wishes the indicators to reflect transport’s contribution to wider issues (e.g. health and education). However, indicators such as educational attainment levels are unlikely to be suitable for transport plans as they are influenced only in small part by transport access.
Most transport indicators appear to be measurable such as congestion and air quality. Wider indicators such as life expectancy are not measurable, merely forecastable.
Responsive
This is of critical importance, as indicators need to be selected that will show change over specific time periods and, through the use of trajectories, on a yearly basis. Many outcomes (e.g. air quality) are unlikely to show reliable change over yearly time periods. This issue is revisited later in the paper.
Easy to understand
The more information that is condensed into any one indicator the less true meaning it has for specific policy targets (e.g. Ecological footprint is very complex) and the greater the likelihood of double counting with other indicators. If indicators are to be useful to decision-makers and meaningful to the general public then they have to be comprehensible.
In addition, to these individual properties, as a whole, the suite of indicators should be cost effective to collect. The decision-making worth of the indicators must outweigh the cost of collecting them.
SURVEY RESPONSES ABOUT INDICATORS
One of the challenges presented to the DISTILLATE project by its local and regional partners was that there were too many indicators. Indicator sets currently used by local authorities include:
Local Indicators(13,14,15)
Regional Indicators(16)
National Indicators(17)
European Indicators(18)
It was also apparent from the partners that the role and impact of indicators varies widely across local authorities. These issues were investigated in more depth through a questionnaire survey of the partners. The questions on indicators formed one part of a larger questionnaire, the results of which are reported on in more detail in(19). In the survey with the exception of the European indicators, most of the indicator sets were found to be important to those involved especially those that they were required to measure (e.g. mandatory local transport plan indicators(14)).
The importance and satisfaction of local authorities with a range of criteria used in indicator selection is shown in Figure 1.
Insert Figure 1 about here
A score of between fairly important and very important combined with a score of between not satisfied and fairly satisfied was used to identify those issues of greatest concern to the partner organisations. The most important issues identified (top-left in Figure 1) were examined in more detail below through the use of a desk-top literature review and a series of follow-up interviews and the findings summarised below.
Well-founded targets
One of the issues identified by the survey was that practitioners are struggling with target setting. There are essentially three approaches to target setting:
2) Interpolation
3) Aspiration and assumption(20)
The survey found that not all authorities have transport models that cover their whole areas. Those that do are sometimes not up to date and can be restricted by an inability to represent all of the policy interventions that might be implemented (such as ‘soft measures’). Even those that do have well developed ‘transport models’ they are not necessarily well suited to providing estimates of system outcomes such as social inclusion and air quality. Where good models do exist they provide an excellent basis for exploring likely targets and trajectories. Where models do not exist, trend based interpolation is a useful and potentially effective alternative. It was highlighted by some respondents that ‘gaming’ – the deliberate selection of indicators and targets to avoid apparent poor performance - was undertaken. For example, in one local area a previous target had been to produce bus timetable boards for 100% of bus stops, however, this did not measure whether timetables were accurate or even present.
Cost-effective to monitor
The cost-effectiveness of individual or groups of indicators collected by single administrative units were evaluated by the questionnaire and follow up in-depth interviews. The in-depth interviews highlighted a lack of knowledge about the total cost of monitoring across the range of indicators currently used although the costs were often well understood for a particular policy area. As this remit expands, so it is suggested will the difficulty in keeping track of monitoring costs. An overall view of the costs and benefits of monitoring could be better established although some authorities already attempt to co-ordinate the collection of common indicators across departments.
Capable of capturing year-on-year improvements
One of the conflicts that has arisen through measuring performance using indicators in the UK has been the requirement to monitor indicators on a year by year basis, while trying to focus on outcomes such as air quality and accident rates, which are subject to random factors making identifying performance year on year difficult. Other factors such as consumer satisfaction and accessibility are likely to take even longer periods to demonstrate meaningful measures of change. Data that can be collected automatically such as flows are also subject to random variations but by collecting such information every day, it is easier to demonstrate statistically valid change.
It was suggested by the interviews conducted that local authorities were unlikely to take management action to respond to an indicator on an annual basis if there is a chance that the change may be a statistical anomaly.
It was unsurprising therefore that respondents indicated a preference to “select indicators that showed responsiveness in the short-term. Given that changes to the transport system outcomes tend to happen in the longer-term (for example attitudinal measures), this naturally appears to push the performance measurement into counting those things and selecting measurement methodologies that will demonstrate yearly variations” (7).
Easy to measure
The ease of measurement issue varied substantially across a range of indicator options presented to respondents as shown in Figure 2.
The overall picture is one of satisfaction with ease of measurement as many of the indicators have been measured over long time series (e.g. traffic levels, road safety, air quality):
Outcomes with high levels of importance and satisfaction are road safety, air quality and public transport user satisfaction
Outcomes with high levels of importance and intermediate levels of satisfaction include congestion and accessibility, probably due to the absence of adequate baseline data.
Outcomes with both intermediate levels of importance and satisfaction are CO2, economy, health, noise, street environment, and townscape. This appears to reflect
both a lack of history and comparative policy prominence for all of these issues in terms of reporting requirements and the difficulties in capturing outcomes that are one stage removed from the transport planning process (e.g. reduced hospital appointments through improved fitness (7).
It appears that a series of important outcome indicators relating to quality of life and also accessibility are difficult to measure and unlikely to be responsive to change in the short-term. It would appear that there is a substantial amount of further work to be done to establish meaningful indicators of outcomes of economic improvement, street environment and health that can meaningfully be measured.
Easily understood by politicians
The interviews were unable to throw much light on the way in which indicators are used by politicians. It was suggested that politicians were more likely to take an interest in progress against targets than in the details of the indicators, this being a matter for technical assessment.
Easily understood by the general public
Although indicators monitored by local authorities in the UK are supposed to be used to communicate with the general public there was little belief that the indicator sets formed a strong part in this process. The main exception being with special interest groups (for example, the cycle lobby) interested in the definition or target associated with their ‘mode’. It was suggested that this may, in part, be due to the lack of connection between the indicators and people’s own experiences of travel, for example, an aggregate bus reliability index is of little relevance to a regular bus user on a particular route. It was also suggested that requirements for area-wide reporting diluted the meaning of indicators to the public and that “the spatial scale at which information is provided is also important” (7).
Consistency between transport and planning indicators
There is scope for further integration of transport and planning indicators. In particular, one local authority was already using their accessibility indicators to help in the determination of the relative accessibility of new housing development for the purposes of identifying financial contributions from developers to offset transport impacts.
representative of sustainability. The interviews suggested that “The current indicator sets were typically assembled as a result of requirements from various statutory documents rather than with a view to representing sustainable development” (7). One concern raised was that where an aspect of policy is not counted then it may well not be seen to count.
The results from the questionnaire, interviews and literature indicate that to be able to measure certain outcomes from policy (e.g. health) a different structure of indicator selection was required. The next section presents the methodology that has been developed to enable relevant proxy indicators to be selected to allow decision makers to determine whether policy outcomes are being met in the absence of a direct link between cause and effect.
SELECTING INDICATORS
The UK Department for Transport sets out a hierarchy of indicators (and targets) that it wishes local authorities to use in developing their local transport plans (LTP). These are:
1. “Targets for key outcome indicators including targets for the relevant mandatory indicators…and any other targets for indicators that, in the opinion of the LTP authorities, directly measure the achievement of shared priorities.
2. Targets for intermediate outcomes, which represent proxies or milestones towards key outcome targets and including targets for the relevant mandatory indicators (e.g. bus user satisfaction, bus punctuality, mode share, cycling levels, traffic levels on particular routes, number of users of park-and-ride services).
3. Targets for contributory output indicators - indicators measuring the delivery of schemes, policies or initiatives that, in the opinion of the LTP authorities will contribute towards the achievement of targets in the two categories above.
4. Targets for any other outcome or output indicators - including indicators that measure the achievement of local priorities only”(21).
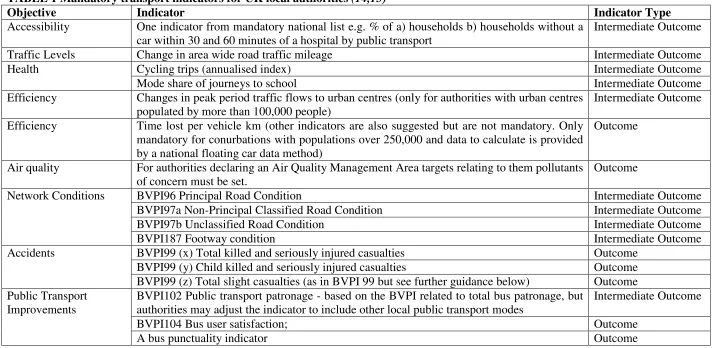
The guidance makes it clear that it is the key outcome indicators that will form the focus of the assessment. It also sets out a series of mandatory indicators that must be measured, these are shown in Table 1 along with the authors’ interpretation of the objectives to which the indicators are connected and the type of indicator (key or intermediate outcome). For the purposes of our assessment, we have assumed that key outcomes are focussed on end stages in the policy process such as improved health and increased efficiency. So, for example, the indicator relating to traffic levels could serve several key outcomes relating to network efficiency, emissions and safety but is not a policy aim of itself.
Insert Table 1 about here
indicators dominate the decision-making process(24). This section of the paper proposes a framework approach similar to the International Results Based Management literature described in (25,26),which links the key outcomes to the indicators we can measure to provide a clearer linkage between what we measure and why. It also links the indicators used with the five stages of the decision-making process identified at the start of the paper.
Policy Objectives to Key Outcomes
There are two basic classifications of strategy development “top-down” and “bottom up”. Top-down approaches rely on the setting of a series of policy objectives which the strategy is designed to achieve taking account of the key problems faced whilst bottom-up strategies focus on resolving identified problems (27). The UK typically promotes an objectives-led approach (www.webtag.org.uk). The DISTILLATE project took its objectives to be the achievement of the European Council of Ministers of Transport (ECMT) definition of sustainable transport (28) but the principle of the approach described should work whatever set of objectives is selected.
Key outcome indicators are selected as the most appropriate proxy indicators for the objectives set out. For example, the ECMT has an objective to limit emissions within the planets’ capacity to absorb them. This can be interpreted to have key outcome indicators relating to agreed international emission targets (e.g. Kyoto climate change (total CO2 emissions from transport), European Ceiling Limits on toxic pollutants (e.g.
total NOxemissions from transport).
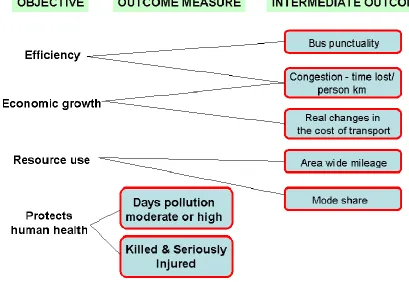
Key Outcomes to Intermediate Outcomes
Not all of the key outcomes identified are currently strongly attributable to transport interventions (such that other external effects might hide the benefits of transport interventions). There is therefore a need to work back from the key outcomes to intermediate outcomes.
is a matter of judgement and the decision should be taken in the light of the full set of indicators and an understanding of the costs of and other benefits from monitoring each indicator (Figure 4 being a simplified example).
Insert figure 3 about here
Insert figure 4 about here
USING INDICATORS
The previous section reviewed the process for picking outcome and intermediate outcome indicators. If the maximum value is to be extracted from a monitoring process then these indicators need to be used to inform the key stages of strategy development and implementation. This section reviews how indicators can be used to fulfil this integrated role.
Problem Identification
As set out earlier in the paper, indicators are a means of summarising the current position and the direction and rate of change of progress towards a particular goal or objective. “In order to form a complete part of the performance management cycle it is essential to know in what direction and how quickly the organisation would like the indicators to change (i.e. setting targets). It is this comparison of performance against goals that provides the stimulus for management intervention.” (7). Targets are therefore a statement of intent for the value of indicators at a particular point in the future. Target setting is therefore a separate but linked process to indicator selection. The first stage is to select robust indicators that are relevant to the organisational objectives, the second to select well-founded targets. Strategies for selecting well founded targets and the difficulties of so doing are reviewed in(20).
Strategy Development
What is the actual process of strategy development? Let us assume that a series of objectives have been identified and an indicator framework produced to reflect these objectives. The objective setting and problem identification process above will provide an indication of the key areas requiring intervention. A series of options have to be developed to be tested and a preferred strategy selected.
If there is to be integration between the monitoring framework and the strategies that are developed it is important for the options to be selected that are most likely to connect to the key indicators. One possible way this might work is through the use of knowledge bases such as KonSULT (http://konsult.leeds.ac.uk) or the TDM Encyclopaedia (www.vtpi.org/tdm), synthesis reports (e.g. NCHRP reports) or through professional experience. Policy initiatives are selected on the basis of their likelihood to impact on the key indicators (a fairly common sense assumption). This then forms the first basis for assembling alternative strategies.
The extent to which indicators influence scheme design will be highly dependent on the size and nature of the scheme (e.g. new road schemes, bus priority design (29)or the location of charging cordons(30)lend themselves to greater use of indicators than do small cycle lanes and commuter travel plans). There will inevitably be a degree of compromise between optimising scheme design to produce the best results for the indicators and the physical practicalities and political acceptability of implementing schemes.
Implementation
The success of a strategy should be judged by progress against the outcomes identified. At an operational level it is also essential to know to what extent any deviation from the expected outcomes is due to delivery issues compared with problems with the strategy itself. The monitoring of outputs (what is delivered) is therefore an important part of the process of self-assessment that delivery agencies are concerned with. It also forms part of the cost effectiveness assessment (what did we buy for our money). Figure 5 highlights the links between outputs and the outcome framework described above.
Insert Figure 5 about here
Operation
The growth in communication and data collection techniques allows for substantially enhanced real-time interventions in the operation of transportation systems. It also provides the opportunity for larger data sets to be collected more cost effectively for trend analysis to identify operational interventions. Examples include automated transport systems such as the SCOOT traffic signal control system and decisions on pollution management strategies (information provision levels, road closures etc.) linked to forecast air quality conditions. Space constraints preclude a more detailed discussion of these issues here but a number of NCHRP reports have examined these issues(e.g. 31).
CONCLUSIONS
There is an increased emphasis on performance management through the use of strategic outcome indicators. The greater linkage between financial settlements and performance against targets set for each indicator places the selection of these indicators under the microscope. The findings of a survey of a selection of UK authorities indicates that the move towards an outcome oriented approach to strategy assessment is broadly welcomed but that there are several issues that need to be addressed:
The outcome indicators are not typically derived from objectives fully consistent with a sustainable transport framework even if many of the indicators are relevant to such a framework
An annual reporting framework puts a greater emphasis on those indicators that demonstrate changes in the short-term whilst changes to land-use, local economic and health outcomes are all likely to occur over longer timescales.
There is difficulty in determining the relative importance of different indicators within the monitoring framework
The indicator sets do not correspond well to the public’s own experience of travel and therefore have a limited communication role.
range of key outcomes that could be considered. There is a series of principles that can be used to select good indicators and the development of a comprehensive strategy should, with appropriate techniques, give rise to well justified intermediate outcome indicators in place of key outcome indicators for which no suitable indicator can be identified. This we see as an intermediate step and not a replacement for a better understanding of the outcomes as stressed above.
The move towards greater accountability and the use of performance management in the public sector as an important part of this process is happening rapidly. We know from experience in other public sectors such as health and education that where the rationale for and processes underpinning aspects of the performance management framework lag behind its application that the frameworks can drive unintended and distorted outcomes. It is essential therefore that we fully integrate monitoring with strategy development and debate how this can best be achieved. The framework proposed here is currently being tested in a series of case studies in the UK but we look to share best practice with international partners to develop it further.
ACKNOWLEDGEMENTS
This work has been conducted as part of the DISTILLATE project funded as part of the EPSRC’s Sustainable Urban Environment programme. The authors are grateful to our colleagues on the project and our local authority, PTE and regional assembly partners.
REFERENCES
1. FHWA. Transportation Performance Measures in Australia, Canada, Japan, and New Zealand, International Scanning Study Team Report, US
Federal Highway Administration, 2004.
http://international.fhwa.dot.gov Accessed July, 20,2005
2. NCHRP. Strategic Planning and Decision Making in State Departments of Transportation: A Synthesis of Highway Practice, National Cooperative Highway Research Program Synthesis 326, Transportation Research Board, Washington D.C., 2004.
3. Kelly, C., and Snell, C. Improved indicators for Sustainable Transport and Planning, Working Paper Draft, Institute for Transport Studies and Stockholm Environment Institute – York, 2005.
4. Marsden, G. U.K. Moves Toward Transportation Funding Based on Performance,
The Urban Transportation Monitor,19(3), 3, February 18th., 2005.
5. Ott, W. R. Environmental Indices: Theory and Practice, Ann Arbour Science Publishers Inc, 1978.
6. Mitchell, G., May, A., and McDonald, A. PICABUE: a methodological framework for the development of indicators of sustainable development, International Journal of Sustainable Development and World Ecology 2, 1995, pp104-123.
7. Marsden, G., Kelly, C., Snell, C. And Forrester, J. Sustainable Transport Indicators: Selection and Use, DISTILLATE Deliverable C1 – draft, Institute for Transport Studies and Stockholm Environment Institute – York, 2005.
9. Audit Commission. Aiming to improve the principles of performance measurement, Management Paper, The Audit Commission, London, 2000.
10. Carlin, T. Output based management and the management of performance: insights from the Victoria Experience. Management Accounting Research 15, 2004 pp267-283
11. Fitz-Gibbon, C.T. Monitoring education: indicators, quality and effectiveness, London, Cassell. ISBN 0304330701 / 0304329835, 1996
12. PASTILLE Indicators into action: local sustainability indicator sets in their context. Final Report. Funded by the European Union 5th Research Framework
research programme, 2002.
http://www.lse.ac.uk/collections/PASTILLE/images/FinalReportWeb.pdf Accessed July 20, 2005
13. Audit Commission, Comprehensive Performance Indicators, www.audit-commission.gov.uk/cpa/Accessed July 20,2005
14. Department for Transport, Mandatory Local Transport Plan indicators,
www.dft.gov.uk/stellant/groups/dft_localtrans/documents/page/dft_localtrans_030 697.hcsp, Accessed July 20,2005
15. Office of the Deputy Prime Minister, Best Value Performance Indicators,
www.bvpi.gov.uk, Accessed July 20, 2005
16. Office of the Deputy Prime Minister, Regional Transport Strategy Indicators,
www.odpm.gov.uk, Accessed July 20,2005
17. DEFRA, UK Government Sustainable Development Strategy indicators,
http://www.sustainable-development.gov.uk/performance/indicators-home.htm
Accessed July 20,2005
18. Euronet, European Derived Indicator sets,
www.euronet.uwe.ac.uk/www/sustainable-cities.org/indicators/ECI%20report.pdf
Accessed July 20,2005
19. Tricker, R., and Hull, A. An assessment of the barriers to the delivery of sustainable local surface transport solutions. To be presented at European Transport Conference, Strasbourg October 2005.
20. Marsden, G., and Bonsall, P. The role of performance targets in transport policy, forthcoming in Transport Policy, 2005.
21. Department for Transport. Transport Plans: Second Addition – Full Guidance. 2004
22. Litman, T. Sustainable transportation indicators, Victoria Transport
Policy Institute, Victoria, Canada. 2003. http://www.vtpi.org/sus-indx.pdf
Accessed July 20,2005
23. Jeon, C.M., and Amekudzi, A. Addressing Sustainability in Transportation Systems: Definitions, Indicators, and Metrics, Journal of Infrastructure Systems, March, 31-50, 2005, ASCE.
24. Emberger G., May A.D., Shepherd S.P., and Sumalee, A. Method to Identify Optimal Land Use and Transport Policy Packages, Proc. of the 9th TRB Conference on the Application of Transportation Planning Methods, Louisiana, USA, 2003.
25. Canadian International Development Agency. RBM handbook on Developing Results Chains: the basis of RBM as applied to 100 project examples., 2000
26. United Nations Development Programme. Handbook on Monitoring and Evaluating Results. United Nations Development programme, Evaluation Office, New York., 2002
http://stone.undp.org/undpweb/eo/evalnet/docstore3/yellowbook/documents/full_d raft.pdfAccessed26/10/05
27. May, A.D. Transport Policy, In O’Flaherty (ed) Transport Planning and Traffic Engineering, Arnold, London, 1997, 42-76
28. ECMT. Strategy For Integrating Environment And Sustainable Development Into The Transport Policy adopted by the Ministers responsible for Transport and Communications at the 2340th meeting of the European Union’s Council of
Ministers, held in Luxembourg, April 4-5, 2001.
http://corporate.skynet.be/sustainablefreight/trans-counci-conclusion-05-04-01.htm.
29. McLeod, F., and Hounsell, N. Bus priority at traffic signals – evaluating strategy options,Journal of Public Transportation6(3), 2003 pp1-14
30. Sumalee, A. Optimal road user charging cordon design: a heuristic optimization approach, Computer-Aided Civil and Infrastructure Engineering, 19(5) , 2004 pp377-392
31. NCHRP Guide to Effective Freeway Performance Measurement, NCHRP Project Report 3-68, 2003. http://www4.trb.org/trb/crp.nsf/All+Projects/NCHRP+3-68
List of Tables and Figures
FIGURE 1 Importance and satisfaction ratings of indicator criteria FIGURE 2 Importance and satisfaction ratings of indicator criteria
TABLE 1 Mandatory transport indicators for UK local authorities(14,15)
FIGURE 3 Deciding on key and intermediate outcomes FIGURE 4 Rationalising the indicator set
Satisfaction Im p o rt a n c e Benchmarking Targets
Year on year improvement
Consistency (transport and planning)Consistency (transport and SD)
Consistency (LTP)
Consistency (RTS) Cost
Understood by politicians Understood by public
Forecasting/ modelling Measure
Public's experience
[image:18.595.74.489.69.467.2]Major scheme appraisal Very Important Fairly Important Not Important Not Satisfied Fairly Satisfied Very Satisfied
TABLE 1 Mandatory transport indicators for UK local authorities(14,15)
Objective Indicator Indicator Type
Accessibility One indicator from mandatory national list e.g. % of a) households b) households without a car within 30 and 60 minutes of a hospital by public transport
Intermediate Outcome
Traffic Levels Change in area wide road traffic mileage Intermediate Outcome
Health Cycling trips (annualised index) Intermediate Outcome
Mode share of journeys to school Intermediate Outcome
Efficiency Changes in peak period traffic flows to urban centres (only for authorities with urban centres populated by more than 100,000 people)
Intermediate Outcome
Efficiency Time lost per vehicle km (other indicators are also suggested but are not mandatory. Only mandatory for conurbations with populations over 250,000 and data to calculate is provided by a national floating car data method)
Outcome
Air quality For authorities declaring an Air Quality Management Area targets relating to them pollutants of concern must be set.
Outcome
Network Conditions BVPI96 Principal Road Condition Intermediate Outcome
BVPI97a Non-Principal Classified Road Condition Intermediate Outcome
BVPI97b Unclassified Road Condition Intermediate Outcome
BVPI187 Footway condition Intermediate Outcome
Accidents BVPI99 (x) Total killed and seriously injured casualties Outcome
BVPI99 (y) Child killed and seriously injured casualties Outcome
BVPI99 (z) Total slight casualties (as in BVPI 99 but see further guidance below) Outcome Public Transport
Improvements
BVPI102 Public transport patronage - based on the BVPI related to total bus patronage, but authorities may adjust the indicator to include other local public transport modes
Intermediate Outcome
BVPI104 Bus user satisfaction; Outcome