This is a repository copy of
Filter bank common spatial patterns in mental workload
estimation.
.
White Rose Research Online URL for this paper:
http://eprints.whiterose.ac.uk/97430/
Version: Accepted Version
Proceedings Paper:
Arvaneh, M., Umilta, A. and Robertson, I.H. (2015) Filter bank common spatial patterns in
mental workload estimation. In: Conf Proc IEEE Engineering in Medicine and Biology
Society. 37th Annual International Conference of the IEEE Engineering in Medicine and
Biology Society, 25-29 Aug. 2015, Milan. IEEE , pp. 4749-4752.
https://doi.org/10.1109/EMBC.2015.7319455
© 2015 IEEE. Personal use of this material is permitted. Permission from IEEE must be
obtained for all other users, including reprinting/ republishing this material for advertising or
promotional purposes, creating new collective works for resale or redistribution to servers
or lists, or reuse of any copyrighted components of this work in other works.
[email protected] https://eprints.whiterose.ac.uk/
Reuse
Unless indicated otherwise, fulltext items are protected by copyright with all rights reserved. The copyright exception in section 29 of the Copyright, Designs and Patents Act 1988 allows the making of a single copy solely for the purpose of non-commercial research or private study within the limits of fair dealing. The publisher or other rights-holder may allow further reproduction and re-use of this version - refer to the White Rose Research Online record for this item. Where records identify the publisher as the copyright holder, users can verify any specific terms of use on the publisher’s website.
Takedown
If you consider content in White Rose Research Online to be in breach of UK law, please notify us by
arXiv:1510.07263v1 [cs.HC] 25 Oct 2015
Filter Bank Common Spatial Patterns in Mental Workload Estimation
Mahnaz Arvaneh
1, Alberto Umilta
2, and Ian H. Robertson
1Abstract— EEG-based workload estimation technology pro-vides a real time means of assessing mental workload. Such technology can effectively enhance the performance of the human-machine interaction and the learning process. When designing workload estimation algorithms, a crucial signal processing component is the feature extraction step. Despite several studies on this field, the spatial properties of the EEG signals were mostly neglected. Since EEG inherently has a poor spacial resolution, features extracted individually from each EEG channel may not be sufficiently efficient. This problem becomes more pronounced when we use low-cost but convenient EEG sensors with limited stability which is the case in practical scenarios. To address this issue, in this paper, we introduce a filter bank common spatial patterns algorithm combined with a feature selection method to extract spatio-spectral features discriminating different mental workload levels. To evaluate the proposed algorithm, we carry out a comparative analysis between two representative types of working memory tasks using data recorded from an Emotiv EPOC headset which is a mobile low-cost EEG recording device. The experimental results showed that the proposed spatial filtering algorithm outper-formed the state-of-the algorithms in terms of the classification accuracy.
I. INTRODUCTION
Recent advances in sensor technologies and computa-tional algorithms make it possible to non-invasively monitor brain activities and mental states. In particular, real-time assessment of mental workload (MW) has attracted a lot of attentions. Assessing MW can be beneficial in applica-tions requiring high level of engagement, concentration and alertness such as aviation, driving, education and industrial production lines [1], [2].
In complex high demanding tasks, the human’s perfor-mance might drop due to the mental overload caused by excessive amount of information to be processed. In contrast, human tends to make errors when MW is kept in a lower level than the proper level due to getting bored. Thus, to achieve the best performance, the flow of the information and the complexity of the task should be controlled by correctly estimating the user’s MW [1], [2], [3]. In addition, a system that provides real-time feedback based on the detected MW might potentially enhance the cognitive performance and the learning process by encouraging the user to stay focused and engaged [4].
It is not still clear how to exactly define MW [5]. However, it is well accepted that MW is correlated with task demand,
*This work was supported by Science Foundation Ireland (SFI), under Grant No. 12/RC/2289.
1 M. Arvaneh and I. H. Robertson are with Trinity College Institute
of Neuroscience and Insight Centre for Data Analytics, Dublin, Ireland, (emails:arvanehm,[email protected])
2A. Umilta is with School of Psychology, University of Padova, Padova,
Italy, (email:[email protected]).
time pressure, person’s capacity and his/her performance [6]. Thus, in the existing studies, generally well-defined cognitive tasks were used in different difficulty and demand levels to manipulate a person’s MW level. Simultaneously, a range of different physiological signals were recorded for estimating the subject’s MW, such as pupil size, eye blink, skin con-ductance, electrocardiogram (ECG), and electroencephalo-gram (EEG). Interestingly, extensive comparisons reported by different research groups revealed that EEG is the most promising signal for estimating MW [7].
Studies that used EEG mostly achieved satisfactory results based on band power features [8], [9]. It is shown that theta (4-8Hz) and alpha (8-12Hz) are particularly sensitive to changes in MW [8], [9], [10]. Typically, theta in the frontal midline regions of the scalp increases as task demands increase [10], while alpha decreases in parietal regions when the workload increases [8], [9]. In addition to theta and alpha, MW can also influence other frequency bands (e.g. gamma and beta) in some subjects. Indeed, the exact locations and the frequency bands affected by MW vary between subjects and tasks [11], [12].
Despite several studies on the EEG-based estimation of MW, the spatial properties of the EEG signals were mostly neglected, and features were extracted from each channel individually. However, due to volume conduction, EEG has inherently a poor spatial resolution. Hence, applying proper spatial filters increases the signal to noise ratio, and possi-bly leads to a more accurate MW estimation. Importantly, the previous studies mostly relied on costly wired EEG equipments which require injecting gel on the scalp to have good quality signals. In order to use MW estimator tools in our daily life, they need to be utilized with dry/non-gel wireless EEG sensors with limited stability. Thus, the impact of applying proper spatial filtering algorithms could be even more pronounced in practical scenarios.
II. MATERIALS AND METHODS
A. Experimental design
In total, 6 young adults aged 19-33 years were partici-pated in this study. All the participants gave their informed consent to the study which had been reviewed and approved by the ethical review board of the School of Psychology, Trinity College Dublin, in accordance with the Declaration of Helsinki. The participants were asked to complete 4 sessions of a verbal n-back task and 4 sessions of a spatial n-back task. Each session consisted of three 2-min blocks (i.e. 0-back, 1-back and 2-back). After each block, the participants took a 12-15 seconds rest. They were also welcome to take a break at the end of each session, if they desired. Each block consisted of 60 trials, where each trial started by 500 ms presentation of the stimulus followed by 1500 ms inter stimulus interval.
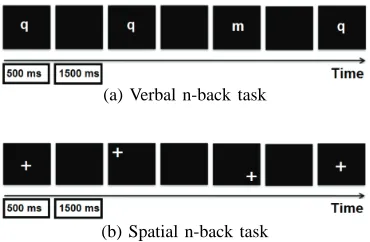
The verbal and the spatial n-back tasks performed in this study were similar to the tasks introduced in [9]. In each block of the verbal n-back task, a series of letters was randomly presented at the center of the screen (see Fig. 1.a). The participants were asked to remember the new letter and respond if it was the same as the letter presented n trials before. In total, 5 consonant English letters were used in the verbal task. In the spatial n-back task, a white cross was presented randomly in 5 different locations on the screen (see Fig. 1.b). Participants were asked to compare the current location of the cross to that occurred n trials before, and respond if they were same. In the 0-back blocks, the participants were only required to respond to those stimuli (i.e. letters/locations) that were the same as the one presented at the beginning of the block. In all the blocks, 20% of the stimuli were targets. To reduce the learning effects, before starting the test, the participants practiced until they reached the satisfactory performance.
(a) Verbal n-back task
[image:3.612.84.269.480.601.2](b) Spatial n-back task
Fig. 1: Graphical representation of the n-back tasks used in this study
B. EEG data acquisition
EEG was acquired using an Emotiv EPOC headset [14]. The Emotiv EPOC headset is completely wireless with 14 electrodes and 2 mastoid reference electrodes. In this study, we used 12 of the 14 available electrodes, namely F3, F4, F7, F8, FC5, FC6, T7, T8, P7, P8, O1, O2, as well as the two mastoid electrodes. Saline liquid was used to reduce
the impedance of the electrodes to a satisfactory level. The sampling rate was 128 Hz. The recorded EEG data were segmented to the intervals of 2, 4, and 6 s starting from the onset of the stimuli. The segments with amplitudes exceeding +75µV, or voltage steps of more than 150µV within a window of 200 ms were rejected from further analysis.
C. Proposed EEG-based mental workload estimator
FBCSP is extensively used in classification of EEG-based motor imagery data [13]. In this study, the FBCSP algorithm was used to extract spatio-spectral features discriminating the MW levels. Thereafter, a feature selection method was applied to select the most discriminative set of features. Finally, a naive bayesian classifier was used for classification. The details about the proposed MW estimation algorithm are as follows:
1) Multi-band spectral filtering: A filter bank was applied to decompose the EEG data into nine equal frequency bands, namely 4-8, 8-12, ..., 36-40 Hz. These frequency ranges cover all the commonly used frequency bands in the classification of MW.
2) Common spatial patterns (CSP): The EEG data from each frequency band were spatially filtered using the CSP filters [13]. Among various spatial filters, CSP has been highly successful in classification of two classes of EEG data [15]. CSP increases the discrimination between two classes by maximizing the variance of one class while the variance of the other class is minimized.
Let X∈ RNc×S denote a bandpass filtered single-trial
EEG data, whereNc andS are the number of channels and
the number of measurement samples respectively. The CSP transformation matrix, W ∈ RNc×Nc, linearly transforms
X as Z = WX. W is generally computed by solving the eigenvalue decomposition problem:
C1W= (C1+C2)WD, (1)
whereC1 andC2 are respectively the averaged covariance matrices of the bandpass filtered EEG data obtained from each class; D is the diagonal matrix that contains the eigenvalues of(C1+C2)−
1C
1. Usually, only the first and the last m rows of W are used as the most discriminative filters to perform spatial filtering [16].
3) Feature extraction: The spatio-spectrally filtered EEG data were used to determine the features associated to each band-pass frequency range. Based on the Ramoser formula [16], the features of thekth
trial of the EEG data belonging to each frequency band were calculated as
vk = log(diag(ZkZ
T
k)/trace[ZkZ
T
k]), (2)
where vk ∈R1×2m; diag(.) returns the diagonal elements
of the square matrix; and the superscript T denotes the transpose of the matrix. Since we have nine frequency bands, the total number of features for each trial was 9×2m. In this study, m was set to two.
n ranked features were used for classification. The value
n was chosen based on 10-fold cross-validation on the training data, such that the topnfeatures yielding the highest average cross-validation accuracy on the training data were selected as the most discriminative set of features for the MV classification.
III. RESULT
A. Behavioral performance
For the verbal and the spatial n-back tasks, we performed 3 (Difficulty: 0-back vs. 1-back vs. 2-back)×2 (Task: verbal vs. spatial) repeated ANOVA tests on both the error rates and the response times. We observed significant main effects of Difficulty on both the error rate (F(2,15) = 8.757, p = 0.006) and the response time (F(2,15) = 21.75, p <0.001). The response time increased by increasing the memory load with averages of 0.432s, 0.515s, 0.661s respectively for the verbal n-back task, and 0.433s, 0.515s, and 0.702s respectively for the spatial n-back task. Similarly, the error rate increased by increasing the difficulty with averages of 0.83%,1.5%,5.5% respectively for the verbal n-back task, and 0.17%, 1.17% and 4.83% respectively for the spatial n-back task. Neither Task nor the interaction between Task and Difficulty was significant. Post-hoc tests showed that the error rates and the response time were significantly different in all the difficulty levels. These results suggest that the tasks successfully induced three different MW levels in the participants.
B. Effects of spacial filtering and feature selection on MW estimation
To consider the effects of the proposed algorithm on the MW estimation, four different classification models were trained. The first model (abbreviated as FBCSP(FS)) was obtained based on the algorithm described in Section (II-C). Indeed, in this model, FBCSP was used to extract spatio-spectral features. Thereafter, the best set of features was selected using the proposed feature selection method. In the second model (abbreviated as FBCSP(AllF)), all the features obtained from FBCSP were used for classification (i.e. with-out any feature selection). In the third model (abbreviated as BP(AllF)), the band power features were obtained per each channel using the 9 frequency bands (i.e. 4-8, 8-12,..., 36-40 Hz) without applying any spacial filtering or feature selection algorithms. In fact, these 9 frequency bands are the same as those employed in FBCSP. BP(AllF) is similar to the models that are commonly used in MW estimation studies [8], [9]. In the last model (abbreviated as BP(FS)), using the proposed feature selection method, a subset of the band power features obtained from the third model was used for classification. For each n-back task, the first three sessions were used for training the classification models and the last session was used for evaluation. The results presented in this subsection are based on 2 seconds EEG intervals extracted from the onset of the stimuli.
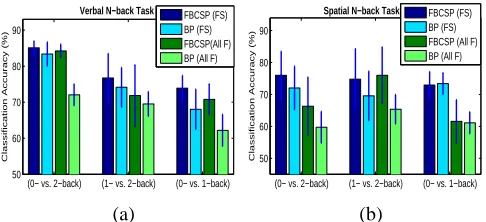
Fig. 2 shows the classification results of the four models under the three conditions for the verbal and the spatial
(0− vs. 2−back) (1− vs. 2−back) (0− vs. 1−back)
50 60 70 80 90
Verbal N−back Task
Classification Accuracy (%)
FBCSP (FS) BP (FS) FBCSP(All F) BP (All F)
(a)
(0− vs. 2−back) (1− vs. 2−back) (0− vs. 1−back)
50 60 70 80 90
Classification Accuracy (%)
Spatial N−back Task FBCSP (FS)
BP (FS) FBCSP (All F) BP (All F)
[image:4.612.312.555.55.166.2](b)
Fig. 2: Average classification accuracies of (a) verbal and (b) spatial n-back tasks obtained using 4 different models. The window size is 2 sec. BP, All F and SF denote the band power features, all the features, and the selected features respectively.
n-back tasks. All the four models achieved the classifica-tion accuracies above the chance level. This confirms the satisfactory quality of the EEG signals recorded by the Emotiv EPOC headset. As shown in Fig. 2, on average FBCSP(FS) outperformed all the other models, whereas the BP(AllF) performed the worst. Performing 4 (Models)×3
(Difficulty: 0-back vs. 1-back vs. 2-back) repeated ANOVA tests revealed significant main effects of the models in the letter (F(3,15) = 11.35, P = 0.001) and the spatial (F(3,15) = 4.86, p = 0.04) n-back tasks, respectively. A close to significant main effect of Difficulty was also observed in the letter n-back task (F(2,10) = 4.06, p = 0.051). Importantly, Post-hoc tests showed that the proposed FBCSP(FS) algorithm significantly performed better than the BP(AllF) algorithm which is commonly used in MW estimation.
Fig. 2.a shows that in the verbal task the low MW (i.e. 0-back) was separated from the high MW (2-back) with the highest average accuracy, while the classification between the low MW (i.e. 0-back) vs. the medium MW was (i.e. 1-back) the least accurate among the other conditions. Paired t-tests showed that the classification results of the proposed FBCSP(FS) were significantly different between the (0- vs. 2-back) and (0- vs. 1-back) conditions (p=0.03). Unlike the verbal n-back task, in the spatial n-back task the classification accuracies of the proposed FBCSP(FS) are closer over the three conditions, although still the highest accuracy obtained in the classification of 0- vs. 2-back.
C. Effects of EEG window size
accuracy (F(2,10) = 0.34, p= 0.72). It should be noted that longer window size means higher chance of having blinks or muscle artifacts. Thus, due to artifact rejection, increasing the window size leads to a smaller number of trials left for training. This might negatively affect the results as the accurate estimation of the CSP matrix is associated with the training size [16]. Considering this issue, in future it should be further investigated why increasing the window size did not bring a large advantage for the verbal n-back task.
1 2 3
72 74 76 78 80 82 84 86
Window Size (sec)
Classification Accuracy (%)
Verbal N−back Task
0− vs. 2−back 1− vs. 2−back
0− vs. 1−back
2 4 6
72 74 76 78 80 82
Window Size (sec)
Classification Accuracy (%)
Spatial N−back Task
0− vs. 2−back
1− vs. 2−back
[image:5.612.56.295.176.277.2]0− vs. 1−back
Fig. 3:Average classification accuracy of the proposed FBCSP(FS) algorithm as a function of window size, for (a) the verbal and (b) the spatial n-back tasks.
D. Spatial filters in different frequency bands
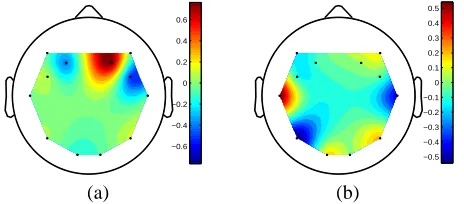
To better understand why the proposed algorithm im-proved the classification results, two spatial filters obtained for one of the subjects were presented in Fig. 4. The spatial filters were trained in order to get an optimum discrimination between 0- and 2-back conditions in the letter task. As shown in Fig. 4, the spatial filter obtained for the theta rhythm (4-8 Hz) gives more weights to the frontal electrodes, while attenuates the effects of the other channels. In the same line, the spatial filter obtained for the alpha rhythm (8-12 Hz) is more focused on the temporal and parietal electrodes, while the effects of the other channels are mitigated. Thus, by adding spatial filters to the MW classification algorithms, the effects of irrelevant and redundant channels that might be different from band to band are attenuated, and more neurophysiologically relevant features are extracted.
−0.6 −0.4 −0.2 0 0.2 0.4 0.6
(a)
−0.5 −0.4 −0.3 −0.2 −0.1 0 0.1 0.2 0.3 0.4 0.5
(b)
Fig. 4:Spatial filters obtained for (a) theta and (b) alpha frequency bands in the verbal n-back task, for one subject.
IV. CONCLUSIONS
To create a classification model that accurately estimates mental workload in practical scenarios, the reliability of the
system should be evaluated using convenient low-cost EEG sensors with limited stability. In such a noisy environment, using spatial filters could be crucial in improving signal to noise ratio. To address these issues, we introduced a filter bank common spatial patterns algorithm combined with a feature selection method to extract spatio-spectral features discriminating different mental workloads. We compared 2 representative working memory tasks: the verbal and the spatial n-back tasks using data collected from Emotiv EPOC, a widely used wireless EEG headset. Our experimental results showed that the proposed spatio-spectral features outperformed the state-of-the art algorithms in classification of different workload conditions in both tasks. The results also showed that spatial filters could improve the accuracy of the MW classification algorithms by attenuating the effects of irrelevant and redundant channels, and enhancing the influence of the neurophysiologically relevant channels.
REFERENCES
[1] T. O. Zander, C. Kothe, S. Jatzev, and M. Gaertner, ”Enhancing human-computer interaction with input from active and passive brain-computer interfaces,” Brain-Computer Interfaces, Springer London, 2010, pp. 181-199.
[2] D. B. Kaber, E. Onal, and M. R. Endsley, ”Design of automation for telerobots and the effect on performance, operator situation aware-ness, and subjective workload,” Human Factors and Ergonomics in
Manufacturing, vol. 10, no. 4, pp. 40930, 2000.
[3] G. F. Wilson, and C. A. Russell, ”Operator functional state classi-fication using multiple psychophysiological features in an air traffic control task,” Human Factors: The Journal of the Human Factors and
Ergonomics Society, vol. 45, no. 3, pp. 381-389, 2003.
[4] A. Holm, K. Lukander, J. Korpela, M. Sallinen, and K. M. I. M¨uller, ”Estimating brain load from the EEG,” The Scientific World Journal, vol. 9, pp. 639-651, 2009.
[5] De Jong, T. ”Cognitive load theory, educational research, and instruc-tional design: some food for thought,” Instrucinstruc-tional Science, vol. 38, no. 2, 105-134, 2010.
[6] F. G. Paas, J. J. Van Merri¨enboer, and J. J. Adam, ”Measurement of cognitive load in instructional research,” Perceptual and motor skills, vol. 79, no. 1, pp. 419-430, 1994.
[7] M. A. Hogervorst, A. M. Brouwer, and J. B. van Erp, ”Combining and comparing EEG, peripheral physiology and eye-related measures for the assessment of mental workload,” Frontiers in neuroscience, vol. 8, 2014.
[8] A. M. Brouwer et al., ”Estimating workload using EEG spectral power and ERPs in the n-back task,” Journal of Neural Engineering, vol. 9, no. 4, 2010.
[9] D. Grimes et al, ”Feasibility and pragmatics of classifying working memory load with an electroencephalograph,” in SIGCHI Conference
on Human Factors in Computing Systems, April 2008, pp. 835-844.
[10] J. Onton, A. Delorme, and S. Makeig, ”Frontal midline dynamics during working memory,” Neuroimage, vol. 27, pp. 341-356, 2005. [11] J. B. Brookings, G. F. Wilson, and C. R. Swain, ”Psychophysiological
responses to changes in workload during simulated air traffic control,”
Biol. Psychol. vol. 42, pp.36177, 1996.
[12] M. W. Howard et al., ”Gamma oscillations correlate with working memory load in humans,” Cerebral Cortex, vol. 13, pp. 1369-74, 2003. [13] K. K. Ang, Z. Y. Chin, H. Zhang, and C. Guan, ”Mutual information-based selection of optimal spatial-temporal patterns for single-trial EEG-based BCIs,” Pattern Recognition, vol. 45, no. 6, pp. 2137-44, 2012.
[14] EmotivSystems. Emotiv - brain computer interface technology. http://emotiv.com.
[15] B. Blankertz, R. Tomioka, S. Lemm, M. Kawanabe, and K. R. M¨uller, ”Optimizing spatial filters for robust EEG single-trial analysis,” IEEE
Signal Process. Mag., vol. 25, no. 1, pp. 41-56, 2008.
[16] H. Ramoser, J. M¨uller-Gerking, and G. Pfurtscheller, ”Optimal spatial filtering of single trial EEG during imagined hand movement,” IEEE
[image:5.612.65.297.549.651.2]