R E S E A R C H
Open Access
Analysis of codon usage pattern in
Taenia
saginata
based on a transcriptome dataset
Xing Yang
1,2, Xuenong Luo
1and Xuepeng Cai
1,2*Abstract
Background:Codon usage bias is an important evolutionary feature in a genome and has been widely documented in many genomes. Analysis of codon usage bias has significance for mRNA translation, design of transgenes, new gene discovery, and studies of molecular biology and evolution, etc. However, the information about synonymous codon usage pattern ofT. saginatagenome remains unclear.T. saginatais a food-borne zoonotic cestode which infects approximataely 50 million humans worldwide, and causes significant health problems to the host and considerable socio-economic losses as a consequence. In this study, synonymous codon usage inT. saginatawere examined.
Methods:Total RNA was isolated fromT. saginatacysticerci and 91,487 unigenes were generated using Illumina sequencing technology. After filtering, the final sequence collection containing 11,399 CDSs was used for our analysis.
Results:Neutrality analysis showed that theT. saginatahad a wide GC3 distribution and a significant correlation was observed between GC12 and GC3. NC-plot showed most of genes on or close to the expected curve, but only a few points with low-ENC values were below it, suggesting that mutational bias plays a major role in shaping codon usage. The Parity Rule 2 plot (PR2) analysis showed that GC and AT were not used proportionally. We also identified twenty-three optimal codons in theT. saginatagenome, all of which were ended with a G or C residue. These results suggest that mutational and selection forces are probably driving factors of codon usage bias in T. saginatagenome. Meanwhile, other factors such as protein length, gene expression, GC content of genes, the hydropathicity of each protein also influence codon usage.
Conclusions:Here, we systematically analyzed the codon usage pattern and identified factors shaping in codon usage bias inT. saginata.Currently, no complete nuclear genome is available for codon usage analysis at the genome level inT. saginata. This is the first report to investigate codon biology inT. sagninata. Such information does not only bring about a new perspective for understanding the mechanisms of biased usage of synonymous codons but also provide useful clues for molecular genetic engineering and evolutionary studies.
Keywords:Taenia saginata, Codon usage bias, Trancriptome, Optimal codon
Background
Codon usage bias (CUB) refers to the phenomenon where synonymous codons are not used with equal frequencies during translation of genes. CUB is a common phenomenon in a wide variety of organisms, including prokaryotes and eukaryotes [1-3]. Many factors have been reported to in-fluence codon usage in various organisms. Weak natural selection and mutational pressure are thought to be the
main factors that account for the codon usage variation among the genes in these organisms [4]. Genome-wide in-vestigations of codon usage patterns has an immense im-portance in understanding the basic features of molecular organization of a genome. In addition, analysis of CUB has many other important applied aspects, such as heter-ologous gene expression [5], the determining of the ori-gins of species [6], the design of degenerate primers [7], the prediction of expression level of genes [8,9], as well as the prediction of gene functions [10]. However, most of nu-merous reports on CUB have focused on model organisms and many microorganisms, such asCaenorhabditis, Dros-ophila, Arabidopsis[11], yeast[12], Giardia lamblia[13], * Correspondence:[email protected]
1
State Key Laboratory of Veterinary Etiological Biology, Lanzhou Veterinary Research Institute, Chinese Academy of Agricultural Sciences, Lanzhou 730046, PR China
2College of Veterinary Medicine, Jilin University, Changchun 130000, PR
China
Entamoeba histolytica [14], Streptomyces [15], Borrelia burgdorferi [16], and Saccharomyces cerevisiae [17]. For example, inC. elegansit is observed that most favored co-dons are ended with G and/or C (majority are C ending) [18]. In contrast, there are few studies on tapeworms.T. saginata is an important parasitic tapeworm which is widely distributed in the world [19]. The adult worms mainly parasitize in the small intestines of humans [20,21]. T. saginatacan cause great economic losses and endangers public health [22,23]. However, the information about syn-onymous codon usage pattern ofT. saginataremains un-clear. In this study, we investigated the codon usage profile ofT. saginatathrough transcriptome data using a multi-variate statistical analysis. Analysis of codon usage pattern inT. saginatawould provide a basis for understanding the related mechanism for biased usage of synonymous co-dons and for choosing appropriate host expression systems for an optimized expression of target genes.
Methods Ethics statement
This study was approved by the Animal Ethics Committee of Lanzhou Veterinary Research Institute, Chinese Academy of Agricultural Sciences (Approval No. LVRIAEC2009-2012). The cattle from which Taenia saginata cysticerci were collected for transcriptome sequencing, were handled in accordance with good animal practices required by the Animal Ethics Procedures and Guidelines of the People's Republic of China.
RNA extraction, cDNA library preparation and Illumina sequencing
Total RNA was extracted from cysticerci using the Trizol reagent (Invitrogen, Carlsbad,CA), following the manufac-turer’s instructions. The quantity and quality of total RNA was analyzed using Agilent 2100 RNA Nanochip (Agilent, Santa Clara, CA, USA) and gel electrophoresis. A total of 16.1 μg of RNA was pooled for the preparation of the cDNA library.
The OligoTex mRNA mini kit (Qiagen) was used to poly-T+ RNA after total RNA was collected according to the manufacturer’s protocol. The mRNA was mixed with fragmentation buffer and fragmented into short fragments. cDNA was synthesized using the mRNA fragments as templates. Short fragment (200 ± 25 bp) were gel extracted from an agarose gel and PCR amplified for 15 cycles. Finally, the library was sequenced using the Illumina HiSeq 2000 sequencer (Beijing Genomics Institute, BGI, Shenzhen, Guangdong, China).
De novoassembly
Using Solexa/Illumina RNA-seq deep sequencing tech-nology, we obtained a total of 55.49 million raw reads (4.99 Gb). Further, raw reads were filtered to remove the
low-quality reads. The filtration steps were as follows: 1) remove adaptor sequence; 2) remove reads containing the unknown nucleotide“N”over 10%; 3) remove low quality reads containing more than 10 bases with Q-value≤20. Then, the remaining high-quality reads were used for fur-ther analysis. Transcriptome raw reads dataset has been submitted to the NCBI (http://www.ncbi.nlm.nih.gov/ bioproject/PRJNA260140).
Sequence data
In this study, a total of 91,487T. saginataunigenes were obtained. Based on a sequence similarity with known pro-teins, a total of 59,262 unigenes were annotated. Up to 57,607 of which were annotated against the NCBI non-redundant (Nr) protein database, 24,860 were assigned to the protein database Clusters of Orthologous Groups (COG), 26,476 were assigned to the term annotation data-base of Gene Ontology (GO), and 43,575 were assigned to 200 pathways in the database of Kyoto Encyclopedia of Genes and Genomes (KEGG). Among the annotated uni-genes, 61,941 coding sequences (CDS) were obtained by the BLASTx algorithm [24]. All CDSs were analyzed using the FrameDP software [25], which has the ability to self-train directly on EST clusters instead of requiring curated cDNA sets to train the underlying ESTScan and DE-CODER software [26].
To minimise the sampling error, only CDS sequences longer than 300 bp were used for this study. The final sequence collection containing 11,399 CDSs was used for our analyses.
Indices of codon usage
Codon usage in these genes was assessed using the pro-gram codonW 1.4.4 (J Peden, http://codonw.sourceforge. net). Relative synonymous codon usage (RSCU) is the ob-served frequency of a codon divided by the frequency ex-pected, if all synonyms for that amino acid were used equally [27]. Thus, RSCU values close to 1.0 indicate lack of bias whereas values more than 1 indicates that a codon was used more frequently than expected, while the con-verse is true for RSCU values less than 1. The effective number of codons (ENC) method was used to quantify the absolute codon usage bias of a CDS [28]. The values of ENC range from 20 (when only one codon is used per amino acid) to 61 (when all codons are used in equal prob-ability). The predicted values of ENC were calculated as
ENC¼2þsþ 29
s2þð1−s2Þ
where s represents the given (G + C)3% value [28].
RSCU values were calculated according to the formula of previous reports [27].
RSCU¼ gij
Xni
j
gij nj
where gij is the observed number of the ith codon for jth amino acid which hasnitype of synonymous codons.
The codon with RSCU value more than 1.0 has positive codon usage bias, while the value <1.0 has relative nega-tive codon usage bias. When RSCU value is equal to 1.0, it means that this codon is chosen equally and randomly.
The GC content of first, second and third codon pos-ition (GC1, GC2 and GC3 respectively) were then calcu-lated. GC12 is the average of GC 1 and GC2, and was used for analysis of neutrality plots (GC12vsGC3) [29]. The codon adaptation index (CAI) was used to estimate the extent of bias toward codons that were known to be preferred in highly expressed genes. A CAI value is between 0 and 1.0, and a higher value means a likely stronger codon usage bias and a potential higher expression level [30].
Correspondence analysis(CA)
Correspondence analysis (CA) has been widely used to explore codon usage variation among genes. CA is a so-phisticated multivariate statistical technique in which the codon usage data (59 codons) are plotted in a multi-dimensional space of 59 axes (excluding Met, Trp and stop codons) and then it identifies the axes which repre-sent the most prominent factors contributing to variation among genes [31,32].
Determination of optimal codons
We selected 5% of the total genes with extremely high and low CAI values which were regarded as the high and low expression genes datasets, respectively. Codon usage was compared using Chi squared contingency test of the two groups, and codons whose frequency of usage were significantly higher (P < 0.01) in highly expressed genes than in genes with low level of expression would be defined as the optimal codons [33].
Statistical analysis
CodonW 1.4.4 software was used to analyze the indices of codon usage. Correlation analysis was carried out using the Spearman’s rank correlation analysis method wrapped in the multianalysis software SPSS version 19.0.
Results
Codon usage inT. saginata
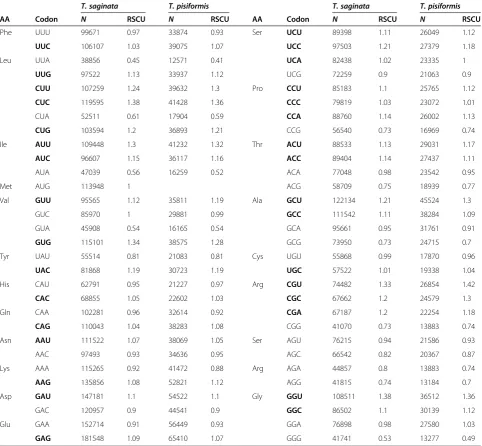
The pattern of synonymous codon usage in theT. saginata has been shown in Table 1. The genomic G + C content for T. saginata is 43.61%. Although the genome would thus
appear to be slightly A + T rich, overall codon usage is biased toward C- and G-ending codons (32 codons were frequently used codons, 18/32 of the frequently used co-dons end with G or C), suggesting the compositional con-straints are not the most important factor in shaping the codon usage variation among the genes.
In general, the pattern of codon usage is similar among closely related organisms, but differs significantly among distantly related species, such asEscherichia coli, Saccha-romyces cerevisiae and Drosophila melanogaster [34]. In this study, patterns of codon usage are compared in T. saginata and T. pisiformis (Table 1) [35], and we found that there are high similarities between them. With the ex-ception of UCA and GGA, the two species have the same preferred codon for all amino acids.
Nucleotide content of genes
The GC content of the T. saginata genes varied from 31% to 80.2% with a standard deviation(SD) of 3.67. The GC content of 11399 genes were mainly distributed be-tween 45% and 55% (Figure 1), this distribution pattern of genes is very similar toT. pisiformis[35]. To under-stand the nucleotide distribution, we concatenated all genes to one sequence, which comprised 532,4389 codons. The GC content in 3 codon positions (GC1, GC2, and GC3) was 0.534, 0.439, and 0.535, respectively. This ana-lysis showed that the GC content at second position is dif-ferent from the GC content at the first and third position. GC1 was extremely close to GC3, and GC2 was the lowest of all 3 codon positions. The average GC content of all co-dons was 0.503.
Neutrality analysis is a useful way to revealing the rela-tionship between GC12 and GC3 and then examining the mutation-selection equilibrium in shaping the CUB. In neutrality plot, if the correlation between GC12 and GC3 is statistically significant and the slope of the regression line is close to 1, mutation bias is assumed to be the main force shaping codon usage. Conversely, selection against mutation bias can cause a narrow distribution of GC con-tent and no correlation between GC12 and GC3 [29,36]. To analyze relations among the three codon positions, neutrality plots (GC12 versus GC3) were performed forT. saginata. It was observed that T. saginata genes had a wide range of GC3s (0.7 to 98.40) and there is a significant correlation between GC12 and GC3 (r = 0.123, p <0.01) (Figure 2), suggesting mutation and selection are probably both acting to codon usage bias inT. saginatagenome. In addition, the significantly positive correlation in neutrality plots indicated intragenomic GC mutation bias affects the GC content at all codon positions in a similar manner.
Relation between ENC and GC3
of ENC were plotted against the fraction of GC at the third codon position (GC3s) (Figure 3) [28]. The ENC values of different genes ranged from 21.0 to 61, indicat-ing that there are significant differences in codon bias among these genes. From Figure 3 it is obvious that a very considerable proportion of points lies near to the expected curve, which indicates that ENCs of most genes were close to the expected values based on their GC3s. Meanwhile, there are also some points with low ENC lying below the expected curve suggesting these genes have additional codon usage bias that is inde-pendent of GC3s. To obtain a more accurate estimate for the difference observed and expected ENC values, we calculated (ENCexp-ENCobs)/ENCexp. The frequency
distributions of (ENCexp-ENCobs)/ENCexp are shown in Figure 4. Interestingly, the peak located in 0–0.05 of (ENCexp-ENCobs)/ENCexp value and most genes have−0.05-0.1 of (ENCexp-ENCobs)/ENCexp values indi-cating that most genes have ENCs slightly difference with expected ENC values from their GC3s. These results sug-gest that most genes have observed ENCs close to the ex-pected ENC based on GC3s, though a significant number has much lower observed ENCs.
Correspondence analysis
[image:4.595.57.540.101.547.2]In this thesis, we further investigate the synonymous codon usage variation among genes of T. saginata by correspondence analysis in RSCU. The first two axes
Table 1 Codon usage inT. saginata and T. pisiformis
T. saginata T. pisiformis T. saginata T. pisiformis
AA Codon N RSCU N RSCU AA Codon N RSCU N RSCU
Phe UUU 99671 0.97 33874 0.93 Ser UCU 89398 1.11 26049 1.12
UUC 106107 1.03 39075 1.07 UCC 97503 1.21 27379 1.18
Leu UUA 38856 0.45 12571 0.41 UCA 82438 1.02 23335 1
UUG 97522 1.13 33937 1.12 UCG 72259 0.9 21063 0.9
CUU 107259 1.24 39632 1.3 Pro CCU 85183 1.1 25765 1.12
CUC 119595 1.38 41428 1.36 CCC 79819 1.03 23072 1.01
CUA 52511 0.61 17904 0.59 CCA 88760 1.14 26002 1.13
CUG 103594 1.2 36893 1.21 CCG 56540 0.73 16969 0.74
Ile AUU 109448 1.3 41232 1.32 Thr ACU 88533 1.13 29031 1.17
AUC 96607 1.15 36117 1.16 ACC 89404 1.14 27437 1.11
AUA 47039 0.56 16259 0.52 ACA 77048 0.98 23542 0.95
Met AUG 113948 1 ACG 58709 0.75 18939 0.77
Val GUU 95565 1.12 35811 1.19 Ala GCU 122134 1.21 45524 1.3
GUC 85970 1 29881 0.99 GCC 111542 1.11 38284 1.09
GUA 45908 0.54 16165 0.54 GCA 95661 0.95 31761 0.91
GUG 115101 1.34 38575 1.28 GCG 73950 0.73 24715 0.7
Tyr UAU 55514 0.81 21083 0.81 Cys UGU 55868 0.99 17870 0.96
UAC 81868 1.19 30723 1.19 UGC 57522 1.01 19338 1.04
His CAU 62791 0.95 21227 0.97 Arg CGU 74482 1.33 26854 1.42
CAC 68855 1.05 22602 1.03 CGC 67662 1.2 24579 1.3
Gln CAA 102281 0.96 32614 0.92 CGA 67187 1.2 22254 1.18
CAG 110043 1.04 38283 1.08 CGG 41070 0.73 13883 0.74
Asn AAU 111522 1.07 38069 1.05 Ser AGU 76215 0.94 21586 0.93
AAC 97493 0.93 34636 0.95 AGC 66542 0.82 20367 0.87
Lys AAA 115265 0.92 41472 0.88 Arg AGA 44857 0.8 13883 0.74
AAG 135856 1.08 52821 1.12 AGG 41815 0.74 13184 0.7
Asp GAU 147181 1.1 54522 1.1 Gly GGU 108511 1.38 36512 1.36
GAC 120957 0.9 44541 0.9 GGC 86502 1.1 30139 1.12
Glu GAA 152714 0.91 56449 0.93 GGA 76898 0.98 27580 1.03
GAG 181548 1.09 65410 1.07 GGG 41741 0.53 13277 0.49
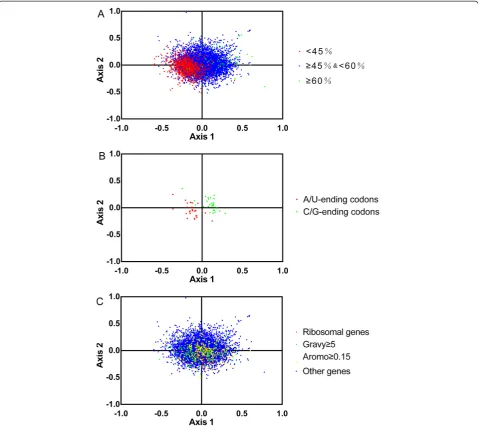
explain low fractions of the total variation(6.6%and 4.9%, respectively), and the next two axes accounts for 4.1% and 3.3%, respectively. The plot of the first and second axis of each gene is shown in Figure 5A. The distance between genes on the plot is a reflection of their diver-sity in RSCU. To investigate the effect of GC content of genes on codon usage bias, different GC contents of genes are color coded. The genes, GC content of which is more than or equal to 60%, are plotted in green, and less than 45% is plotted in red. Blue dots indicate the genes which the GC content is between 45 and 60%. In Figure 5A, the high and low GC content of genes separ-ate along the primary axis. Correspondence analysis shows the distribution of genes in the multidimensional space, and also shows the corresponding distribution of synonymous codons (Figure 5B). Figure 5B shows the separation of different bases ending codons along the two axes. The separation of codons on the first axis ap-pears to be largely due to frequency differences in G/C and A/T ending codons. Further calculations revealed a significant correlation (r = 0.6573, P <0.0001) between
the GC content of individual genes and their positions on the first axis. In addition, the gene positions on axis 1 were strongly correlated with the GC3s value (r = 0.8253, P <0.0001) and significantly negatively correlated with ENC (r =−0.2322, P <0.0001). From the above results, we found that genes with higher GC and GC3s content values and lower ENC values, which located at the left side of the first axis, indicated a stronger codon bias. This proved that the major factor influencing the codon usage bias among Taenia saginata genes was the nucleotide composition of the genes.
[image:5.595.57.293.89.248.2]In order to analyze the codon usage of different kinds of gene, we selected the hydrophobic genes with gene scores >5, the aromatic genes with gene scores ≥0.15, ribosomal genes and other genes from 11399 genes. The distribution of the four types of genes were shown in
[image:5.595.304.539.89.247.2]Figure 1The distribution of G + C contents inTaenia saginatagenes.
Figure 2Neutrality plots (GC12 vs GC3s).
[image:5.595.306.540.517.704.2]Figure 3Distribution of effective number of codons (ENC) and GC3s ofTaenia saginatagenes.The solid line (shown in green) indicates the expected ENC value if the codon bias is only due to GC3s.
[image:5.595.57.293.556.718.2]Figure 5C. We employed a multivariate analysis of vari-ance (MANOVA) and found that there was a statistically significant difference among four types of genes in codon usage (p < 0.01).
PR-bias plot
If mutation bias is the cause of codon bias, GC or AT should be used proportionally among the degenerate codon groups in a gene. In contrast, natural selection for codon choice would not necessarily cause proportional use of G and C (A and T) [37]. To investigate whether
[image:6.595.59.538.89.515.2]these biased codon choices are restricted in highly biased genes, the relation between G and C content and between A and T content in four-fold degenerate codon families were analyzed by PR2 bias plot (Figure 6). The four-codon amino acids are alanine, arginine (CGA, CGT, CGG, CGC), glycine, leucine (CTA, CTT, CTG, CTC), proline, serine (TCA, TCT, TCG, TCC), threo-nine, and valine. Our results showed that C and T were used more frequently than G and A inT. saginata. This observation indicated that both mutation bias and other factors (eg. selection) contribute to codon bias.
Gene expression level and synonymous codon usage bias Codon adaptation index (CAI) has been extensively used as a predictor of gene expression level [8,9]. The set of reference sequences used for calculating CAI values in this study are genes that encode ribosomal proteins. The expression level of genes of T. saginata was assessed through CAI values, which varied from 0.055 to 0.952 with a mean value of 0.22 and a standard deviation of 0.03504. It was found that there was a significantly nega-tive correlation between the gene expression level assessed by CAI value and ENC values (r =−0.1808 and p < 0.0001) (Figure 7), and three significantly positive correlations between CAI value and GC3s, GC content and the positions of genes along axis 1 (r = 0.2437, 0.1009 and 0.4211, respectively, P < 0.0001). The results indicated that the genes with higher expression level had a greater degree of codon usage bias and prefer the co-dons with C or G at the synonymous position.
Protein length and synonymous codon usage bias The results of correlation analyses between protein length and axis 1 coordinates, ENC and CAI values showed that the 3 correlation coefficients (r=−0.1163, 0.1433 and −0.081, respectively,P< 0.01) all significantly correlated (Figure 8), which suggested a general tendency of more biased genes with shorter length to have higher expression level.
Effect of the hydrophobicity and aromaticity of encoded protein on codon bias
Numerous studies have shown that hydrophobicity and aromaticity of encoded protein play important roles in shaping codon usage of some species. In order to investi-gate if the same thing is happening toT. saginata,we per-formed a correlation analysis to evaluate whether Gravy and Aromo values were related to ENC values. The correl-ation analyses between the hydrophobicity of each protein and ENC value showed that the correlation coefficients (r =−0.0883, P <0.001) were significantly correlated. The aromaticity of each protein was not significantly correlated with ENC (r =0.0097, P > 0.05). The analysis results indi-cated that variation in codon usage were associated with the degree of hydrophobicity, but not with the aromatic amino acids .
Optimal codons
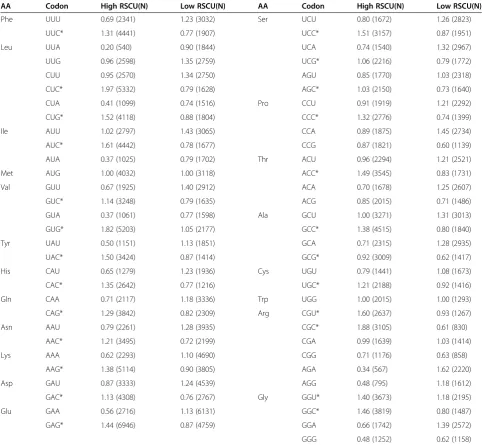
[image:7.595.56.290.89.250.2]The average RSCU values of high/low expressed gene sam-ple group are listed in Table 2. Twenty-three codons were determined to be the optimal codons, which were sig-nificantly more frequent among the highly expressed genes (P <0.01) according to the chi-square test. Almost all of optimal codons (except GGU and CGU) ended with G or C, indicating that codon usage inT. saginata was biased to G- or C-ending synonymous codons.
Figure 6PR2-bias plot [A3/(A3 + T3) against G3/(G3 + C3)].Red open circle indicate the average position for each plot. Average position is x = 0.4384 ± 0.09663, y = 0.438562 ± 0.09486.
Figure 7Plot of ENC versus gene expression level for
[image:7.595.58.290.547.705.2] [image:7.595.306.539.558.715.2]Discussion
Codon usage bias is an important and complex evolution-ary phenomenon, and it exists in a wide variety of organ-isms, from prokaryotes, to unicellular and multicellular eukaryotes. Some hypotheses are proposed to explain the origin of codon usage bias, among which neutral theory [38] and the selection-mutation-drift balance model [27,39] are the most representative ones. According to neutral theory, mutations at degenerate coding positions should be selectively neutral, thus resulting in random synonymous codon choice. In the selection-mutation-drift
[image:8.595.56.539.101.546.2]model, codon bias is thought to be determined by a bal-ance between mutation pressure, genetic drift, and weak selection. In other words, if a gene experiences a highly se-lective pressure, such as high expression, it may be in-clined to stronger codon usage bias. However, in recent years, with the completion of genome projects of many or-ganisms, the two hypotheses are not sufficient to explain codon usage anymore. Many other factors have been reported to influence CUB, including gene length [11], GC-content [40,41], recombination rate [40,42,43], gene expression level [11,18,42], RNA structure [44-46], protein
Table 2 Translational optimal codons ofT. saginata
AA Codon High RSCU(N) Low RSCU(N) AA Codon High RSCU(N) Low RSCU(N)
Phe UUU 0.69 (2341) 1.23 (3032) Ser UCU 0.80 (1672) 1.26 (2823)
UUC* 1.31 (4441) 0.77 (1907) UCC* 1.51 (3157) 0.87 (1951)
Leu UUA 0.20 (540) 0.90 (1844) UCA 0.74 (1540) 1.32 (2967)
UUG 0.96 (2598) 1.35 (2759) UCG* 1.06 (2216) 0.79 (1772)
CUU 0.95 (2570) 1.34 (2750) AGU 0.85 (1770) 1.03 (2318)
CUC* 1.97 (5332) 0.79 (1628) AGC* 1.03 (2150) 0.73 (1640)
CUA 0.41 (1099) 0.74 (1516) Pro CCU 0.91 (1919) 1.21 (2292)
CUG* 1.52 (4118) 0.88 (1804) CCC* 1.32 (2776) 0.74 (1399)
Ile AUU 1.02 (2797) 1.43 (3065) CCA 0.89 (1875) 1.45 (2734)
AUC* 1.61 (4442) 0.78 (1677) CCG 0.87 (1821) 0.60 (1139)
AUA 0.37 (1025) 0.79 (1702) Thr ACU 0.96 (2294) 1.21 (2521)
Met AUG 1.00 (4032) 1.00 (3118) ACC* 1.49 (3545) 0.83 (1731)
Val GUU 0.67 (1925) 1.40 (2912) ACA 0.70 (1678) 1.25 (2607)
GUC* 1.14 (3248) 0.79 (1635) ACG 0.85 (2015) 0.71 (1486)
GUA 0.37 (1061) 0.77 (1598) Ala GCU 1.00 (3271) 1.31 (3013)
GUG* 1.82 (5203) 1.05 (2177) GCC* 1.38 (4515) 0.80 (1840)
Tyr UAU 0.50 (1151) 1.13 (1851) GCA 0.71 (2315) 1.28 (2935)
UAC* 1.50 (3424) 0.87 (1414) GCG* 0.92 (3009) 0.62 (1417)
His CAU 0.65 (1279) 1.23 (1936) Cys UGU 0.79 (1441) 1.08 (1673)
CAC* 1.35 (2642) 0.77 (1216) UGC* 1.21 (2188) 0.92 (1416)
Gln CAA 0.71 (2117) 1.18 (3336) Trp UGG 1.00 (2015) 1.00 (1293)
CAG* 1.29 (3842) 0.82 (2309) Arg CGU* 1.60 (2637) 0.93 (1267)
Asn AAU 0.79 (2261) 1.28 (3935) CGC* 1.88 (3105) 0.61 (830)
AAC* 1.21 (3495) 0.72 (2199) CGA 0.99 (1639) 1.03 (1414)
Lys AAA 0.62 (2293) 1.10 (4690) CGG 0.71 (1176) 0.63 (858)
AAG* 1.38 (5114) 0.90 (3805) AGA 0.34 (567) 1.62 (2220)
Asp GAU 0.87 (3333) 1.24 (4539) AGG 0.48 (795) 1.18 (1612)
GAC* 1.13 (4308) 0.76 (2767) Gly GGU* 1.40 (3673) 1.18 (2195)
Glu GAA 0.56 (2716) 1.13 (6131) GGC* 1.46 (3819) 0.80 (1487)
GAG* 1.44 (6946) 0.87 (4759) GGA 0.66 (1742) 1.39 (2572)
GGG 0.48 (1252) 0.62 (1158)
structure [47], intron length [48], population size [49], evolutionary age of the genes [50], environmental stress [51], the hydrophobicity and the aromaticity of the encoded proteins [52,53], and so on. In this study, the factors involved in shaping codon usage of theTaenia saginata genome at least includes gene expression level, gene compositional constraint, protein length, as well as the hydrophobicity of each protein (slightly).
Nucleotide composition could be one of the most im-portant factors in shaping codon usage among genes and genomes. GC-rich organisms, such as Bacteria, Archea, Fungi. Triticum Aestivum, Hordium vulgare and Oryza sativa [36,54], tend to use G or C in the third position. And meanwhile, AT-rich organisms show a preference for A or T in third position, such as Onchocerca volvulus, Mycoplasma capricolum and Plasmodium falciparum [55-57]. The genomic G + C content for T. saginata is 43.61%. Although the genome would thus appear to be slightly A + T rich, overall codon usage is biased toward C- and G-ending codons (Table 2), this is similar to that inGiardia lamblia[13].
Previous studies have found significant negative cor-relations between protein length and CUB in variety of organsims, such as yeast [58], Caenorhabditis elegans [11], Drosophila melanogaster [41], Arabidopsis thaliana [11] andSilene latifolia[59]. Similar results have also been found inT. saginata. There is an explanation proposed by Moriyama and Powell for this phenomenon: namely, if shorter proteins could perform similar functions to those of longer ones, longer proteins become energy-expensive and disadvantageous, thus the selection constraint acts to reduce the size of highly expressed genes, dominantly de-termines the relationship between codon bias and gene length [60].
As we know, it is difficult to quantify the expression level of genes in a differentiated multicellular eukaryote, where genes are expressed at different levels in different tissues and at different developmental stages. In the T. saginata genome, the expression level of an individual gene is lacking. It is known that EST counting is efficient for assessing gene expression level. Nevertheless, due to the limitation of EST numbers and rough prediction of gene expression level by counting ESTs, so we use the “Codon Adaptation Index”to evaluate the expression level of examined genes. CAI has been widely used to examine the expressivities of genes by many researchers and has now been considered as a well-accepted measure of gene expression [8,9].
In this study, we identified 23 codons as the optimal codons. Most of all optimal codons in the T. saginata genome end with G or C. This is very similar to the pattern observed in other eukaryotic genomes, such as Dictyoste-lium discoideum[61], D. melanogaster[62], C. elegans [18], Giardia lamblia[13]and Schizosaccharomyces pombe
[34]. The identification of optimal codons may provide useful clues for molecular genetic engineering and evolu-tionary studying.
Conclusions
For the first time, we have reported the pattern of codon usage bias in the T. saginata genome and its causative factors. Evidence suggests that the codon usage pattern inT. saginataappears to be the result of a complex equi-librium between different forces, namely mutation bias, natural selection, the GC content of genes, protein length, gene expression level and hydropathicity. Meanwhile, 23 optimal codons were identified, all of which ended with ei-ther a G or C residue, this will be useful for cloning and expression of foreign genes in the organism. Such infor-mation from this study will provide a better understanding of the characteristics of synonymous codon usage in T. saginata and its molecular evolution, and provide a new resource to underpin the development of urgently needed treatments and control.
Competing interests
The authors declare that they have no competing interests.
Authors’contributions
XY performed most of the data analysis work and contributed to the writing process. XY, XNL and XPC assisted with data analysis work and provided intellectual input to the work. All authors read and approved the final manuscript.
Acknowledgments
We thank several reviewers for helpful comments on the work presented here. Project support was provided by the Science Fund for Creative Research Groups of Gansu Province (Grant No. 1210RJIA006) and opening projects of National Key Laboratory of Veterinary Etiological Biology at Lanzhou Veterinary Research Institute of Chinese Academy of Agricultural Sciences (Grant Number: 201001).
Received: 11 April 2014 Accepted: 6 November 2014
References
1. Akashi H, Eyre-Walker A:Translational selection and molecular evolution. Curr Opin Genet Dev1998,8(6):688–693.
2. Akashi H:Gene expression and molecular evolution.Curr Opin Genet Dev
2001,11(6):660–666.
3. Duret L:Evolution of synonymous codon usage in metazoans.Curr Opin Genet Dev2002,12(6):640–649.
4. Hershberg R, Petrov DA:Selection on codon bias.Annu Rev Genet2008,
42:287–299.
5. Kane JF:Effects of rare codon clusters on high-level expression of heterologous proteins inEscherichia coli.Curr Opin Biotechnol1995,
6(5):494–500.
6. Ahn I, Jeong B-J, Bae S-E, Jung J, Son HS:Genomic analysis of influenza A viruses, including avian flu (H5N1) strains.Eur J Epidemiol
2006,21(7):511–519.
7. Zheng Y, Zhao WM, Wang H, Zhou YB, Luan Y, Qi M, Cheng YZ, Tang W, Liu J, Yu H, Yu XP, Fan YZ, Yang X:Codon usage bias inChlamydia trachomatisand the effect of codon modification in the MOMP gene on immune responses to vaccination.Biochem Cell Biol2007,
85(2):218–226.
9. Gupta S, Bhattacharyya T, Ghosh TC:Synonymous codon usage in
Lactococcus lactis: mutational bias versus translational selection.J Biomol Struct Dyn2004,21(4):527–535.
10. Lin K, Kuang Y, Joseph JS, Kolatkar PR:Conserved codon composition of ribosomal protein coding genes inEscherichia coli,Mycobacterium tuberculosisandSaccharomyces cerevisiae: lessons from supervised machine learning in functional genomics.Nucleic Acids Res2002,
30(11):2599–2607.
11. Duret L, Mouchiroud D:Expression pattern and, surprisingly, gene length shape codon usage inCaenorhabditis,Drosophila, andArabidopsis. Proc Natl Acad Sci U S A1999,96(8):4482–4487.
12. Kliman RM, Irving N, Santiago M:Selection conflicts, gene expression, and codon usage trends inyeast.J Mol Evol2003,57(1):98–109.
13. Lafay B, Sharp PM:Synonymous codon usage variation amongGiardia lambliagenes and isolates.Mol Biol Evol1999,16(11):1484–1495. 14. Ghosh TC, Gupta SK, Majumdar S:Studies on codon usage inEntamoeba
histolytica.Int J Parasitol2000,30(6):715–722.
15. Wright F, Bibb MJ:Codon usage in the G + C-richStreptomycesgenome. Gene1992,113(1):55–65.
16. McInerney JO:Replicational and transcriptional selection on codon usage inBorrelia burgdorferi.Proc Natl Acad Sci U S A1998,
95(18):10698–10703.
17. Sharp PM, Cowe E:Synonymous codon usage inSaccharomyces cerevisiae.Yeast1991,7(7):657–678.
18. Stenico M, Lloyd AT, Sharp PM:Codon usage inCaenorhabditis elegans: delineation of translational selection and mutational biases.Nucleic Acids Res1994,22(13):2437–2446.
19. Wanzala W, Onyango-Abuje JA, Kang'ethe EK, Zessin KH, Kyule NM, Baumann MP, Ochanda H, Harrison LJ:Control ofTaenia saginata
by post-mortem examination of carcasses.Afr Health Sci2003,
3(2):68–76.
20. Dorny P, Vercammen F, Brandt J, Vansteenkiste W, Berkvens D, Geerts S:
Sero-epidemiological study ofTaenia saginatacysticercosis in Belgian cattle.Vet Parasitol2000,88(1):43–49.
21. Lightowlers MW, Rolfe R, Gauci CG:Taenia saginata: Vaccination against Cysticercosis in Cattle with Recombinant Oncosphere Antigens.Exp Parasitol1996,84(3):330–338.
22. Matuchansky C, Lenormand Y:Images in clinical medicine.Taenia saginata N Engl J Med1999,341(23):1737.
23. Lees W, Nightingale J, Brown D, Scandrett B, Gajadhar A:Outbreak of Cysticercus bovis (Taenia saginata) in feedlot cattle in Alberta.Can Vet J
2002,43(3):227–228.
24. Altschul SF, Madden TL, Schaffer AA, Zhang J, Zhang Z, Miller W, Lipman DJ:
Gapped BLAST and PSI-BLAST: a new generation of protein database search programs.Nucleic Acids Res1997,25(17):3389–3402.
25. Journet EP, van Tuinen D, Gouzy J, Crespeau H, Carreau V, Farmer MJ, Niebel A, Schiex T, Jaillon O, Chatagnier O, Godiard L, Micheli F, Kahn D, Gianinazzi-Pearson V, Gamas P:Exploring root symbiotic programs in the model legumeMedicago truncatulausing EST analysis.Nucleic Acids Res
2002,30(24):5579–5592.
26. Fukunishi Y, Hayashizaki Y:Amino acid translation program for full-length cDNA sequences with frameshift errors.Physiol Genomics
2001,5(2):81–87.
27. Sharp PM, Li W-H:An evolutionary perspective on synonymous codon usage in unicellular organisms.J Mol Evol1986,24(1–2):28–38. 28. Wright F:The 'effective number of codons' used in a gene.Gene1990,
87(1):23–29.
29. Sueoka N:Directional mutation pressure and neutral molecular evolution.Proc Natl Acad Sci U S A1988,85(8):2653–2657.
30. Sharp PM, Li W-H:The codon adaptation index-a measure of directional synonymous codon usage bias, and its potential applications.Nucleic Acids Res1987,15(3):1281–1295.
31. Wang H-C, Hickey DA:Rapid divergence of codon usage patterns within the rice genome.BMC Evol Biol2007,7(Suppl 1):S6.
32. Liu Q, Feng Y, Zhao X, Dong H, Xue Q:Synonymous codon usage bias in
Oryza sativa.Plant Sci2004,167(1):101–105.
33. Liu Q:Analysis of codon usage pattern in the radioresistant bacterium
Deinococcus radiodurans.Biosystems2006,85(2):99–106.
34. Sharp PM, Cowe E, Higgins DG, Shields DC, Wolfe KH, Wright F:Codon usage patterns inEscherichia coli,Bacillus subtilis,Saccharomyces cerevisiae,Schizosaccharomyces pombe,Drosophila melanogasterand
Homo sapiens; a review of the considerable within-species diversity. Nucleic Acids Res1988,16(17):8207–8211.
35. Chen L, Liu T, Yang D, Nong X, Xie Y, Fu Y, Wu X, Huang X, Gu X, Wang S, Peng X, Yang G:Analysis of codon usage patterns inTaenia pisiformis
through annotated transcriptome data.Biochem Biophys Res Commun
2013,430(4):1344–1348.
36. Kawabe A, Miyashita NT:Patterns of codon usage bias in three dicot and four monocot plant species.Genes Genet Syst2003,
78(5):343–352.
37. Sueoka N, Kawanishi Y:DNA G+ C content of the third codon position and codon usage biases of human genes.Gene2000,
261(1):53–62.
38. Nakamura Y, Gojobori T, Ikemura T:Codon usage tabulated from the international DNA sequence databases.Nucleic Acids Res1997,
25(1):244–245.
39. Bulmer M:Are codon usage patterns in unicellular organisms determined by selection‐mutation balance?J Evol Biol1988,1(1):15–26.
40. Comeron JM, Kreitman M, Aguade M:Natural selection on synonymous sites is correlated with gene length and recombination in Drosophila. Genetics1999,151(1):239–249.
41. Marais G, Mouchiroud D, Duret L:Does recombination improve selection on codon usage? Lessons from nematode and fly complete genomes. Proc Natl Acad Sci U S A2001,98(10):5688–5692.
42. Hey J, Kliman RM:Interactions between natural selection, recombination and gene density in the genes of Drosophila. Genetics2002,160(2):595–608.
43. Kliman RM, Hey J:Hill-Robertson interference inDrosophila melanogaster: reply to Marais, Mouchiroud and Duret.Genet Res
2003,81(2):89–90.
44. Hartl DL, Moriyama EN, Sawyer SA:Selection intensity for codon bias. Genetics1994,138(1):227–234.
45. Chen Y, Carlini DB, Baines JF, Parsch J, Braverman JM, Tanda S, Stephan W:
RNA secondary structure and compensatory evolution.Genes Genet Syst
1999,74(6):271–286.
46. Carlini DB, Chen Y, Stephan W:The relationship between third-codon position nucleotide content, codon bias, mRNA secondary structure and gene expression in the drosophilid alcohol dehydrogenase genes Adh and Adhr.Genetics2001,159(2):623–633.
47. Oresic M, Dehn M, Korenblum D, Shalloway D:Tracing specific
synonymous codon-secondary structure correlations through evolution. J Mol Evol2003,56(4):473–484.
48. Vinogradov AE:Intron length and codon usage.J Mol Evol2001,
52(1):2–5.
49. Berg OG:Selection intensity for codon bias and the effective population size ofEscherichia coli.Genetics1996,142(4):1379–1382.
50. Prat Y, Fromer M, Linial N, Linial M:Codon usage is associated with the evolutionary age of genes in metazoan genomes.BMC Evol Biol2009,
9:285.
51. Goodarzi H, Torabi N, Najafabadi HS, Archetti M:Amino acid and codon usage profiles: adaptive changes in the frequency of amino acids and codons.Gene2008,407(1–2):30–41.
52. Romero H, Zavala A, Musto H:Codon usage inChlamydia
trachomatisis the result of strand-specific mutational biases and a complex pattern of selective forces.Nucleic Acids Res2000,
28(10):2084–2090.
53. Rispe C, Delmotte F, van Ham RC, Moya A:Mutational and selective pressures on codon and amino acid usage inBuchnera, endosymbiotic bacteria of aphids.Genome Res2004,14(1):44–53.
54. Hershberg R, Petrov DA:General rules for optimal codon choice.PLoS Genet2009,5(7):e1000556.
55. Saul A, Battistutta D:Codon usage inPlasmodium falciparum.Mol Biochem Parasitol1988,27(1):35–42.
56. Milhon JL, Tracy JW:Updated codon usage inSchistosoma.Exp Parasitol
1995,80(2):353–356.
57. Muto A, Yamao F, Osawa S:The genome ofMycoplasma capricolum.Prog Nucleic Acid Res Mol Biol1987,34:29–58.
58. Ingvarsson PK:Gene expression and protein length influence codon usage and rates of sequence evolution inPopulus tremula.Mol Biol Evol
2007,24(3):836–844.
59. Qiu S, Bergero R, Zeng K, Charlesworth D:Patterns of codon usage bias in
60. Moriyama EN, Powell JR:Codon usage bias and tRNA abundance in
Drosophila.J Mol Evol1997,45(5):514–523.
61. Sharp PM, Li W-H:On the rate of DNA sequence evolution inDrosophila. J Mol Evol1989,28(5):398–402.
62. Shields DC, Sharp PM, Higgins DG, Wright F:" Silent" sites inDrosophila
genes are not neutral: evidence of selection among synonymous codons.Mol Biol Evol1988,5(6):704–716.
doi:10.1186/s13071-014-0527-1
Cite this article as:Yanget al.:Analysis of codon usage pattern in Taenia saginatabased on a transcriptome dataset.Parasites & Vectors
20147:527.
Submit your next manuscript to BioMed Central and take full advantage of:
• Convenient online submission
• Thorough peer review
• No space constraints or color figure charges
• Immediate publication on acceptance
• Inclusion in PubMed, CAS, Scopus and Google Scholar
• Research which is freely available for redistribution

![Figure 6 PR2-bias plot [A3/(A3 + T3) against G3/(G3 + C3)]. Redopen circle indicate the average position for each plot](https://thumb-us.123doks.com/thumbv2/123dok_us/8333310.302698/7.595.306.539.558.715/figure-bias-plot-redopen-circle-indicate-average-position.webp)