Q-Factor and Sphere Separation Effects in
Waveguide-Coupled Microsphere Resonators
Y. Panitchob, G. Senthil Murugan, M.N. Zervas, and J.S. Wilkinson
Optoelectronics Research Centre, University of Southampton, Highfield,
Southampton, SO17 1 BJ, United Kingdom
ABSTRACT
Quality-factors of waveguide coupled microsphere resonators of 30 µm diameter are measured. A Teflon buffer layer is deposited on the waveguide to separate the microsphere from the waveguide and the effect of this separation on the measured quality-factor is discussed. The whispering-gallery mode propagation along the cavity of the microsphere as well as the optical path lengths of the modes are determined; the experimental and theoretical data are compared and discussed. A five-fold increase of the Q-factor was obtained by increasing the sphere-waveguide separation.
Keywords: Microspheres, Whispering-gallery modes, Waveguides, Integrated Optics
1.
INTRODUCTION
Microspheres coupled to optical waveguides through evanescent field interaction offer compact high-Q resonators combined with a flexible choice of resonator material for lasing, switching, sensing or filtering devices. Coupling on a planar optical circuit results in robust construction, straightforward alignment of multiple and concatenated resonators, direct access to evanescent fields, high compatibility with optical fiber applications and low cost of fabrication [1, 2]. Microspheres excited by the waveguide evanescent field achieve resonance when the optical path length of a whispering gallery mode is an integer multiple of the wavelength. The coupling efficiency into (and out of) the resonator is critically controlled by the separation between the microsphere and the waveguide [3, 4], allowing control of the power circulating in the sphere and transmitted through the coupled waveguide. The quality-factor, Q, describes the losses in the system, the bandwidth of the resonances and the relationship between the incident and circulating field amplitudes, and extremely high-Q operation has been achieved for silica spheres [5]. Coupling reduces the Q-factor, so that resonator characteristics such as bandwidth may be controlled by adjustment of the waveguide-sphere separation to tailor the performance to the application. Control of coupling through separation is also important in achieving critical coupling (or impedance-matching) for resonators with loss [6]. Determination of how the Q-factor of the system relates to the waveguide-sphere separation therefore provides essential information for future device design.
In this paper, experimental measurements of the Q-factor of 30 µm diameter soda-lime glass microspheres coupled to ion-exchanged channel waveguides, coated with low-index Teflon AF separation layers of various thicknesses, are reported. A signal proportional to the circulating power in the microsphere was obtained by imaging the sphere on a CCD camera and integrating the intensity over the image. Measurements were made in the wavelength range between 745 nm and 765 nm, allowing the free spectral range (FSR), the modal path length, and the Q-factor to be determined.
2.
THEORY AND BACKGROUND
Design of microsphere coupled optical waveguide devices and interpretation of experimental results requires theoretical models to allow determination of (i) WGM properties such as effective radius, field distribution and loss, and coupling coefficient between WGM and waveguide modes and (ii) transmission coefficient of the coupled waveguide system and circulating power in the microsphere. In this work the approach of Little et al [8] has been used to find the modal solutions and has been adapted for coupling to planar rather than fibre waveguides, and the approach of Yariv [7] is used to describe the circulating power vs wavelength, for comparison with the experimental measurements.
The optical field in a microsphere WGM, represented by either the Eθor Hθcomponents of the electromagnetic field of
the WGM’s, can be described by the following equation [8].
(
θ φ)
= ⋅ψ( ) ( ) ( )
⋅ψθ θ ⋅ψφ φWhere ψφ
( )
φ represents the electromagnetic field in the azimuthal direction, along which the WGM propagates, while( )
θψθ and ψr
( )
r represent the fields in the angular and radial directions, respectively. These terms are described by:( )
φ[
φ]
ψφ =exp± jm (2)
( )
( )
,2
exp θ2 θ
θ
ψθ m HN m
−
= m≥1≥θ (3)
( )
[
]
> − − ≤ = o o s o s l o s l r R r R r R kn j R r r kn j r , ) ( exp ) ( ), ( α ψ (4)The normalization constant, Ns, is chosen so that the volume integral of the square of magnitude of the fields over the
entire space in the microsphere, divided by the microsphere circumference is unity [8]. The normalized field obtained from this normalization constant is necessary for the calculation of the coupling coefficient (K) to the waveguide. The equatorial plane is perpendicular to the angular modal plane (or transverse plane).
(
)
(
) (
)
2 / 1 1 1 2 2 1 1 1 ! 2 − + − − − += l s o l s o l s o
o s o
N
s j kn R j kn R j kn R
R R N m N α π (5)
Where N =l−m, and k is the wave number, λπ
2
=
k .
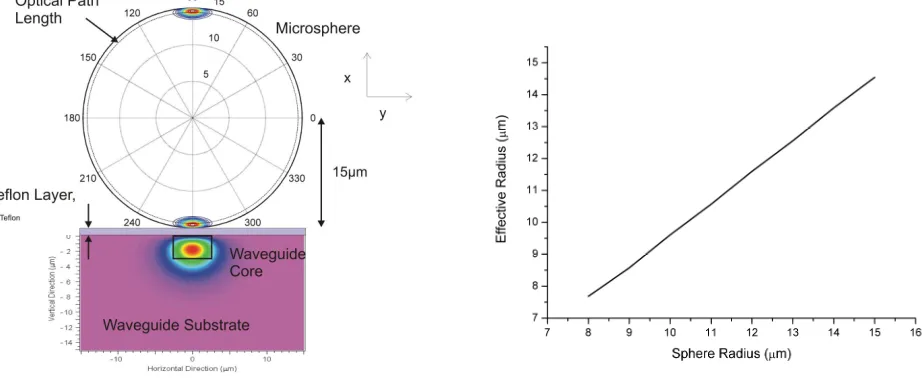
Fig. 1 shows a cross-sectional plot of the fundamental mode distribution of the field in radial-angular plane of a microsphere of 30 µm diameter, combined with a plot of the modal field of a monomode waveguide, with the guide core region of 5x3 µm, coated with a with a layer of Teflon calculated using the beam propagation method (Beamprop, RSoft) for a wavelength of 750 nm in the TE polarization. The WGM field shows a maximum intensity just within the surface of the sphere, as expected, implying that the effective optical path length will correspond to a radius smaller than the physical radius of the sphere. The calculated effective radius for the fundamental mode at a wavelength of 750 nm, which dictates the free spectral range (FSR) of the resonator, is plotted in Fig. 2 as a function of sphere diameter.
Fig.1: Microsphere and waveguide fields in transverse cross-section Fig. 2: Effective radius as a function of sphere radius
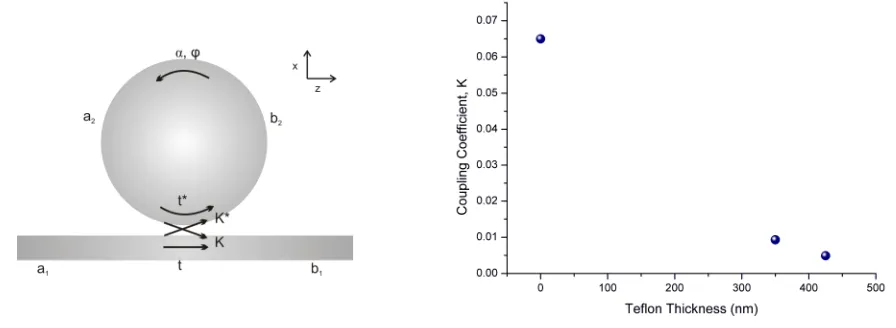
[image:2.595.70.531.431.620.2]the coupled waveguide-microsphere system can then be calculated using the unidirectional coupling method described by Yariv [7]. This method relates the circulating power in the sphere and the transmitted power in the waveguide to the coupling coefficient, K, losses, α, WGM optical path length and the optical wavelength of the configuration shown in Fig. 3.
[image:3.595.70.518.126.290.2]
Fig.3: Coupling, transmission coefficients and loss factor Fig.4: Coupling coefficient vs Teflon thickness
In Fig. 3, t* and K* are the complex conjugates of the transmission coefficient, t, and the coupling coefficient, K, respectively. Coefficients a1, a2, b1 and b2 are the field amplitudes that correspond to the incident field in the waveguide,
the field that circulates out from the microsphere, the field from the output port of the waveguide, and the incident field in the microsphere, respectively. The transmission coefficient describes the transmission through the waveguide from the
region before the sphere to that after the sphere, and is related to the coupling coefficient by: K= 1 t− 2 .
The power-transfer function relating the power incident from the waveguide to the circulating power inside the resonator cavity is then given by Eqn. 6 [7].
( )
( )
2 2 2 2 21 2 2
cos 2 1
1
t t
t a
a E E
i r
α ϕ α
α + −
− =
= (6)
Where ϕ is the circulation phase shift;
λ π ϕ 4 2Reffn
= , and α is the circulation loss factor (α=1 for a lossless sphere).
This transfer function may be fitted to experimental data of scattered circulating power vs wavelength to determine the WGM optical path length, and to determine the circulation loss factor, α, using the calculated values of coupling
coefficient as a function of Teflon thickness (see Fig. 4).
3.
EXPERIMENTAL PROCEDURE
Monomode potassium ion exchanged waveguides in BK7 glass were used for this work, to provide a flat surface and fibre-compatible operation. Waveguides were formed in BK7 glass by ion-exchange from a KNO3 melt at 400oC,
through Al openings of 5 µm width, for a duration of 4 hours. The waveguide ends were polished and a transparent Teflon AF layer was evaporated onto the waveguide as a buffer layer to separate the microsphere from the waveguide surface. The Teflon buffer layer, which has a lower refractive index (1.29) compared to the refractive index of the microsphere and waveguide (~1.5), ensures evanescent fields between the sphere and waveguide. Three different thicknesses of Teflon, DTeflon, were used and the system quality-factor was measured for each thickness as follows.
TE polarized light from a Titanium: Sapphire (Ti:Al2O3) tunable laser was end-fire coupled into the waveguide using a
microsphere being taken as the wavelength was swept. The scattered power reaching the CCD camera is assumed to be proportional to the WGM power circulating in the sphere, and should therefore follow the wavelength dependence of Eqn. 6. The normalized scattered power from the sphere was determined by integrating the scattered power over an mxn matrix of pixels surrounding the microsphere, subtracting the background signal found by integrating the pixel values over the same mxn matrix of pixels close to, but not including, the sphere, and then normalizing to a peak value of unity.
4.
EXPERIMENTAL RESULTS
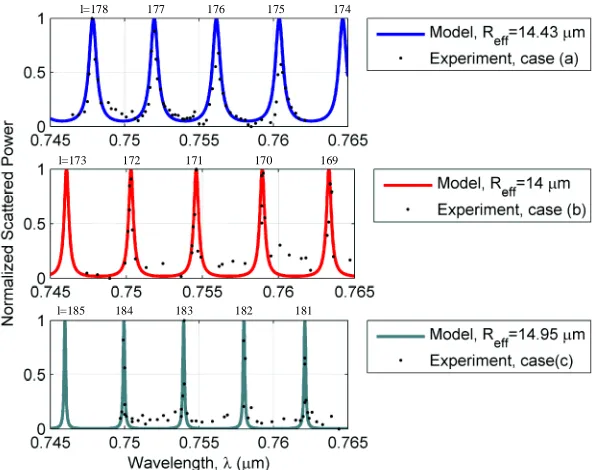
[image:4.595.150.453.275.510.2]The points in Fig. 5 shows the scattered power from the microspheres over the wavelength range 745-765 nm, for Teflon layer thicknesses of 0, 350 and 425 nm. The unexpected fluctuations in the peak height are believed to be due to imprecise tuning to the peak wavelengths, while the high background level between peaks may be due to non-resonant scattering from the microsphere. The vestigial wavelength peaks near the main resonances may correspond to more weakly coupled sphere modes.
Fig. 5 also shows theoretical fits of Eqn. 6 (normalized to unity) to the data, where the calculated value of K from Fig. 4 has been used and the effective radius, Reff, and circulation loss factor, α, were adjusted to fit the data, so that the
theoretical and experimental resonant wavelengths, free spectral ranges and resonance bandwidths agree.
Fig.5: Whispering gallery resonances of a microsphere with Teflon layer separation of (a) 0, (b) 350, & (c) 425 nm
The effective radius of the microsphere WGM, Reff, in each case is obtained by matching free-spectral range and the
wavelength of resonances to yield effective modal radii for the three microspheres studied of 14.43, 14.00 and 14.95 µm. Comparison with Fig. 2, shows that these effective radii correspond to physical sphere radii of approximately 14.89, 14.45 and 15.41 µm, respectively, well within the manufacturer’s tolerance.
The quality-factor can be calculated from the resonance spectra in Fig. 5 by the following equation:
FWHM res
Q λλ ∆
= (7)
Where λresis the wavelength of a resonance, and ∆λFWHMis the width of the resonant lobe at full-width of half
maximum.
The Q-factors determined from the experimental results using Eqn. 7 were found to be approximately 1500, 3750 and 7500, for separations of 0, 350 and 425 nm, respectively, and these are plotted in Fig 6. While the trend of Q-factor
l=173 172 171 170 169 l=178 177 176 175 174
versus separation is as expected, i.e. increasing as coupling to the waveguide is reduced, these measured Q-factors are modest compared with those predicted by theory and those obtained for silica microspheres. This is believed to be due to higher absorption and, in particular, scattering losses and poorer sphericity of these commercially available microspheres, and these effects are under further investigation.
The circulation loss factor, α, derived from fitting Eqn. 6 to the experimental results for each case, using the theoretically
calculated coupling coefficients shown in Fig. 4, is also plotted in Fig 6. α, which is unity for a lossless sphere, is found to be 0.6354, 0.7680 and 0.9103 for a separation of 0, 350, and 425nm, respectively. If each sphere were identical, then α should be the same for each. However, it is clear that this is not the case, and it is believed that this is because of defects of different sizes and distributions on each microsphere. Immediate future work will concentrate on establishing the intrinsic Q-factor of these microspheres [5] by using larger waveguide-sphere separations, in further rigorous comparisons of the theoretical and experimental coupling coefficients, and in improving sphere quality.
Fig.6: Quality-factor and circulation loss factor as function of Teflon thickness
5.
CONCLUSION
In conclusion, we have demonstrated control of coupling between integrated optical waveguides and the whispering gallery modes of commercial microspheres, using a low-index dielectric separation layer. The effective radii of the whispering gallery modes and the separation dependent Q-factor of the system have been determined from the wavelength-dependent scattering behaviour of the spheres, and these parameters have been related to a detailed model of the system. In general, the expected behavior was obtained, although the sphere losses determined were higher than expected. Improvement of sphere loss will lead to much improved performance and more precise confirmation of coupling coefficients. This approach is expected to lead to a new generation of microsphere resonator integrated planar lightwave circuits. A five-fold increase of the Q-factor was obtained by increasing the sphere-waveguide separation.
This work was supported by the UK Engineering and Physical Sciences Research Council Grant GR/S96500/01.
REFERENCES
1. J. P. Laine, B. E. Little, D. R. Lim, H. C. Tapalian, L. C. Kimerling, and H. A. Haus, "Microsphere resonator mode characterization by pedestal anti-resonant reflecting waveguide coupler," IEEE Photonics Technology Letters 12(8), 1004-1006 (2000).
2. B. E. Little, J. P. Laine, D. R. Lim, and H. A. Haus, "Pedestal antiresonant reflecting waveguides for robust coupling to microsphere resonators and for microphotonics circuits," Optics Letters 25(1), 73-75 (2000).
4. J. P. Laine, C. Tapalian, B. Little, and H. Haus, "Acceleration sensor based on high-Q optical microsphere resonator and pedestal antiresonant reflecting waveguide coupler," Sensors and Actutators A 93, 1-7 (2001).
5. M. L. Gorodetsky, A. A. Savchenkov, and V. S. Ilchenko, "Ultimate Q of optical microsphere resonators," Optics Letters 21(7), 453-455 (1996).
6. S. Shiller, I. I. Yu, M. M. Fejer, and R. L. Byer, "Fused-silica monolithic total-internal-reflection resonator," Optics Letters 17(5), 378-380 (1992).
7. A. Yariv, "Universal relations or coupling of optical power between microresonators and dielectric waveguides," Electronics Letters 36(4), 321-322 (2000).