promoting access to White Rose research papers
White Rose Research Online
[email protected]
Universities of Leeds, Sheffield and York
http://eprints.whiterose.ac.uk/
White Rose Research Online URL for this paper:
http://eprints.whiterose.ac.uk/77922/
Paper:
Brodlie, KW and Wood, JD (2007) Computational steering in visualization
dataflow environments. In: MODSIM 2007: International Congress on Modelling
and Simulation. International Congress on Modelling and Simulation
Computational Steering in Visualization Dataflow
Environments
Brodlie, K.W. and J.D. Wood
School of Computing, University of Leeds, UK Email: [email protected]
Keywords: Visualization, computational steering, modular visualization environments
EXTENDED ABSTRACT
This paper traces the evolution of computational steering within visualization dataflow environments. In computational steering we integrate simulation and visualization into a single environment, in which the scientist can control the simulation on the basis of the visualization of the current results. This paper is essentially a review paper, in which we describe a number of projects with which we have been involved over the last twenty years.
We begin with a historical look-back to the early development of dataflow visualization systems. These are also known as modular visualization environments. They typically consist of a library of elementary visualization components that can be wired together in a visual editor in order to compose a pipeline forming the visualization application. From an early stage these have been used for computational steering, because it is possible to include user code, for example a simulation, as a component in the pipeline.
Moreover modules are able to run on a distributed set of resources, allowing simulation code to run on a remote resource. This very useful facility has been surprisingly little used.
Our own involvement in computational steering began in 1993 with the GRASPARC project, and interest was re-kindled in 2000 with the emergence of Grid computing and the UK e-science programme. Our first task was to re-work the distributed computing model of IRIS Explorer (the dataflow system we use at Leeds) so as to provide the security that is expected in modern computing environments. This was followed by a re-working of the architecture for computational steering, in the gViz project, where we separated the simulation code from the visualization dataflow, and allowed the simulation to run autonomously. This was achieved using the gViz computational steering library.
Our more recent work in the e-viz project has extended the architecture further, basing the work around an abstract description of the visualization pipeline from which a user interface for steering can be automatically generated. Likewise the pipeline description can be interpreted in terms of different visualization systems, providing an extra level of abstraction.
As interest in service-oriented architectures develops, we are seeing a reworking of visualization systems as a pipeline of services, rather than modules. We can expect this trend to carry over to computational steering in future research.
1. INTRODUCTION
Visualization plays a key role in understanding the results of the large simulations that now occur routinely in computational science and engineering. A particularly useful aspect of visualization is an ability to understand the progress of a simulation as it evolves, so that action can be taken to adjust control parameters. This engagement between the scientist and the simulation is called computational steering. In this paper we shall review the emergence of computational steering over the past twenty years, and reflect particularly on recent work at Leeds in the context of the UK e-Science research programme.
2. DEVELOPMENT OF DATAFLOW VISUALIZATION ENVIRONMENTS
A starting point for the modern era of visualization is often taken as the NSF report ‘Visualization in Scientific Computing’ (McCormick et al, 1987). The report provided the stimulus for the development of a new type of visualization system – the Modular Visualization Environment, or MVE, in which scientists could compose visualization applications by linking different components into a processing pipeline, or network, using a visual programming editor. The basic concept is that data flows along the pipeline, the output from one module passing as input to another module connected downstream.
The first two MVEs to be developed were AVS (Upson et al, 1989) and apE (Dyer, 1990), both of which were in use by scientists in 1990. AVS was produced by Ardent, and despite having passed through various owners, still exists as a visualization system today; apE was a product of the Ohio Supercomputing Graphics Centre, and gradually faded during the 1990s. At the same time as AVS and apE emerged, Haber and McNabb (1990) presented an elegant abstraction of the dataflow concept. This reference model shown in Figure 1 has underpinned many subsequent developments in visualization.
Figure 1 : Visualization Dataflow Reference Model
The NSF report foresaw that visualization would not only be used for understanding the results of a simulation, but would also be valuable as a way of ‘guiding simulations interactively’ – what we would now term ‘computational steering’. One of the first to demonstrate this was the apE team from Ohio, who studied turbulence effects on Lake Erie (Marshall et al, 1990). They successfully used steering to study the impact of sudden changes of wind velocity on the surface water level, allowing scientists to understand better the consequences of severe storms. Another important contribution of this paper was to characterise different approaches to linking simulation and visualization: post-processing, where the entire simulation is executed, and the results stored for later visualization; tracking, where the visualization is connected directly to the simulation, and used to monitor its progress; and steering, where in addition there is an opportunity to change simulation parameters as the computation proceeds
[image:3.595.324.521.184.316.2](see Figure 2). All three approaches have their advantages: post-processing allows a scientist to work at their own pace in studying the simulation results; tracking allows an early decision on terminating an unproductive simulation – thus saving scarce computational resource; and steering allows the computation to be focussed on a productive region of the parameter space.
Figure 2: Post-processing, tracking and steering
In the early 1990s, two further dataflow visualization systems emerged: IRIS Explorer (Walton, 2005), originally developed by Silicon Graphics, later taken over by NAG, and still in widespread use today; and IBM Data Explorer (Abram and Treinish, 1995), now an open source product, OpenDX. An important feature of all these MVE systems is their extensibility: all are designed to allow user-written code to be embedded within a module and included in a dataflow pipeline. In particular this enables simulation code to be incorporated into the pipeline – thus both tracking and steering of simulations becomes immediately feasible. Moreover some systems, IRIS Explorer in particular, were explicitly designed around a distributed computing concept, whereby modules are allowed to run on different machines. This enabled for example the simulation code to run on a remote supercomputer, while the visualization modules ran on the desktop.
The GRASPARC project (Brodlie et al, 1993) was the first to extend the concept of steering beyond a simple adjustment of parameters as the simulation executes. They argued that, by the time a ‘problem’ was observed, it could easily be too late to apply a corrective change of parameters. They therefore proposed the addition of a data management system to allow checkpoints, or snapshots, to be recorded as the simulation proceeds. This allows the idea of back-tracking to a previously stored point from where the simulation can be resumed with changed parameters. The set of checkpoints naturally form a tree of exploration points, termed a ‘history tree’ (see Figure 3).
Figure 3: GRASPARC history tree
Thus by the end of the 1990s computational steering was established as a useful concept in computational science. However its use was perhaps less prevalent than might have been expected at the start of the decade, and post-processing probably remained the dominant approach when visualizing simulations. The advent of Grid computing at the turn of the millennium re-kindled interest in tackling large-scale simulations, and with it the idea of controlling simulations on-line. In the following section we review some of the recent computational steering research with which we have been involved. Our practical experiments have been based around the IRIS Explorer visualization system, and indeed have benefited from our close collaboration with NAG over many years.
3. COMPUTATIONAL STEERING IN GRID COMPUTING – RECENT RESEARCH AT LEEDS
3.1. An exemplar application
We have used a simple but persuasive application in order to drive our research. This is the scenario of a ‘fugitive pollutant’, issued from a chimney and driven by the prevailing wind. It has been a useful application as a demonstrator because the simulation can be scaled from solution of the advection equation for the pollutant concentration over a simple mesh (which can run on a laptop), to a complex atmospheric model describing the transport of different chemical species through space and the reactions between these species.
The steering parameter is the wind direction, enabling us to model various ‘what-if’ scenarios. It is also a useful example because it supports different collaborative scenarios, for example where numerical modeller, meteorologist and political decision maker all share an interest in understanding the behaviour of the pollutant.
3.2. Extending IRIS Explorer to Grid computing – early work in the gViz project
As explained earlier, the early dataflow visualization systems were designed with distributed computing in mind. However the era of Grid computing brings issues of security, authentication and authorisation to the forefront. Our first step therefore was to re-visit the mechanism by which modules can be located on remote resources. This used the now deprecated
rsh facility, but a simple replacement by the ssh
utility gives a robust and secure mechanism.
The Globus toolkit provides important middleware for Grid computing, and in particular a means of secure access to remote resources based on certificates. This was incorporated into IRIS Explorer as an alternative to ssh.
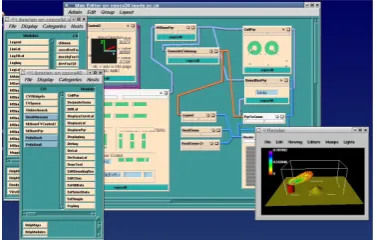
[image:4.595.318.507.605.725.2]
Figure 4 shows a screenshot of the Grid-enabled version of IRIS Explorer being applied to the pollution application. There is just one dataflow network, but the modules are executing on two different host computers. The dataflow network is designed on the local host: the available modules on the two hosts, local and remote, are shown in the library panels on the left of the picture, and the user drags and drops modules from the appropriate libraries. Here the simulation runs remotely, together with modules that filter the data to ensure that only relevant data is transferred back to the local machine. The steering widget, to control the wind direction, runs locally, as do the visualization and rendering modules. Further detail is provided in Brodlie et al (2004).
However it soon became apparent that including the simulation as a module in the dataflow of IRIS Explorer was somewhat restrictive. The timescales of simulations (essentially a machine-based process) are typically quite different from those of visualization (a human-based process). Complex simulations may run for days or weeks. We were also aware of user requirements to interface to a range of different visualization systems. This led to the idea of allowing the simulation and visualization to run independently, and this is described in the next section.
3.3. The gViz computational steering library
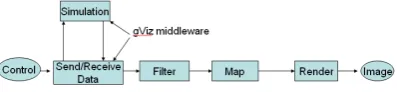
[image:5.595.319.529.197.355.2]The new architecture is shown in Figure 5. The simulation now runs externally to the dataflow. The two are connected by the gViz library acting as middleware. One component of the library is used to instrument the simulation: it is designed to be minimally intrusive, queueing parameter change requests from the user until the simulation is ready to process the changes (in contrast to including the simulation as an IRIS Explorer module when it proved very difficult to handle user interrupts efficiently, and substantial compute time was used by asking the simulation to poll the user interface).
Figure 5 – gViz computational steering architecture
The second component of the library is embedded in modules in the dataflow visualization system. In our example, this means that the wind control
widget is instrumented with gViz calls to communicate parameter changes to the corresponding gViz code in the simulation. Again the full description is given in Brodlie et al (2004).
An advantage of this approach is that the work can be applied to other visualization systems, and we successfully implemented the pollution demonstrator not only with IRIS Explorer, but also with vtk, Matlab and SCIRun (see Figure 6).
Figure 6: Pollution demonstrator implemented in SCIRun using gViz library
Note that the steering is still carried out through the visualization system, and indeed we can still use the distributed features described in the last section – for example, to place a data filter on the same host as the simulation, to reduce the data traffic to the local machine.
Each of the visualization applications – IRIS Explorer, vtk, SCIRun, Matlab – was handcrafted with the aim of getting similar behaviour. This prompts the idea of abstracting a description of the pipeline that is system-independent, and can be (potentially) automatically translated into the language of a particular system.
3.4. Describing the visualization pipeline – and user interface generation
This strand of work began within the gViz project, and was developed by Duce and Sagar (2005). They created skML, an XML application that describes the way modules are connected in dataflow networks. A visualization consists of one or more maps (i.e., pipelines); a map consists of
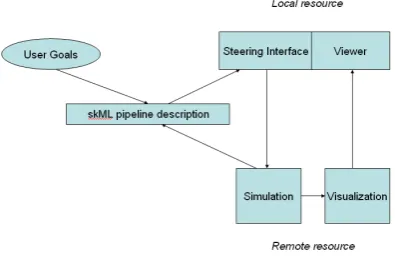
[image:5.595.89.288.613.659.2]In the e-viz project, we have extended skML to include a full description of the parameters of a module. This has the advantage that we can now automatically generate a user interface for each module – again independently of any particular visualization system. Our architectural model, shown in Figure 7, now has the user interface ‘attached’ to a skML description of the dataflow; this in turn can be interpreted in terms of whatever visualization system is preferred. There is no need to pass simulation control parameters via the visualization system, and so these connect directly, using the gViz library mechanism described in the previous section. We also assume now that the visualization system is running remotely, and we therefore include a local viewer as part of the e-Viz client system.
Figure 7: e-Viz architectural model
Yet another re-working of the pollution demonstrator was carried out, and the result is shown in Figure 8.
Figure 8: Pollution demonstrator re-worked within the e-Viz framework
The question arises: how is the skML description created in the first place? Duce and Sagar (2005) describe a visual editor which allows skML to be generated. In the e-Viz project, work was begun on generating skML automatically from a higher level description of the visualization task – see Brodlie
et al (2007). The automatic user interface generation is described in Wood et al (2007).
3.5. Collaborative computational steering
In many applications, a number of scientists share an interest in the control of the simulation and visualization of the results. Early work by Wood et al (1997) showed how MVEs could be extended to collaborative working, by allowing pipelines of different users to be interconnected – i.e., the output from a module in scientist A’s pipeline could be wired as input to a module in scientist B’s pipeline. Wood et al implemented the concept as the COVISA toolkit for IRIS Explorer, extending this single-user system to team working.
This idea carries over automatically to the Grid-enabled IRIS Explorer described in section 3.2. Similarly the gViz library of section 3.3 was designed to allow simultaneous access to simulations by a number of users, and this idea was developed more rigorously by Wood and Wright (2005).
Likewise the e-Viz developments of section 3.4 continue the policy of making sure that any new visualization approaches are feasible in a collaborative context.
4. RELATED WORK IN
COMPUTATIONAL STEERING
We mention briefly here a selection of work in computational steering by other groups.
The Computational Steering Environment (CSE), developed by van Liere et al (1997), introduced the idea of steering widgets – the user designs (with a drawing tool) an object to act as a widget, and links the object to an item of data, for example a simulation parameter. Manipulating the object then corresponds to manipulating the steering parameter.
[image:6.595.86.292.500.626.2]Liere et al, the steering is achieved via interactors embedded in the visualization.
Significant research in computational steering has been carried out within the Reality Grid project. This project has developed a library for computational steering, similar to the gViz library described in section 3.3 above (Pickles et al, 2004). The scientist instruments their application code with calls to the library, and there is a corresponding section of the library that is integrated into the visualization system. The steering library has been used in conjunction with the AVS dataflow visualization system, although the paradigm is similar to that of Figure 5 with the simulation separate from the visualization.
5. CONCLUSIONS AND FUTURE TRENDS
This paper has shown how dataflow visualization systems have evolved to support computational steering of large-scale simulations. It has always been possible to include a simulation process as a module in a dataflow pipeline in many MVEs, but recent developments have focussed on ensuring this is done securely. To improve efficiency and flexibility, we have shown how it can be advantageous to separate out the simulation as an autonomous process with a link to the visualization system. Finally, by providing an XML-based description of a visualization pipeline, we are able to provide an automatically generated user interface.
A current trend is towards service-oriented computing. Charters et al (2004) have shown how it is possible to combine services in a dataflow pipeline, just as modules are connected in an MVE. Thus the reference model of Figure 1 can still be used, but with services for filter, map and render. In principle, the models of Figure 2 and Figure 5 can extend in a similar manner to provide service-oriented computational steering, and this would be an important area for future work. Charter’s work has been further developed (though not for computational steering) by Wang et al (2006). This also brings in some ideas from the gViz and e-Viz projects so that for example, a skML description is used to generate a connected set of services, and the user interface is automatically generated. This work too could easily extend to computational steering applications.
6. REFERENCES
Abram, G. and L. Treinish (1995), An extended dataflow architecture for data analysis and
visualization, Computer Graphics, 29(2),
17-21.
Brodlie, K.W., L. Brankin, G. Banecki, A. Gay, A. Poon and H. Wright (1993), GRASPARC – A problem solving environment integrating
computation and visualization, in
Proceedings of IEEE Visualization 1993, edited by G.M. Nielson and R.D. Bergeron, 102-109, IEEE Computer Society Press.
Brodlie, K.W., D. Duce, J. Gallop, M. Sagar, J. Walton, J. Wood (2004), Visualization in
Grid Computing Environments.
Proceedings of IEEE Visualization 2004, 155-162.
Brodlie, K.W., J. Brooke, M. Chen, D. Chisnall, C. Hughes, N.W. John, M.W. Jones, M. Riding, N. Roard, M. Turner and J.D. Wood (2007), Adaptive Infrastructure for
Visual Computing, in Theory and Practice
of Computer Graphics 2007, eds D.A. Duce
and I.S. Lim, Eurographics.
Charters, S.M., N.S. Holliman and M. Munro (2004), Visualization on the Grid: a
Web-service approach, in Proceedings of UK
e-Science All Hands Meeting, available at: http://www.allhands.org.uk/2004/proceedin gs/index.html.
Duce, D.A. and M. Sagar (2005), skML: A
Markup Language for Distributed
Collaborative Visualization. In Proceedings
of Theory and Practice of Computer
Graphics, 171-178, Eurographics UK.
Dyer, D.S. (1990), A dataflow toolkit for
visualization, IEEE Computer Graphics
and Applications, 10(4), 60-69.
Haber, R.B. and D.A. McNabb (1990),
Visualization Idioms: A Conceptual Model for Scientific Visualization Systems. In
Visualization In Scientific Computing,
Shriver, B., Neilson, G.M., and Rosenblum, L.J., Eds, IEEE Computer Society Press, 74-93.
McCormick, B.H., T.A. de Fanti and M.D. Brown
(1987), Visualization in Scientific
Computing, Computer Graphics, 21(6).
Marshall, R., J. Kempf, S. Dyer and C. Yen
(1990), Visualization methods and
simulation steering for a 3D turbulence
model for Lake Erie, ACM SIGGRAPH
Parker, S.G. and C.R. Johnson (1995), SCIRun: a scientific programming environment for
computational steering, in Proceedings of
ACM IEEE Supercomputing, 2, 1419-1439,
IEEE.
Parker, S.G., M. Miller, C. D. Hansen, and C. R. Johnson (2000), Computational Steering and the SCIRun Integrated Problem Solving
Environment, In Proceedings of Scientific
Visualization - Dagstuhl `97, Hans Hagen, ed., 267-276.
Pickles, S., R. Haines, R.L. Pinning and A. Porter (2004), Practical tools for computational
steering, in Proceedings of UK e-Science
All Hands Meeting, available at:
http://www.allhands.org.uk/2004/proceedin gs/index.html.
Upson, C., T. Faulhaber, D. Kamins, D. Laidlaw, D. Schlegel, J. Vroom, R. Gurwitz and A. Van Dam (1989), The Application Visualization System: A computational environment for scientific visualization.
IEEE Computer Graphics and Applications,
9(4), 30-42.
Van Liere, R., J.D. Mulder and J.J. van Wijk (1997), Computational steering, Future Generation Computer Systems, 12 (5), 441-450.
Walton, J.P.R.W. (2005), NAG’s IRIS Explorer, in
Visualization Handbook (C.D. Hansen and C.R. Johnson, eds), Elsevier.
Wang, H., K. Brodlie, J. Handley and J. Wood
(2006), Service-oriented approach to
collaborative visualization, in Proceedings
of UK e-Science All Hands Meeting,
available at:
http://www.allhands.org.uk/2006/proceedin gs/index.html.
Wood, J.D., H. Wright and K.W. Brodlie (1997),
Collaborative Visualization. In Proceedings
of IEEE Visualization '97. Yagel, R., and Hagen, H., Eds, 253-259.
Wood, J.D. and H. Wright (2005), Steering via the image in local, distributed and collaborative
settings, in Proceedings of UK e-Science
All Hands Meeting, available at:
http://www.allhands.org.uk/2005/proceedin gs/index.html.
Wood, J.D., M. Riding and K.W. Brodlie (2007), A user interface framework for Grid-based
computational steering and visualization. In
Proceedings of UK e-Science All Hands Meeting (to appear).
Wright, H. (2004), Putting visualization first in
computational steering, in Proceedings of
UK e-Science All Hands Meeting, available
at: