DEVELOPMENT OF VALIDATED UV SPECTROSCOPIC, HPTLC AND RP-HPLC METHODS FOR THE SIMULTANEOUS ESTIMATION OF
LEDIPASVIR AND SOFOSBUVIR IN PURE AND FIXED DOSE COMBINATION
A Dissertation submitted to
THE TAMIL NADU Dr. M.G.R. MEDICAL UNIVERSITY, CHENNAI – 600 032
In partial fulfilment of the requirements for the award of the Degree of
MASTER OF PHARMACY
IN
BRANCH–V- PHARMACEUTICAL ANALYSIS
Submitted by S.SATHESHKUMAR REGISTRATION No. 261530104
Under the guidance of
Dr. A. SUGANTHI, M.Pharm., Ph.D., Department of Pharmaceutical Analysis
COLLEGE OF PHARMACY
This is to certify that the dissertation entitled “Development of Validated UV Spectroscopic, HPTLC and RP-HPLC Methods for the Simultaneous Estimation of Ledipasvir and Sofosbuvir in Pure and
Fixed Dose Combination” being submitted to The Tamil Nadu Dr.M.G.R Medical University, Chennai was carried out by
S.SATHESHKUMAR in the Department of Pharmaceutical Analysis, College of Pharmacy, Sri Ramakrishna Institute of Paramedical Sciences, Coimbatore, under my direct supervision and guidance.
Dr. A. SUGANTHI, M.Pharm., Ph.D., Associate Professor, Department of Pharmaceutical Analysis,
College of Pharmacy, SRIPMS,
Coimbatore-641 044. Place: Coimbatore
CERTIFICATE
This is to certify that the dissertation entitled “Development of Validated UV Spectroscopic, HPTLC and RP-HPLC Methods for the Simultaneous Estimation of Ledipasvir and Sofosbuvir in Pure and
Fixed Dose Combination” being submitted to The Tamil Nadu Dr.M.G.R Medical University, Chennai was carried out by
S.SATHESHKUMAR in the Department of Pharmaceutical Analysis, College of Pharmacy, Sri Ramakrishna Institute of Paramedical Sciences, Coimbatore, under the supervision and guidance of Dr. A. Suganthi, M.Pharm., Ph.D., Associate Professor, Department of Pharmaceutical Analysis, College of Pharmacy, Sri Ramakrishna Institute of Paramedical Sciences, Coimbatore.
Dr. T. K. RAVI, M. Pharm., Ph.D., FAGE., Principal & HOD, Department of Pharmaceutical Analysis,
College of Pharmacy, SRIPMS,
Coimbatore-641 044. Place: Coimbatore
It’s my honour to thank everyone personally who have stood by my side for the completion of my project work and without whose support I would have found it difficult to finish the work.
First and foremost I express my heartfelt gratitude to my lovable respected guide for her guidance, constant support in all aspects Dr.A.Suganthi, M.Pharm., Ph.D., Associate Professor, Department of Pharmaceutical Analysis for her remarkable guidance, valuable suggestions and also sparing her time for me whenever needed throughout the work.
I also express gratitude to our beloved Principal and Head of the Department of Pharmaceutical Analysis Dr.T.K.Ravi, M.Pharm., Ph.D., FAGE., for providing every need from time to time to complete the research work.
I extol my gratitude and respectful regards to our Managing Trustee,
Thiru.R. Vijayakumar and the Management of SRIPMS for providing complete facilities required for the work.
My solemn thanks to my dear teachers, Dr. M.Gandhimathi, M.Pharm., Ph.D., Dr.Susheel John Varghese, M.Pharm., Ph.D., Dr. Jayaprakasam,
M.Pharm., Ph.D., Mrs.Sangeetha, M.Pharm (Ph.D)., Department of Pharmaceutical Analysis and Dr. K. Asok Kumar, M. Pharm., Ph.D., Professor & Head, Department of Pharmacology for their timely help during the course of the work.
I sincerely thank to Mr.Sorna Kumar.N and Dr. Jayaprakasam
providing drug for my project work.
Hariharshan, Nadha kumar, Rittu, Naseem, Sneha who have helped me during my project work, their valuable support and advice at all the time.
I also thank to my seniors Dhivya, Veerapandiyan, Arthi, Sangeetha, Arya, Aju, Liji, Sumithra, Aravind and Gopi.
Above all I dedicate myself before the constant love and encouragement given to me by my beloved grandmother and Parents K.Subamal, J.Rani, E.Sasi
and S.Jansirani, and my lovable caring sweet uncle K.Jaishankar who have been the backbone of all my achievements .
CHAPTER NO.
TITLE PAGE
NO.
LIST OF ABBREVIATIONS
I INTRODUCTION 1
II LITERATURE REVIEW 20
III AIM AND OBJECTIVE 22
IV DRUG PROFILE 23
V MATERIALS AND INSTRUMENTS 26
VI EXPERIMENTAL SECTION
28 Development Of Validated UV Spectroscopic
Methods For The Simultaneous Estimation Of Ledipasvir And Sofosbuvir In Bulk And Formulation
Development And Validation Of HPTLC Method For The Simultaneous Determination Of Ledipasvir And Sofosbuvir In Bulk And Formulation
31
Development And Validation Of RP-HPLC Method For The Simultaneous Determination Of Ledipasvir And Sofosbuvir In Bulk And Formulation
37
VII RESULTS AND DISCUSSION 44
VIII SUMMARY AND CONCLUSION 150
ABBREVIATIONS
LEDI - Ledipasvir
SOFO - Sofosbuvir
Hrs - Hours
HPLC - High Performance Liquid Chromatography
HPTLC - High Performance Thin Layer Chromatography
ICH - International conference on harmonization
LOD - Limit of detection
LOQ - Limit of quantification
min - Minute
RP-HPLC - Reverse phase high performance liquid chromatography
RSD - Relative standard deviation
UV - Ultra violet
AS - Asymmetric factor
gm - Gram
M - Molar
Mg - Milligram
mL - Millilitre
mM - Millimolar
mm - Millimeter
ng - Nanogram
Rf - Retardation factor
Rs - Resolution
Rt - Retention time
Tf - Tailing factor g - Microgram L - Microlitre
Introduction
INTRODUCTION
[1-9]Pharmaceutical analysis may be defined as the application of analytical
procedures used to determine the purity, safety and quality of drugs and chemicals.
Most manufacturing industries rely upon both qualitative and quantitative chemical
analysis to ensure that the raw materials used meet certain specifications, and also
to check the quality of the final product. The examination of raw materials is carried
out to ensure that there are no unusual substances present which might be
deleterious to the manufacturing process or appear as a harmful impurity in the final
product. The final manufactured product is subjected to quality control to ensure
that its essential components are present within a pre-determined range of
composition, whilst impurities do not exceed certain specified limits.
Reasons for developing newer analytical methods for drugs:
Marketed drug may not be official in pharmacopoeias.
Literature search may not contain complete analytical procedure for such drugs.
No proper method may be available for drug in the form of formulation due to interference caused by pharmaceutical excipients.
Procedures for the estimation of drug in biological fluids may not be
available.
Analytical techniques may not be available for the drugs in
combination with other drugs.
Expenses may be more for reagents and solvents used in existing
procedures.
There may be difficulties in extraction and separation process and
Introduction
Analytical Techniques
The instrument techniques employed for the drug analysis can be
categorized into following techniques such as:
Spectrophotometric techniques
Electrochemical techniques
Chromatographic techniques
Hyphenated techniques
Miscellaneous techniques
UV-VISIBLE SPECTROSCOPY
The technique of UV-Vis spectrophotometry is one of the most frequently
employed in pharmaceutical analysis. It involves the measurement of amount of
ultraviolet (190-380 nm) or visible (380-800 nm) radiation absorbed by a substance
in solution. Absorption of light in both the ultraviolet and visible regions of the
electromagnetic spectrum occurs when the energy of the light matches that required
to induce in the molecule an electronic transition and its associated vibrational and
rotational transitions.
Many molecules absorb ultraviolet or visible light. The absorbance of a
solution increases as the attenuation of beam increases. Absorbance is directly
proportional to the absorptivity, a, path length, b, and the concentration, c, of the
absorbing species. Beer's Law states that
A = abc
Optimum conditions for spectrophotometric measurement
In developing an analytical method based on UV visible spectrophotometry
most appropriate sample and instrumental conditions are required. The accuracy
and precision of spectrophotometric measurements depend on the intensity of stray
light and the choice of sample conditions(solvents, concentration and path length)
Introduction
Selection of solvent
The choice of solvent is governed by the solubility of absorbing substance
and by the absorption of the solvent at the analytical wavelength. The solubility of
the substance in polar and non-polar solvents can often be predicted from a
consideration of its chemical structure.
Selection of analytical wavelength
In spectrophotometer the wavelength of maximum absorbance is selected
by wavelength scan, the wavelength at which the maximum absorbance was
attained when scanned in the range of 200-400 nm was selected as detection
wavelength for the method.
SIMULTANEOUS EQUATION METHOD
If a sample containing two absorbing drugs (X and Y) each of which
absorbs at the λmax of the other , it may be possible to determine both drugs by
simultaneous equation method(vierodt’s method.
Cx = A2ay1- A1ay2 / ax2ay1- ax1 ay2
Cy = A2ax2- A1ax1 / ax2ay1- ax1 ay2
Where,
Cx and Cy = Concentration of both drug respectively
A1 and A2 = Absorbance’s of the unknown sample at λ1 and λ2 respectively
ax1 and ax2= Absorptivity’s of the unknown sample (x)at λ1 and λ2 respectively
ay1 and ay2= Absorptivity’s of the unknown sample(y) at λ1 and λ2 respectively
The criteria are satisfied only when the λmax of the two components are
reasonably dissimilar and additional criterion is that the two components do not
Introduction
DERIVATIVE SPECTROPHOTOMETRY
Derivative spectrophotometry is mainly used in the process of conversion
of a simple spectrum in to its first, second or higher order derivative spectrum. The
transformations that occur in the derivative spectra are understood by reference to
a Gaussian band which represents an ideal absorption band.
The second derivative (D2) spectrum is a plot of the d2A/d λ2 vs. λ. It is
characterized by two satellite maxima and an inverted band of which the minimum corresponds to the λmax of the fundamental band.
These spectral transformations confer two principal advantages on
derivative spectrophotometry.
1. Derivative spectrum shows better resolution of overlapping bands than the
fundamental spectrum and may permit the accurate determination of the λ
max of the individual bands,
2. Derivative spectrophotometry discriminates in favour of substances of
narrow spectral bandwidth against broad bandwidth substances.
The substances of narrow spectral bandwidth display larger derivative
amplitudes than those of broad bandwidth substances.
These advantages of derivative spectrophotometry, enhanced resolution and
bandwidth discrimination, permit the selective determination of certain absorbing
substances in samples, and most importantly, to reduce the effects of interference
Introduction
INSTRUMENTATION OF UV-VISIBLE SPECTROSCOPY
CHROMATOGRAPHY
Chromatography is defined as a method of separating a mixture of
components into individual components through equilibrium distribution between
two phases. The technique of chromatography is based on the differences in the rate
at which the components of a mixture move through a porous medium (called
stationary phase) under the influence of some solvent or gas (called moving phase).
The chromatographic method of separation, in general, involves the
following steps:
Adsorption
Separation of the adsorbed substances by the mobile phase.
Recovery of the separated substances by a continuous flow of the mobile phase; the method being called elution.
Qualitative and quantitative analysis of the eluted substances.
HPLC and HPTLC comes under the classification of liquid chromatography
Introduction
HIGH PERFORMANCE THIN LAYER CHROMATOGRPHY
HPTLC is a versatile separation powerful, reliable and efficient method of
quantitative and qualitative analysis, HPTLC can simultaneously handle several
samples even of divergent nature and composition supporting several analysts at a
given time. HPTLC is the most simple separation technique today available to the
analyst. It is considered as a time machine that can speed up your work and allows
you to do many things at a time usually not possible with other analytical
techniques.
The basic difference between conventional TLC and HPTLC is particle and
pore size. In HPTLC high performance grade of silica in which the particle are small
about 5µm and very uniform in size are used. The high performance silica gel gives
more efficient and reproducible separation than conventional grade of silica. The
plates are smaller and the development time is shorter.
Principle
HPTLC is one of the most widely used methods for both quantitative and
qualitative analysis. The principle of separation is adsorption. The mobile phase
flows through because of capillary action. The components are separated based on
the affinity of the components towards the stationary phase.
Advantages of HPTLC:
Visual chromatogram and simplicity
Multiple sample handling
Quantification of crude drugs
Simultaneous analysis of samples
Small quantity of mobile is required
Introduction
Various steps involved in HPTLC chromatography
Selection and optimization Pre-washing
of mobile phase of pre-coated plates
Saturation of chamber pre-conditioning of layer
UV-Visible/fluorescent
Selection of sorbent layers
Sample and standard preparation
Application of standard and the sample
Chromatographic development
Quantitative evaluation Detection of analytes
Introduction
There are different HPTLC plates available:
Hand-made plates(self-prepared layers)
Pre-coated plates
Polyester sheets
Glass support
Aluminium sheets
Plate size
Pre-coated HPTLC plates in size of 20×20 with aluminium or polyester
support are usually procured mainly for economic reasons. These plates can be cut
into size and shape to suit a particular analysis.
Sample preparation
Proper sample preparation is an important pre-requisite for successful
chromatographic separation. The sample preparation procedure is to dissolve the
dosage form with complete recovery of intact compounds of interest and minimum
of matrix with a suitable concentration of analytes for direct application on the
HPTLC plate.
Choice of solvent for the sample
It should dissolve the analytes.
It should be reasonably volatile.
It should have low viscosity.
It should wet the sorbent layer.
Sample application
This is the most critical step for obtaining good resolution for quantification
by HPTLC. Automatic application devices are recommended for quantitative
analysis. The advantages of application of sample as band are even distribution of
Introduction
Chamber saturation:
Chamber saturation has pronounced influence on the separation profile.
When the plate is introduced into an unsaturated chamber, during the course of
development, the solvent evaporates from the plate mainly at the solvent front.
Therefore larger quantity of the solvent shall be required for a given distance, hence
resulting in increase in Rf values. If the tank is saturated prior to development,
solvent vapours soon get uniformly distributed throughout the chamber.
Chromatographic development
The precoated plate then placed in the saturated chamber containing
mobile phase and allowed to run the desired running distance and then kept out for
drying.
Detection:
After completion of the development process the plate is removed from the
chamber and dried to remove the mobile phase completely. The zone can be
visualized by various physical and chemical methods. There is apparently no
difficulty in detecting coloured substances or colourless substances absorbing in
shortwave ultraviolet region. The substances which do not have such properties
have to be transferred into detectable substances by means of using
chromatographic reagents. Detection under UV light is the first choice and
Introduction
HIGH PERFORMANCE LIQUID CHROMATOGRAPH
A variety of methods are available for analysing pharmaceutical compounds;
however HPLC is currently the method of choice for the analysis of these compounds.
HPLC offers high performance over ambient pressure or low pressure liquid
chromatography.
High performance liquid chromatography is used in analytical development to
quantitate the active pharmaceutical ingredient (API) and to evaluate impurity and
degradation product profiles of drugs substances and drug products. Additional uses of
HPLC include the determination of content uniformity of dosage forms, monitoring of
dissolution profiles, determination of antioxidant and microbial preservative content
and support of cleaning validations. Separation of these types require only a monitoring
of one, or a limited number of predefined compounds. A significantly larger challenge
is presented in the composite assays of drug substances and drug products where the
goal is to quantitate API and relevant impurities and degradation products in a single
chromatographic run.
The development of any new or improved method usually tailors existing
approaches and instrumentation to the current analyte, as well as to the final needs or
requirements of the method. Method development usually requires selecting the
requirements and deciding on what type of instrumentation to utilize at the
development stage, decisions regarding
Choice of column,
Mobile phase,
Detector(s) and
Method of quantitation must be addressed.
Introduction
Goals for new or improved HPLC method might include the following:
1. Qualitative identification; the specific analyte(s) of interest, providing some
structural information to confirm general behaviour( i.e. retention time, pH)
2. Quantitative determination; at trace level when necessary ( i.e. accurate, precise
and reproducible in any laboratory setting when performed according to
established procedures).
3. Ease of use, ability to be automated, high sample throughout and rapid sample
turn around time.
4. Sample preparation that minimizes time, effort, materials and volume of sample
consumed.
The following criteria are to be met for developing method:
i. For drug substances
Methods should separate the API, synthetic process impurities, and drug
substances and degradation products. Methods should be able to detect impurities and
degradation products present at level greater than 0.05% relative to the API. Impurities
and degradation products present at the levels greater than 0.1% should be identified
Introduction
ii. For drug products
Methods should separate the API, drug products degradation products from
excipients. Drug products methods are not required to monitor synthetic process
impurities, unless they are also drug product degradation products. Methods should be
able to detect degradation products present at level greater than 0.1% relative to API.
Degradation products present at level greater than 0.2% should be identified and
specifications should be placed on limits.
Types
Most commonly used methods in chromatography are as follows:
Normal–phase chromatography:
Normal phase chromatography depends upon the interaction of stationary phase’s polar surface with polar parts of the sample molecules.
Reversed-phase chromatography:
The mechanism is retention by interaction of stationary phase’s non-polar
hydrocarbon chain with non-polar parts of the sample molecules.
Reversed phase ion-pair chromatography:
The technique is based on ionic sample molecules that are ionically bound
to an ion-pair reagent. The ion-pair reagent contains an unpolar part suitable for
interaction with the unpolar hydrocarbon chain of the stationary phase.
Ion-exchange chromatography:
Ion-exchange chromatography is due to the retention by reversible ionic
bonds to charged groups on the stationary phase.
System suitability parameters
Introduction
Plate number (N):
The column plate number (N) is an important characteristic of a column. N
defines the ability of the column to produce sharp, narrow peaks for achieving good
resolution of band pairs with small values.
N = 13500 L (cm)
dp (µm)
Where, L = Column length
TR = Band retention time
dp = Diameter of the particle
Peak asymmetry and peak tailing:
Peak shape is important in method development. Peaks with poor symmetry
can result in:
* Inaccurate plate number and resolution measurement
* Imprecise quantitation
* Degraded resolution and undetected minor bands in the peak tail
* Poor retention reproducibility
A useful and practical measurement of peak shape is the peak asymmetry
factor, As. Peak asymmetry is measured at 10% of full peak height. Good columns
produce peaks with As values of 0.95 to 1.1.
Another useful way to define peak shape is the tailing factor and is
calculated at 5% of full peak height.
Peak asymmetry factor = B/A
Introduction
Where, A = Distance between the perpendicular connecting the baseline to
the peak maximum and the earliest eluting portion of the curve
B = Distance between the perpendicular connecting the baseline to the
peak maximum and the latest eluting portion of the curve
Retention:
The retention of a drug with a given packing material and eluent can be
expressed as retention time or retention volume, but both of this are dependent on
flow rate, column length and column diameter. The retention is best described as a
column capacity ratio (k), which is independent of these factors. The column
capacity ratio of a compound (A) is defined as
o o A o o A A
t
t
t
V
V
V
k
Where, VA = Elution volume of A
V0 = Elution volume of a non-retained compound (void volume)
Resolution:
Measure of quality of separation of adjacent bands and it is calculated
from width and retention time of two peaks or separation of two peaks.
Introduction
Where, t1 and t2 = Retention time of first and second adjacent bands for
the latest and the earliest eluting peak
W1 and W2 = Baseline bandwidth
RS≥ 1 = Components completely separated
RS≤ 1 = Component overlap
Capacity Factor (k’):
Capacity factor is the measure of position of a sample peak in the
chromatogram. It is a parameter which specifies the extent of the delay of a
substance to be separated. It depends upon stationary phase, mobile phase,
temperature and quality of column packing.
For good chromatographic performance with isocratic separation, k’ value should be in the range of 1-10. If k’ is less than 1; the bands are inadequately
separated from unretained material eluting at t0and if k’ is more than 10; separation
takes too long and bands broadened.
k’1 = tR1– t0 /t0 ,
k’2 = tR2– t0 / t0
Where, tR= Retention time
t0 = Void volume
Separation Factor (α):
Separation factor is also known as selectivity. It is the measure of peak
spacing and is expressed as
1 2
K
K
Introduction
FORCED DEGRADATION STUDIES
Chemical stability of pharmaceutical molecules is a matter of great concern
as it affects the safety and efficacy of the drug product. The FDA and ICH guidance’s
state the requirement of stability testing data to understand how the quality of a drug
substance and drug product changes with time under the influence of various
environmental factors. Knowledge of the stability of molecule helps in selecting
proper formulation and package as well as providing proper storage conditions and shelf
life, which is essential for regulatory documentation. Forced degradation is a process
that involves degradation of drug products and drug substances at conditions more
severe than accelerated conditions and thus generates degradation products that can
be studied to determine the stability of the molecule. The ICH guideline states that
stress testing is intended to identify the likely degradation products which further
helps in determination of the intrinsic stability of the molecule and establishing
degradation pathways, and to validate the stability indicating procedures used.
Forced degradation studies provide knowledge about possible degradation
pathways and degradation products of the active ingredients and help to elucidate
the structure of the degradants. Degradation products generated from forced
degradation studies are potential degradation products that may or may not be
formed under relevant storage conditions but they assist in the developing stability
indicating method. It is better to start degradation studies earlier in the drug
development process to have sufficient time to gain more information about the
stability of the molecule. This information will in turn help improve the formulation
manufacturing process and determine the storage conditions. The aim of any
strategy used for forced degradation is to produce the desired amount of degradation
Introduction
OBJECTIVES OF FORCED DEGRADATION STUDIES
Forced degradation studies are carried out to achieve following purposes:
To establish degradation pathways of drug substances and drug products.
To differentiate degradation products that is related to drug products from
those that are generated from non-drug product in a formulation.
To elucidate the structure of degradation products.
To determine the intrinsic stability of a drug substance in a formulation.
To reveal the degradation mechanisms such as hydrolysis, oxidation,
thermolysis or photolysis of the drug substance and drug product.
To establish stability indicating nature of a developed method.
To understand the chemical properties of drug molecules.
To generate more stable formulations.
To produce a degradation profile similar to that of what would be observed
in a formal stability study under ICH conditions.
To solve stability related problems.
The ICH guidelines entitled “stability testing for new drug substance and products” (Q1A) requires that stress testing is carried out to elucidate the inherent stability characteristics of temperature, humidity, where appropriate, oxidative
Introduction
ANALYTICAL METHOD VALIDATION
The work presented is validated by ICH guidelines Q2 (R1). The validation
parameters being linearity, precision, accuracy, limit of detection, limit of
quantification and robustness.
Specificity:
Specificity is the ability of the method to accurately measure the analyte
response in the presence of all the potential sample components. The response of
the analyte in test mixtures containing the analyte and all the potential sample
components is compared with the response of a solution containing only the analyte.
Linearity:
The ability of the procedure to obtain results of the test directly proportional
to the concentration of the analyte present in the sample. This will result in a linear
relationship. This relationship is evaluated by statistical methods. To obtain
linearity a minimum of 5 concentrations are needed. The parameters to be calculated
are coefficient correlation, y intercept and slope.
Range:
The range of an analytical method is the concentration over which
acceptable accuracy, linearity, and precision are obtained in practice; the range is
determined using data from the linearity and accuracy studies.
Accuracy:
The accuracy of an analytical procedure expresses the closeness of
agreement between the value which is accepted either as a conventional true value
or an accepted reference value and the value found.
Precision:
The precision of an analytical method is the amount of scatter in the results
Introduction
a) Reproducibility
When the subject method is carried out by different analysts of different
laboratories using different experimental conditions using the samples from same
homogenous batch.
b) Intermediate precision
It is determined by relating the results of a method within the same
laboratory but different days, analysts, equipments and reagents.
Limit of Detection (LOD)
The detection limit of an individual analytical procedure is the lowest
amount of analyte in a sample which can be detected but not necessarily quantitated
as an exact value.
DL=3.3σ/S
Limit of Quantitation (LOQ)
The quantitation limit of an individual analytical procedure is the lowest
amount of analyte in a sample which can be quantitatively determined with suitable
precision and accuracy. The quantitation limit is a parameter of quantitative assays
for low levels of compounds in sample matrices, and is used particularly for the
determination of impurities and/or degradation products.
DQ=10σ/S
Robustness
The robustness of a method is its ability to remain unaffected by small
changes in parameters such as percentage organic concentration and pH of mobile
LITERATURE REVIEW
[10-15] Vikas p. et al. (2016) developed a validated RP-HPLC method for the
determination of sofosbuvir in pure form. Separation of Sof was successfully
achieved on a Hisil C18 (4.6 x 250mm, 5 μm) Waters or equivalent in an isocratic
mode utilizing Phosphate Buffer (4.0 pH): Methanol (50:50%v/v) at a flow rate of
0.8 mL /min and eluate was monitored at 262 nm, with a retention time of
1.01 minutes. The method was validated and the response was found to be linear
in the concentration range of 5 μg/mL to 30μg/mL.
Devilal.j. et al. (2016) described a RP- HPLC method for the
determination of ledipasvir in bulk drug form. The procedure involved use of
isocratic elution where the stationary phase was a ODS column (250 mm, 4.6 mm, 5 μm), mobile phase 0.05% triflouroacetic acid in methanol and 0.05% triflouroacetic acid in acetonitrile (55:45). pH of the chromatographic system was
maintained at 3.0, flow rate 1 ml/minute, eluent was monitored by PDA detector
wavelength at 270 nm. Retention time was found to be 2.749 minutes, regression
analysis shown the value of correlation coefficient 0.999. Value for limit of
detection (LOD) was 1.064μgm/ml and limit of quantification (LOQ) was
3.224 μg/ml. Linearity range was designed 15μg/ml to 300μg/ml for Ledipasvir. Accuracy study revealed percentage recovery 99.81%-100.10%.
Chenwei.P. et al. (2015) established a UPLC–MS/MS method for the
Simultaneous determination of ledipasvir, sofosbuvir and its metabolite in rat
plasma and its application to a pharmacokinetic study. The analytes and the
internal standard (diazepam) were separated on an Acquity UPLC BEH C18
chromatography column (2.1 mm × 50 mm, 1.7 m) using gradient elution with a
mobile phase of acetonitrile and 0.1% formic acid in water at a flow rate of
0.4 mL/min. The detection was performed on a triple quadrupole tandem mass
Nebsen.M. et al. (2016) has developed a LC–MS/MS method for
Characterization of Forced Degradation Products of Sofosbuvir. However, it was
stable under thermal and neutral hydrolysis stress conditions. Chromatographic
separation of the drug from its degradation products was performed on Inertsil
ODS-3 C18 (250mm × 4.6mm i.d., 5 μm) column using a methanol:water
70:30 (v/v).
Elkady.F. et al. (2016) presented a LC-MS/MS Method for the
Simultaneous Extraction and Determination of Sofosbuvir and Ledipasvir in
Human Plasma. The chromatographic separation of the three analytes was
achieved within 2.8 min by an isocratic mobile phase consisting of 10 mM
ammonium acetate, (pH 4.0) by acetic acid–acetonitrile–0.1% methanolic formic
acid (12 + 25 + 63, v/v/v) flowing through a C18 Zorbax eclipse plus column
(5 μm, 100 × 4.6 mm; Agilent). Linearity range was found to be 0.5 to 2500 and
5 to 2100 ng/mL for sofosbuvir and ledipasvir, respectively.
Swain.D. et al.(2017) analysed a LC-QTOF-MS/MS and NMR methods
for the forced degradation behaviour of ledipasvir. Identification of major
degradation products using Ledipasvir degraded in hydrolytic (acid, alkaline and
neutral) and oxidative stress conditions. The drug was found to be stable in
thermal and photolytic conditions. The degradation products obtained were well
separated using an HPLC C18 stationary phase (150 x 4.6 mm, 5 μ) and mobile
phase composed of formic acid/acetonitrile in gradient elution mode. All the
degradation products were characterized using tandem mass spectrometry with a
AIM AND OBJECTIVE
[16-18]Hepatitis C is an infectious disease caused by the hepatitis C virus (HCV)
that primarily affects the liver. During the initial infection people often have no
symptoms. Occasionally a fever, dark urine, abdominal pain and yellow tinged
skin occurs. The virus persists in the liver 75%- 85%.
There is no vaccine currently against hepatitis C (however research in this
area is ongoing). Antiviral medicines such as ledipasvir and sofosbuvir (cimivir-L
tablet) can cure more than 95% of persons with hepatitis C, which is lifesaving
drug. An estimated 143 million people (2%) worldwide are infected with hepatitis
C as of 2015. It occurs most commonly in Africa and central and East Asia. Each
year 3,99,000 people died for hepatitis C.
Literature survey revealed that no Spectrophotometric and HPTLC
methods for the simultaneous estimation of Ledipasvir and Sofosbuvir. This
combination tablet approved by FDA (10, Oct, 2014) which is a lifesaving drug.
Which is not official in any of the pharmacopoeias and hence requires much more
investigation.
Hence an attempt has been made to develop new, simple and economic
and validated methods for the determination of Ledipasvir and Sofosbuvir in bulk
and formulation
Hence, the objectives of the present work is to develop a validated
UV-spectroscopic methods for the simultaneous estimation of ledipasvir
and sofosbuvir in bulk and formulation.
HPTLC method for the simultaneous determination of ledipasvir and
sofosbuvir in bulk and formulation.
RP-HPLC method for the simultaneous determination of ledipasvir and
DRUG PROFILE
[19, 20]Name : Ledipasvir
IUPAC Name : methyl N-[(2S)-1-[(6S)-6-[5-[9,9-difluoro-7-[2-
[(1S,2S,4R)-3-[(2S)-2-(methoxycarbonylamino)-
3-methylbutanoyl]-3-azabicyclo[2.2.1]heptan-2-
yl]-3H-benzimidazol-5-yl]fluoren-2-yl]-1H-
imidazol-2-yl]-5-azaspiro[2.4]heptan-5-yl]-3-
methyl-1-oxobutan-2-yl]carbamate
Empirical Formula : C49H54F2N8O6
Structure Formula :
Molecular Weight : 889.018 g/mol
Description : Slightly yellow solid
Solubility : Freely soluble in methanol.
Bioavailability : 76%
Storage : 25°C
Category : Antiviral agent (Hepatitis C virus)
Name : Sofosbuvir
IUPAC Name : propan-2-yl (2S)-2-[[[(2R,3R,4R,5R)-5-(2,4-
dioxopyrimidin-1-yl)-4-fluoro-3-hydroxy-4-
methyloxolan-2-yl] methoxy-
phenoxyphosphoryl] amino]propanoate
Empirical Formula : C22H29FN3O9P
Structure Formula :
Molecular Weight : 529.458 g/mol
Description : White to off-white solid
Solubility : Freely soluble in methanol.
Bioavailability : 92%
Storage : 30oC
Category : Antiviral agent (Hepatitis C virus)
BRANDS AVAILABLE
Brand names Strength(mg) Manufacturer
Harvoni Ledipasvir 90/sofosbuvir 400 Mylan
Hepcinat Ledipasvir 90/sofosbuvir 400 Natco
Hepcvir-L Ledipasvir 90/sofosbuvir 400 Cipla
Ledviclear Ledipasvir 90/sofosbuvir 400 Abbott
Resof-L Ledipasvir 90/sofosbuvir 400 Dr.Reddy
Cimivir-L* Ledipasvir 90/sofosbuvir 400 Biocon
Sofocure-L Ledipasvir 90/sofosbuvir 400 Emcure
Sofab-LP Ledipasvir 90/sofosbuvir 400 Ranbaxy
Ledihep Ledipasvir 90/sofosbuvir 400 Zydus Cadila
Ledifos Ledipasvir 90/sofosbuvir 400 Hetero
Virpas Ledipasvir 90/sofosbuvir 400 Strides Shasun
MATERIALS AND INSTRUMENTS
Active Pharmaceutical Ingredient (API)
Ledipasvir and sofosbuvir were procured from sequent Labs Pvt. Ltd., Mangalore, India.
Formulation
Cimivir-L tablet, Ledipasvir 90 / sofosbuvir 400 from Biocon
Pharmaceuticals, Bangalore.
Chemicals and solvents used
Water- HPLC grade
Methanol HPLC grade, AR grade
Acetonitrile - HPLC grade
Formic acid- AR grade
Toluene- LR grade
Chloroform- LR grade
Sodium hydroxide- LR grade
Hydrochloric acid- AR grade
Hydrogen peroxide 6 %-LR grade
Hydrogen peroxide 30 %-LR grade
Ammonium acetate
Triethyl amine
Ammonia 25%
Ethyl acetate
Hexane
Orthophosphoric acid
MATERIALS USED
Pre-coated silica gel 60F254 on aluminium sheets were procured from
Merck, Germany.
Hibar, C18 column (250mm×4.0mm, 5μm) column was obtained from
Merck Pvt. Ltd., Mumbai.
INSTRUMENTS USED
1. Shimadzu digital electronics balance
2. Systronics Pvt. Limited, India, pH meter
3. Jasco V-630 UV/ Vis- spectrophotometer
4. Camag HPTLC system (with TLC Scanner-3, Win CATS software and
Linomat 5 as application device)
5. Shimadzu HPLC prominence i LC-2030 liquid chromatography system
with UV-VISIBLE detector and auto sampler injector. Chromatogram were recorded and integrated on PC installed with lab solutions chromatographic sofotware.
DEVELOPMENT OF VALIDATED UV-SPECTROSCOPIC METHODS
FOR THE SIMULTANEOUS ESTIMATION OF LEDIPASVIR AND
SOFOSBUVIR IN BULK AND FORMULATION
Ledipasvir and sofosbuvir is having π electron in its structure and hence
absorbs electromagnetic radiation. UV- spectroscopic methods are simple and suitable to determine ledipasvir and sofosbuviri in pharmaceutical formulation.
SELECTION OF PARAMETERS FOR METHOD DEVELOPMENT:
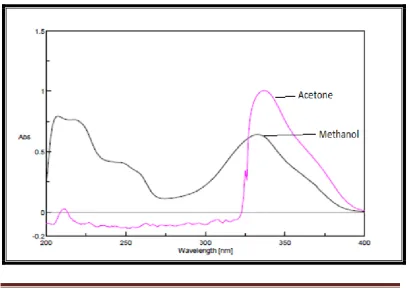
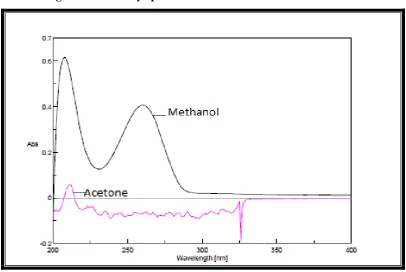
1. SELECTION OF SOLVENT
The solubility of ledipasvir and sofosbuvir were checked in various solvents like methanol and acetone, etc. The one which showed good spectrum and good stability was selected as solvent of choice for the determination of ledipasvir and sofosbuvir.
2. PREPARATION OF STOCK SOLUTION
Ten milligram of pure drug ledipasvir and sofosbuvir were weighed, transferred and made up to 10 ml with methanol in a standard flask previously rinsed with methanol to get concentration of 1000 µg/ml. From the stock 1ml was diluted to 10 ml, to get a concentration of 100µg/ml. Further, the working standard solutions were prepared from 100µg/ml. The prepared stock solution was used for further studies.
3. SELECTION OF WAVELENGTH
VALIDATION
LINEARITY AND RANGE
From the stock solution containing 100µg/ml of ledipasvir about 1 to 4ml and sofosbuvir 1 to 7ml were transferred into 10ml volumetric flasks and the working standards were prepared by making up to the volume using methanol to get concentration of ledipasvir about 10-40µg/ml and sofosbuvir about 10-70µg/ml. The absorbances were noted for all the standard solutions of ledipasvir and sofosbuvir at the selected wavelength. Standards were scanned in
the wavelength range of 200 nm – 400 nm. The linear graph was plotted between
concentrations (µg/ml) versus absorbance. Then it is derivatised to second order derivative and the amplitudes (mm) were measured at ledipasvir 333nm and sofosbuvir 261nm. The respective calibration graphs were prepared by plotting concentration against corresponding amplitude.
PRECISION
Precision of the method was determined by repeating the assay six times. Repeatability was carried out using 20µg/ml for both drugs normal and second order derivative methods. To study intraday precision, it was repeated 3 times on the same day using 20 and 30 µg/ml for both drugs and % RSD was calculated. Similarly the interday precision was performed by repeating the above procedure on different days and average of % RSD was calculated. Precision studies were carried out for both the methods.
RECOVERY STUDIES
LOD AND LOQ:
From the limit of detection and limit of quantification the sensitivity of the method was determined. The LOD and LOQ were calculated using the equation,
LOD = 3.3 × σ/S
LOQ = 10 × σ/S
Where, σ is the standard deviation of y intercept of regression line, & S is slope of calibration curve.
STABILITY STUDIES:
When the prepared solution is exposed to atmosphere, the analytes are likely to decompose; hence it is necessary to conduct stability studies. Stability of the analyte in methanol was studied, at room temperature for 8 hours and in refrigeration for 4 days and absorbance was compared with the absorbance of freshly prepared solution.
APPLICATION OF THE PROPOSED METHODS FOR ANALYSIS OF
FORMULATION:
DEVELOPMENT AND VALIDATION OF HPTLC METHOD FOR THE
SIMULTANEOUS DETERMINATION OF LEDIPASVIR AND
SOFOSBUVIR IN BULK AND FORMULATION
The experimental work consists of optimization of chromatographic
conditions development and validation of HPTLC method of ledipasvir and
sofosbuvir.
1. Selection of plate
A pre-coated silica gel G60 F254 coated on aluminum sheet was selected for the
study.
2. Selection of solvent
Drug should be soluble in the solvent used.
Drug should show stability in the solvent used.
Solvent should be volatile.
3. Selection of wavelength
The sensitivity of HPTLC method depends upon the proper selection of
wavelength for UV detection. An ideal wavelength is that the overlay that give
maximum absorbance and good response for the drug to be selected at the lower
concentration is to be selected. The UV spectrum of ledipasvir and sofosbuvir were
scanned 200-400nm in HPTLC scanner and the isobestic point was selected for the
further study.
4. Optimization of mobile phase system
Initially different solvent systems were tried and A solvent system with
compact spots and good separation has been selected for the study.
5. Selection of ratio of mobile phase system
Different ratios hexane : ethyl acetate : methanol (3:5:2, 8:2:2, 5:3:2,
v/v/v etc) were tried along with few drops of ammoniato get dense compact spots
6. Optimization of chamber saturation
After selection of mobile phase ratio the twin trough chamber was saturated
for 15 minutes to 25 minutes using mobile phase system fix the chamber saturation
time.
7. Preparation of stock solutions
The mixed stock solution of ledipasvir (100µg/ml) and sofosbuvir
(440µg/ml) was prepared using methanol in 10ml volumetric flask.
VALIDATION OF THE METHOD:
The developed method was validated as per ICH guidelines. The validation
of the method was carried out in terms of linearity, accuracy, precision,
repeatability, LOD and LOQ.
LINEARITY AND RANGE:
The linear response for the mixture (ledipasvir and sofosbuvir) was assessed
by spotting different volume of mixed stock solution from 1 to 7 µL on TLC plate.
ACCURACY:
The accuracy study was conducted at 50, 100 and 150% level for the
pre-analysed samples by standard addition method.
PRECISION:
Precision of the method was studied by
Intra-day precision
Inter-day precision
Repeatability precision
Repeatability of sample measurement
Intra-day precision:
Intra-day precision was studied by carrying out the analysis of the standard
drug of two different concentrations for three times on the same day and %RSD
was calculated.
Inter-day precision:
Inter-day precision was studied by carrying out the analysis of the standard
drug of two different concentrations for three different days over a period of one
week and %RSD was calculated.
REPEATABILITY:
Repeatability of sample measurement:
Repeatability of measurement was determined by spotting 300ng/spot of
ledipasvir and 1320ng/spot of sofosbuvir drug solution on a pre-coated TLC plate
and developed the plate was scanned six times and %RSD was calculated.
Repeatability of sample application:
Repeatability of sample application was carried by spotting 6 times of 2µl
of drug solution on pre-coated TLC plate followed by development of plate and
%RSD was calculated.
LIMIT OF DETECTION (LOD) AND LIMIT OF QUANTIFICATION
(LOQ):
The lowest concentration detected (LOD) and lowest concentration
quantified (LOQ) were estimated from the set of five calibration curves used to
determine method linearity.
LOD = 3.3×σ/S and LOQ = 10×σ/S
Where, σ = the standard deviation of y intercepts of regression lines
ROBUSTNESS:
The effect of deliberate variations on method parameters like the
composition of the mobile phase saturation time, development distance spot
scanning time interval, wavelength scan time from spotting to chromatography and
mobile phase volume was evaluated.
SPECIFICITY
The peak purity of ledipasvir and sofosbuvir was assessed by comparing its
respective spectra at the three different levels, that is, peak start (S), peak apex (M)
and peak end (E) positions of the spot.
STABILITY STUDIES:
When the developed chromatographic plate is exposed to atmosphere, the
analytes are likely to decomposed. It is necessary to study the stability of drug on
plate. It was studied by scanning the plate at different time interval and peak areas
were compared with the peak area of freshly scanned plate. The developed plate
was found to be stable for about 24 hours.
ANALYSIS OF FORMULATION
To determine the amount of ledipasvir and sofosbuvir in tablet dosage form
(label claim 90& 400mg per tablet respectively) 20 tablets were weighed, their
average weight was determined, and they were finely powdered. An accurately
weighed powder sample equivalent to 9mg of ledipasvir or 40mg of sofosbuvir was
transferred into a 100ml volumetric flask then added 10ml methanol, followed by
sonication for 10 min and further dilution was made up to the mark with methanol.
The resulting solution was filtered through whatman filter paper (No.1) and two
microliters of the filtered solution (180ng/spot of ledipasvir & 800ng/spot of
sofosbuvir) was applied on the TLC plate followed by development and scanning
STRESS STUDIES
Forced degradation studies for Ledipasvir and Sofosbuvir
For conducting the forced degradation studies, four samples were taken viz.,
the blank solution stored under normal conditions, the blank subjected to stress in
the similar manner as the drug solution, zero time analyte solution which was stored
under normal and the sample subjected to stress treatment. The study was conducted
separately for ledipasvir and sofosbuvir individually and also for combination.
Acid Hydrolysis:
Hundred milligram of ledipasvir and sofosbuvir was weighed accurately and
transferred into 25ml standard flasks separately. To this 10 ml of 0.1M hydrochloric
acid was added and made up to 25ml with methanol. This solution was refluxed for
5 hours at 80˚C. Further 2.5 ml was made up to 10ml (1000µg/ml) for ledipasvir
and sofosbuvir individually and also for mixture.
Alkaline Hydrolysis:
Hundred milligram of ledipasvir and sofosbuvir was weighed accurately and
transferred into 25ml standard flasks separately. To this 10 ml of 0.1M sodium
hydroxide was added and made up to 25ml with methanol. This solution was
refluxed for 5 hours at 80˚C. Further 2.5 ml was made up to 10ml (1000µg/ml) for
ledipasvir and sofosbuvir individually and also for mixture.
Neutral hydrolysis:
Hundred milligram of ledipasvir and sofosbuvir was weighed accurately and
transferred into 25ml standard flasks separately. To this 10 ml of water was added
separately and made up to 25 ml methanol. This solution was refluxed for 5 hours
at 80˚C. Further 2.5 ml was made up to 10ml (1000µg/ml) for ledipasvir and
Oxidative Degradation:
Hundred milligram of ledipasvir and sofosbuvir was weighed accurately and
transferred into 25ml standard flasks separately. To this 10 ml of 6% hydrogen
peroxide was added separately and made up to 25ml with methanol. Further 1 ml
was withdrawn 1 hour once for about 5 hours and Further 2.5 ml was made up to
10ml (1000µg/ml) for ledipasvir and sofosbuvir individually and also for mixture.
Thermal degradation:
Hundred milligram of ledipasvir and sofosbuvir was weighed and
transferred to a petri dish separately. It was then placed in hot air oven at 80ºC for
5 hours then dissolved and made up to 25 ml with methanol. Further 2.5 ml was
taken and made up to 10ml (1000µg/ml) for ledipasvir and sofosbuvir individually
and also for mixture.
Photolytic degradation:
Hundred milligram of ledipasvir and sofosbuvir was weighed and
transferred to a petri dish. It was then exposed to sunlight for about 5 hours. The
drug solution was prepared using methanol. Further 2.5 ml was taken and made up
to 10ml (1000µg/ml) for ledipasvir and sofosbuvir individually and also for
DEVELOPMENT AND VALIDATION OF RP-HPLC METHOD FOR THE
SIMULTANEOUS DETERMINATION OF LEDIPASVIR AND
SOFOSBUVIR IN BULK AND FORMULATION
1. Chromatographic method for separation:
The drug Ledipasvir and Sofosbuvir is polar in nature, RP-HPLC method
was selected as separation technique.
2. Selection of solvent:
The drugs are soluble in acetonitrile and also showed good stability. Hence
methanol was selected as the solvent.
3. Selection of Detection wavelength:
Good analytical separation can be obtained only by careful selection of
wavelength for the detection. This choice requires knowledge of the UV spectrum
of the sample component. A UV spectrum of ledipasvir and sofosbuvir was
recorded in acetonitrile and the overlay have shown acceptable absorbance at
254nm for both drugs and it was selected for the study.
OPTIMIZATION OF CHROMATOGRAPHIC CONDITIONS
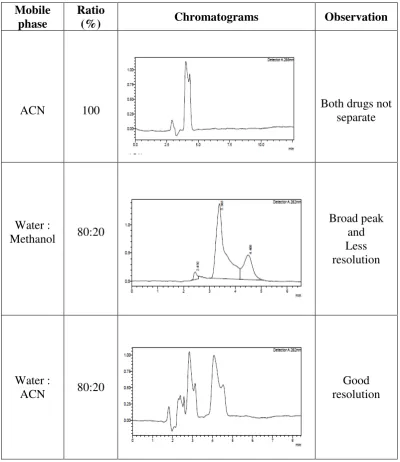
Selection of mobile phase:
Here different mobile phase with different ratios were tried like water:
methanol, water: acetonitrile and orthophosphoric acid buffer and acetonitrile.
Selection of strength of acetic acid:
Different strengths of formic acid such as 0.5%, 1% and 1.5% were tried.
Good peak characteristics was observed for strength of 1% orthophosphoric acid
and hence selected.
Selection of pH of orthophosphoric acid:
The pH which gave the good peak characteristic was selected for the further
study.
Selection of mobile phase ratio:
Different ratio of 1% orthophosphoric acid: acetonitrile tried from which a
ratio of 30:70% v/v gave good resolution and satisfactory peak shapes.
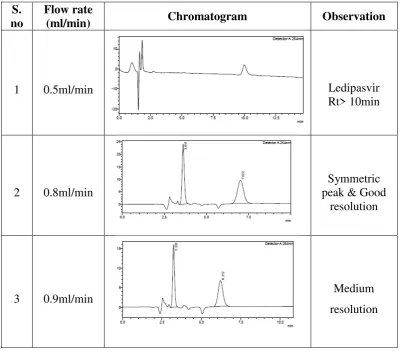
Selection of flow rate:
Keeping all other parameters of mobile phase system constant, the
chromatograms were recorded different flow rates like 0.7, 0.8, 0.9, 1 and 1.1
ml/min were tried. A flow rate which gave good symmetrical peaks and good
resolution.
Chromatographic development procedure:
The HPLC system was stabilized for 60min, by passing mobile phase and
detector was set as 254nm and flow rate of 0.8ml/min was maintained to get a steady
baseline. One blank followed by six replicate of a single standard solution were
VALIDATION OF THE METHOD
The developed HPLC method was validated according to ICH guidelines in
terms of linearity, accuracy, precision, specificity, robustness and LOD and LOQ.
LINEARITY AND RANGE:
The mixed standard stock solution (100µg/ml of ledipasvir and 100µg/ml of
sofosbuvir) was further diluted to get ledipasvir and sofosbuvir concentration in the
range of 1-10µg/ml and 1-10µg/ml respectively. Linearity of the method was
studied by injecting ten concentration of the drug prepared in the mobile phase in
triplicate into the LC system keeping the injection volume constant, The peak areas
were plotted against the corresponding concentration to obtain the calibration
graphs.
ACCURACY:
Accuracy of the method was carried out by applying the method to drug
sample ( ledipasvir and sofosbuvir combination tablet) to which known amount of
ledipasvir and sofosbuvir standard powder corresponding to 50, 100 and 150% of
label claim had been added (standard addition method) mixed and the powder was
extracted and analyzed by running chromatogram in optimized mobile phase.
PRECISION:
The precision of the method was verified by intraday, interday and
repeatability precision studies.
Intra-day precision
Inter-day precision
Intra-day precision:
Intraday precision was determined by injecting standard solutions in
between linearity range (4, 8µg/ml for ledipasvir and 4, 8µg/ml for sofosbuvir) were
injected three times on the same day and % RSD was calculated.
Inter-day precision:
Inter-day precision was determined by injecting standard solutions in
between linearity range (4, 8µg/ml for ledipasvir and 4, 8µg/ml for sofosbuvir) were
injected for three days and % RSD was calculated.
Repeatability:
Repeatability studies were performed by analysis of different concentration
4µg/ml ledipasvir and 4µg/ml of sofosbuvir six times on the same day and %RSD
was calculated.
LIMIT OF DETECTION (LOD) AND LIMIT OF QUANTITATION (LOQ):
The lowest concentration detected (LOD) and lowest concentration
quantified (LOQ) were estimated from the set of five calibration curves used to
determine method linearity.
LOD = 3.3×σ/S
LOQ = 10×σ/S
Where, σ = the standard deviation of y intercepts of regression lines
S = the slope of the calibration curve
SPECIFICITY:
peak purity of ledipasvir and sofosbuvir were determined by comparing the
spectrum at three different regions of the spot i.e. peak start (S), peak apex (M) and
peak end (E). Effect of excipients of formulation was studied for whether it
interfered with the assay.
ROBUSTNESS:
To evaluate robustness of a HPLC method, few parameters were
deliberately varied. The parameters included variation of flow rate, percentage of
acetonitrile in the mobile phase and solvents. The response factors like retention
time, resolution, asymmetric factor for these changed conditions were noted.
STABILITY OF SOLUTION:
The standard solution of ledipasvir and sofosbuvir kept under room
temperature. It was injected periodically. Stability was studied by looking for any
change in retention time, resolution and peak shape, when compared to
chromatogram of freshly prepared solution. The solution was stable 24hrs under
room temperature.
SYSTEM SUITABILITY STUDIES:
The system suitability parameters like peak area, tailing factor, theoretical
plate count, and resolution and retention time were calculated from the standard
chromatograms.
ANALYSIS OF A MARKETED FORMULATION:
To determine the amount of ledipasvir and sofosbuvir in tablet dosage form
(label claim 90& 400mg per tablet respectively) 20 tablets were weighed, their
average weight was determined, and they were finely powdered. An accurately
weighed powder sample equivalent to 9mg of ledipasvir and 40mg of sofosbuvir
was transferred into a 100ml volumetric flask then added 10ml acetonitrile,
acetonitrile. The resulting solution was filtered through whatman filter paper (No.1)
and using syringe 0.45µm. The above stock solution was further diluted to get
sample solution of 0.9µg/ml of ledipasvir and 4µg/ml of sofosbuvir respectively. A
20µl volume of sample solution was injected into HPLC, six times, under the
conditions described above. The peak areas were measured at 254nm.
STRESS STUDIES
Forced degradation studies for Ledipasvir and sofosbuvir:
For conducting the forced degradation studies, four samples were taken viz.,
the blank solution stored under normal conditions, the blank subjected to stress in
the similar manner as the drug solution, zero time analyte solution which was stored
under normal and the sample subjected to stress treatment. The study was conducted
separately for ledipasvir and sofosbuvir individually and also for combination.
Acid Hydrolysis:
Hundred milligram of ledipasvir and sofosbuvir was weighed accurately and
transferred into 25ml standard flasks separately. To this 10 ml of 0.1M hydrochloric
acid was added and made up to 25ml with acetonitrile. These solution was refluxed for 5 hours at 80˚C. Further 0.25 ml was made up to 100ml (10µg/ml) for ledipasvir and sofosbuvir individually and also for mixture.
Alkaline Hydrolysis:
Hundred milligram of ledipasvir and sofosbuvir was weighed accurately
and transferred into 25ml standard flasks separetely. To this 10 ml of 0.1M sodium
Neutral hydrolysis:
Hundred milligram of ledipasvir and sofosbuvir was weighed accurately and
transferred into 25ml standard flasks separetely. To this 10 ml of water was added
separately and made up to 25 ml acetonitrile. This solution was refluxed for 4 hours at 80˚C. Further 0.25 ml was made up to 100ml (10µg/ml) for ledipasvir and sofosbuvir individually and also for mixture.
Oxidative Degradation:
Hundred milligram of ledipasvir and sofosbuvir was weighed accurately and
transferred into 25ml standard flasks separately. To this 10 ml of 6% hydrogen
peroxide was added separately and made up to 25ml with acetonitrile. Further 1 ml
was withdrawn 1 hour once for about 5 hours and Further 0.25 ml was made up to
100ml (10µg/ml) for ledipasvir and sofosbuvir individually and also for mixture.
Thermal degradation:
Hundred milligram of ledipasvirand sofosbuvir was weighed and transferred
to a petri dish separately. It was then placed in hot air oven at 80ºC for 5 hours then
dissolved and made up to 25 ml with acetonitrile. Further 0.25 ml was made up to
100ml (10µg/ml) for ledipasvir and sofosbuvir individually and also for mixture.
Photolytic degradation:
Hundred milligram of ledipasvir and sofosbuvir was weighed and transferred
to a petri dish separately. It was then exposed to sunlight for about 5 hours. The
drug solution was prepared using acetonitrile. Further 0.25 ml was made up to
DEVELOPMENT OF VALIDATED UV-SPECTROSCOPIC METHODS
FOR THE ESTIMATION OF LEDIPASVIR AND SOFOSBUVIR IN
BULK AND FORMULATION
Ledipasvir and sofosbuvir possess chromophoric groups like benzene
extended to carbonyl (=c=o) and alkene (=c=c) functional groups. Amide (-NH)
and hydroxyl(-OH) groups as auxochrome which contribute into strong UV
absorption of the molecule. This character is used for the determination of
ledipasvir and sofosbuvir by UV spectroscopic methods.
Ideal solvent is the one which completely solublize the drug and should
maintain good stability of the drug in solution. Initially solvents like acetone and
methanol were tried, among these spectrum of ledipasvir and sofosbuvir was not
good and smooth but, methanol gave a good absorption spectrum with acceptable
stability and sensitivity. Hence methanol was selected as solvent of choice for
[image:51.595.106.517.459.747.2]further studies. The overlay spectra is shown in the Figure 1a and 1b.
Figure 1b: Overlay spectra of solvent selection of Sofosbuvir
An ideal wavelength is the one that gives good response with maximum
absorbance for the both drug to be detected. The normal UV spectrum of
ledipasvir 333nm and sofosbuvir 261nm were selected as detection wavelength
because the linear response was very good with maximum acceptable absorbance,
but wavelength less than 215nm is not commonly used due to solvent interference.
But the derivatised normal also spectrum showed the max at 333nm for ledipasvir
and 261nm for sofosbuvir which was used for further studies.
The normal spectrum and the derivative spectrum of both drugs for
Figure 2a: Normal spectrum of Ledipasvir (20μg/ml)
Figure 2b: Second order derivative spectrum of Ledipasvir (20μg/ml)
333nm
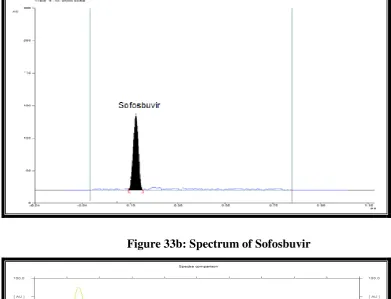
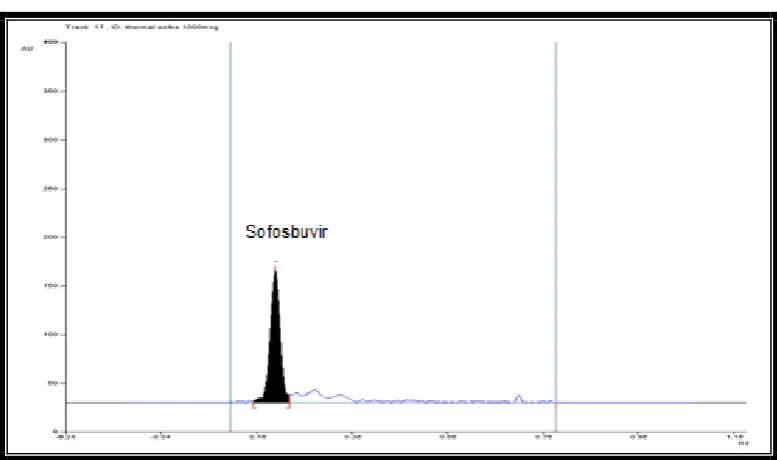
Figure 3a: Normal spectrum of Sofosbuvir (20μg/ml)
Figure 3b: Second order derivative spectrum of Sofosbuvir (20μg/ml)
261nm
VALIDATION PARAMETERS
Linearity and range:
The linear regression analysis showed good correlation coefficient and
good linear relationship over concentration range of ledipasvir 10– 40µg/ml and
sofosbuvir 10- 70 µg/ml, Overlay of normal spectra were shown in figure 4a & 4b
and calibration graph was shown in figure 5a & 5b and the values are tabulated in
table 1a & 1b, respectively.
Figure 4a: Overlay of normal spectrum of Ledipasvir