City, University of London Institutional Repository
Citation
:
Nadimi, S., Fonseca, J. ORCID: 0000-0002-7654-6005, Andò, E. and Viggiani, G. (2019). A micro finite element model for soil behaviour: experimental evaluation for sand under triaxial compression. Géotechnique, doi: 10.1680/jgeot.18.t.030This is the accepted version of the paper.
This version of the publication may differ from the final published
version.
Permanent repository link:
http://openaccess.city.ac.uk/id/eprint/22796/Link to published version
:
http://dx.doi.org/10.1680/jgeot.18.t.030Copyright and reuse:
City Research Online aims to make research
outputs of City, University of London available to a wider audience.
Copyright and Moral Rights remain with the author(s) and/or copyright
holders. URLs from City Research Online may be freely distributed and
linked to.
1
A micro finite element model for soil behaviour: experimental evaluation for
sand under triaxial compression
S. Nadimi1, J. Fonseca2*, E. Andò3, G. Viggiani3
*Corresponding Author
ABSTRACT
This paper evaluates the ability of a combined discrete-finite element approach to replicate the experimental response of a dry sand under triaxial compression. The numerical sample was
created by virtualising the fabric of a Martian regolith-like sand sample obtained from an in-situ
test using X-ray micro Computed Tomography and physical properties of the grains obtained
from laboratory data were used as input. The boundary and contact conditions were defined
according to the experimental test. A key feature of the model is the use of deformable
thin-shell elements to represent the numerical membrane, which allows for a realistic failure mode
and volumetric deformation. The macroscopic response of the numerical simulation is shown to
compare well with the experiment. The contact regions are identified based on their ability to
transmit stress and the evolution of the contact normals is shown to correlate well with the
macro stress evolution. The computed stress fields within each grain are used to identify the
load bearing grains in the assembly, contributing new insights beyond the commonly reported
force chains.
KEYWORDS
Fabric/structure of soils; Particle-scale behaviour; Numerical modelling; Sands; Triaxial test
1
School of Engineering, Newcastle University, UK (formerly City, University of London)
2
Department of Civil Engineering, City, University of London, UK
3
2
INTRODUCTION
Improving computational modelling towards a more realistic description of granular behaviour
is a long standing challenge (e.g. O’Sullivan, 2011; Matsushima & Chang, 2011; Andrade, et al., 2012; Kawamoto, et al., 2018). Nadimi & Fonseca (2018a, 2018b) proposed a micro Finite Element (µFE) model that virtualises the fabric of a natural sand obtained frommicro Computed
Tomography (μCT) to simulate the mechanical response under loading. In this model, the
grain-to-grain interactions are modelled in a framework of combined discrete-finite element method
(Munjiza, 2004). The underlying idea for the development of this μFE model was the need to
better represent soil fabric into numerical modelling. The effect of fabric on the mechanical
response of soil is well-known and has been repeatedly demonstrated in both experiments and
numerical analysis (e.g., Cuccovillo & Coop, 1999; Oda & Iwashita, 1999; Kuwano & Jardine,
2002; Ng, 2004; Fonseca, et al., 2016).
A complete three-dimensional (3D) description of the grains morphologies and their
geometrical arrangement can be effectively obtained from µCT scanning (e.g., Hall, et al., 2010;
Fonseca, et al., 2013; Vlahinić, et al., 2013). Further, by making use of advanced image processing and meshing techniques, the individual grains can be identified in the 3D images and
meshed to create numerical (deformable) grains that replicate the real ones. This aspect is
significant for modelling grain-to-grain contact interaction in an assembly. In fact, contact
response has a strong dependency on the grain shape as demonstrated in Nadimi & Fonseca
(2017) for a series of tests on both silica and carbonate grains. Michalowski, et al. (2017) also showed through single grain experiments that contact response for natural grains does not
follow a Hertzian response due to the effect of shape. In the μFE framework used here, the
contact response originates from the deformation of the grain, which constitutes an important
advance when compared with the rigid body assumption and the associated pre-defined contact
laws used in most discrete element approaches. Another advantage of using deformable grain is
the ability to compute the stress and strain fields within the grain which is critical to the
understanding of yield initiation and crack propagation. Although this enhancement to simulate
breakage is yet to be included in the model, this does not constitute an issue for the simulation
of an assembly of grains under relatively low load as the case reported here.
Here, the μFE model is evaluated against the results of a triaxial compression experiment. One
of the challenges in numerical modelling of triaxial tests is the correct representation of the
boundary conditions, i.e. the sample membrane for the case of a triaxial test (Cui et al., 2007; Cheung & O’Sullivan, 2008). In triaxial compression simulations, the numerical membrane
should enable the specified confining pressure to be applied to the sample, while non-restricting
grain rearrangement. De Bono, et al. (2012) proposed a cylindrical wall formed by bonded spheres to represent the membrane. Using bonded spheres, however, has the drawback of
3
penetrate though the membrane (depending on the relation between the size of the grains and
the size of the bounded spheres). Despite the limitations of using flexible membranes to
simulate triaxial tests in DEM they are still widely used as demonstrated by a number of the
recent studies (e.g., Lu et al., 2018; Khoubani & Evans, 2018; Zhang et al, 2018; Binesh et al.,
2018). An alternative approach using shell elements (Ahmad et al., 1970; Reese et al. 2001; Sze,
2002) to represent the membrane is discussed in this study.
The term ‘force chains’ is widely used in granular mechanics to describe filamentary patterns of
grains transmitting above average contact forces (e.g. Majmudar & Behringer, 2005; Radjai, et al., 2017). Only a handful of studies have used the ‘stress chain’ concept (Gerritsen, et al., 2008; Maeda et al., 2010; Blumenfeld & Ma, 2017). When dealing with irregular shaped grains that are prone to form contact through an area (in some cases, large) rather than a point as for
perfect spheres, the discussion on whether to use force or stress to identify the heavily loaded
grains becomes pertinent. The aims of this paper are twofold. To carry out a numerical
simulation able to replicate the bulk experimental response of a sand under triaxial compression
using as input parameters only experimental measured data. Further, to contribute with
alternative micro-scale measures more suitable for irregular shaped grains, such as the already
mentioned stress-chains but also the concept of active contact based on the transmission of load
rather than geometric-based analysis. The present study investigates, for the first time, the
formation of columns of load bearing grains using both force and stress quantities. In addition,
the evolution of contact forces through deformation is linked to grain kinematics to investigate
the role of force network in the stability of the granular assembly.
THE µFE MODEL
The µFE model used here combines four techniques: (i) image acquisition and processing; (ii)
image-based mesh generation; (iii) finite element solver, and (iv) discrete element solver. The
3D images are acquired using X-ray µCT and the individual grains are segmented using a
watershed approach as described in Kong & Fonseca (2018). The numerical approximation of
the problem starts from discretising an object into a collection of elements and nodes. A
Delaunay refined algorithm is employed to extract the grain iso-surface (Shewchuk, 2014). The
grain is then filled with tetrahedral elements for the sub-volumes bounded by the iso-surfaces to
obtain the 3D mesh. The generated mesh is imported into the combined finite-discrete
numerical domain. More details can be found in Nadimi & Fonseca (2018 a, b).
In the numerical domain, the nodal force includes the contribution from contact forces, internal
strain and external loads. A grain can locally deform depending on the current nodal forces
enabling a stress/strain field to be computed within each individual grain. The body motion for
4
runs in Abaqus finite-element package (Dassault Systèmes, 2014) and is implemented with an
explicit algorithm that uses a dynamic framework.
A CASE STUDY
A case study is presented here to investigate the ability of the μFE approach to reproduce the
experimental behaviour of a sample of sand under triaxial compression. The material tested is a
Martian regolith-like sand also termed Eglin sand (Nardelli et al, 2017). From the microscale
characterisation carried out by Nardelli and co-authors, the median grain size is 1.2 mm and the
constituent grains display various colours from black, to pink-yellow, to grey-transparent
according to their chemical/ mineralogical composition. The average sphericity values vary
between 0.5-0.8 and the roundness are within the rage of 0.4-0.5, according to visual
observations using Krumbein and Sloss chart (Krumbein and Sloss, 1963).
Experiments
The sand specimen with 11 mm diameter and 22 mm height was first compressed isotropically
to 100 kPa and subsequently subjected to displacement controlled axial loading with a strain
rate of 0.1%/min under constant confining pressure. The test was performed inside a µCT
scanner to image the internal structure of the specimen (e.g. Andò, et al., 2012). The sample was prepared by air pluviation and an initial void ratio of 0.56 was measured. The 3D images were
acquired at a voxel size of 15.5 μm, which means that a grain with a median diameter of 1.2 mm
is represented by approximately 70 voxels across its diameter. Following image segmentation,
3,158 individual grains were identified in the specimen.
Numerical modelling
The 3D image of the specimen prior to loading was meshed and each voxel in the images was
converted into Cartesian coordinates. The specimen is represented in the numerical domain by a
total of 10,105,720 elements comprising 3,503,151 nodes. The elastic material model was
assigned to the grain with Young’s modulus E=70 GPa and Poisson ratio ν=0.3. The coefficient
of friction used was of 0.28, obtained from single grain experiments on this material, more
details of the tests can be found in Nardelli et al. (2017). Nardelli and co-authorscarried out a
detailed characterization of the grains according to their mineralogical classes. In addition they
reported an overall mean inter-particle friction angle for all the particles of 17.7±6.9. And this
was the values used here to derive the coefficient of friction since the simulation uses global
values rather that grain specific parameters (something to be developed in future work). The
5
To better replicate the experimental conditions and avoid the limitations of previously used
methods to represent the numerical membrane, deformable triangular thin-shell elements were
used here. The properties of these elements were E=125 MPa and ν=0.49. Their sizes were set
to be lower than those defining the grains and this is an important aspect for a more accurate
modelling at the grain-membrane interface. A standard value of 0.2 mm was used for the
thickness of the membrane. For the top and bottom platens, rigid elements were used. The
numerical sample was first subjected to a confining pressure of 100 kPa and subsequently
axially compressed to 10% strain under the same conditions as the experimental sample.
Comparison of the results
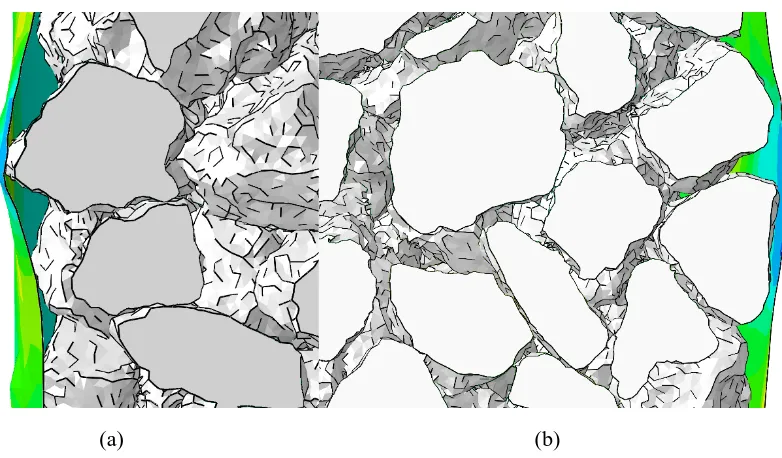
A view of the full numerical sample at the start and at the end of the test (10% axial strain) is
shown in Figs. 1a and 1b, respectively. At the end of the test the specimen shows a slight
barrelled shape and this is in agreement with the experiments, as depicted in Fig. 1c and 1d (at
the stages of 0% and 10% axial strain, respectively). Two local views of the numerical sample
are presented in Fig. 2 to illustrate the ability of the numerical membrane to deform around the
grains under the confining pressure, mimicking the laboratory membrane.
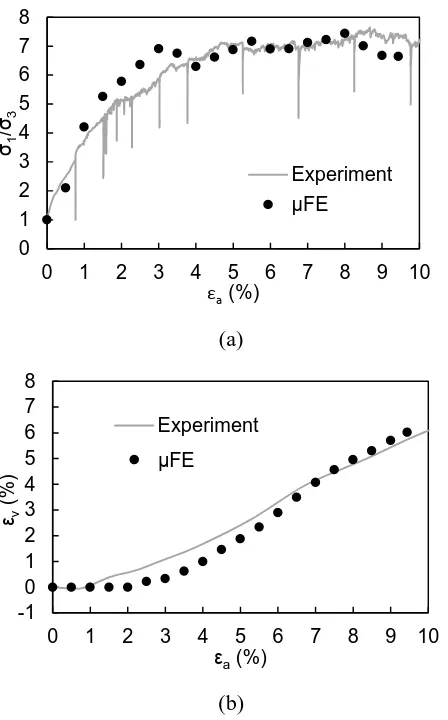
The stress-strain response obtained from the µFE model is compared with the experimental
response in Fig. 3a and the volumetric response is depicted in Fig. 3b. Overall, a good
agreement can be seen. Both the experimental and numerical responses show a strain hardening
phase with the numerical sample being slightly stiffer. This phase is then followed by a plateau
in both experimental and numerical specimens. Regarding the volumetric response, a good
agreement is also observed. In both cases there is an initial phase during which no significant
change in volume occurs, followed by a clear increase in volumetric strain (dilation).
Evolution of the active contacts
The grain-to-grain contacts were identified based on the principle of ‘active contacts’. This
consists of defining the contact regions by using the surface nodes that have contact force higher
than zero, i.e., at least one of the three components of the force (Fx, Fy, Fz) greater than zero.
Relying on force measurements to identify contacts has the advantage of avoiding uncertainties,
e.g. systematic contact overdetection, related to image segmentation and voxel size issues
commonly found in purely geometric contact identification (e.g. Fonseca et al., 2013; Wiebicke,
et al., 2017).
Another advantage of this technique is that the vector defining the normal to the contact region
at each node is easily obtained, which is interesting for fabric analysis (e.g. Wang et al, 2004;
6
Four strain levels (axial strain values of 2.5%, 5.5%, 7.5%, and 9.5%) were chosen here to
investigate the evolution of the predominant orientation of the contact normal vectors and their
associated contact region. The active contact area at each loading stage is directly proportional
to the number of active contact vectors (one vector per element).
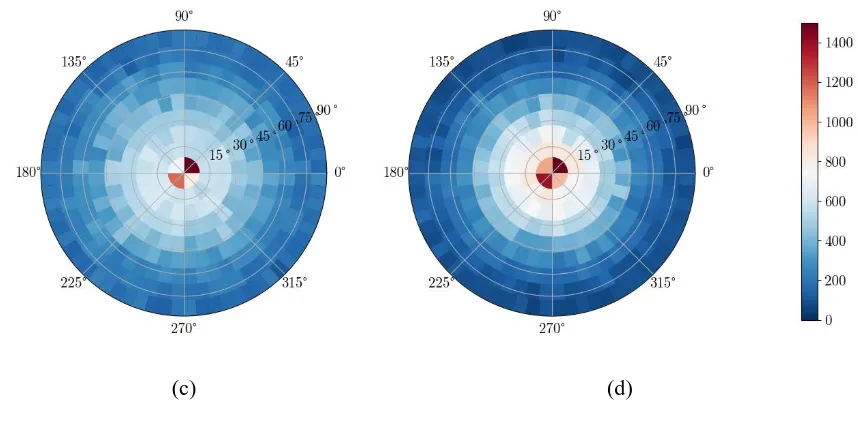
The distribution of the contact normal vectors is presented in Fig. 4 by means of polar plots, in
this projection; the centre of the circle corresponds to an orientation parallel with the axis of the
sample (i.e., the z direction). For axial strain of 2.5% (Fig. 4a) it can be seen that nearly all
vectors (approximately 99%) are clustered around the middle of the plot, represented here by
light shades, which corresponds to polar angle θ values between 0-10° (angle between the
vector and vertical direction). The vectors distribution becomes more scattered as the polar
angle θ increases and only a residual number of vectors (approximately 0.2%) exhibit a nearly horizontal orientation, i.e. a θ value greater than 65° (represented here by darker shades). For
the stage of 5.5% strain (Fig. 4b) it can again be seen the clustering of the vectors in the middle
region of the polar plot, the only difference is that the number of vectors is higher (22% increase
in comparison with the previous stage), which explains the slight increase in the number of
vectors for θ between 10°-20° (represented here by lighter shades) but this number of vectors is
still insignificant when compared with the number located in the θ range of 0-10°. For the
subsequent stages (Figs. 4c and 4d) the trend observed is again similar and the subtle changes in
colour are mainly a result of the decrease in the number of vectors when compared with the
previous stages (incremental reductions of 28% and 25%, respectively).
The alignment of the contact normal vectors in the direction of the major principal stress as
deformation progresses is in agreement with the findings reported by Fonseca et al. (2013, 2016), for which pure geometrical considerations were used to identify the contacts and the
associate normal vectors. When comparing the results from the geometrical approach and the
active contacts approach, the aspect worth mentioning is the very small number of vector with
orientations closer to horizontal found in the latter. Despite the sands being different (Fonseca
and co-authors used an intact locked sand), this observation seems to suggest that the contacts
for which the normal vector is nearly horizontal are not transmitting stress.
The degree of clustering around the direction of the major principal stress is quantified here
using the anisotropy of the distribution of the contact normal, given by the difference between
the maximum and minimum eigenvalues of the fabric tensor (Fonseca et al., 2013). The fabric tensor of the contact normal is a useful tool to describe the preferred orientation of the dataset
and its associated intensity. A second-order symmetric tensor as proposed by Satake (1982) is
used here:
N k k j k iij n n
N 1
1
7
where N is the total number of vectors in the system and nik is the unit orientation vector along direction i. The anisotropy value obtained from 1-3 will take the value 0 for an isotropic
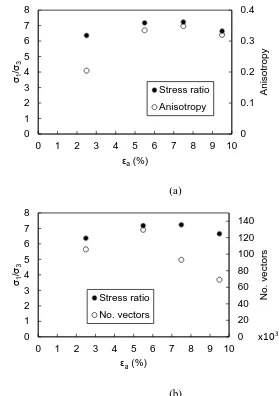
system and 1 for a highly anisotropic case. The measured anisotropy values are presented in Fig. 5a and their evolution is compared with the stress ratio. A good agreement can be found
between both parameters, i.e. as the axial strain increases, both stress ratio and anisotropy values
increase and, subsequently, for the last two stages of loading both are seen to decrease. The
same trend can also be observed for the evolution of the number of vectors presented in Fig. 5b.
These observations suggest that the (local) strain hardening can be captured by the increase in
the active contact regions and their clustering along the major principal stress; and further, the
(local) subtle reduction of stress ratio within the plateau is accompanied by the decrease in these
micro scale quantities. This finding highlights the relevance of the active contacts to link the
macro response to the microscale phenomena.
Formation of stress chains
For the case of spherical particles in contact, the initial contact area is invariably a point, and
this may explain the fact that the debate around whether to use force or stress to identify the
load bearing grains has not received much attention previously. For real sand grains, however,
the contact topologies arising from the irregular shaped grains, makes this investigation
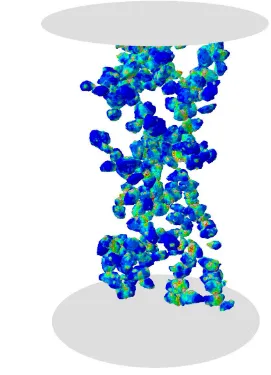
necessary. In this study, the grains forming the force chains were identified as being those
transmitting a force value greater than three times the mean normal contact force, i.e., 3×3.02N=9.06N. This selection resulted in the identification of approximately 200 grains
belonging to the strong force network (6% of the total number of grains). The 200 grains with
the highest internal stresses, using the von Mises criterion, were also filtered out (Fig. 6). The
results revealed that only half (i.e. 47.8%) of grains were both in the force and in the stress networks. This mismatch between the grains carrying the highest forces and grains carrying the
highest stresses suggests that the ‘force chain’ criterion may not be able to identify the more
stressed grains. This observation is critical since grain breakage due to stress concentration may
initiate outside the force chain and change the stability and self-organisation of the assembly.
CONCLUSIONS
The simulation of a sample with over 3,000 grains interacting in a finite-discrete element
framework under triaxial compression is shown here to reproduce well the macroscopic
response obtained from experiments. By assigning only elasticity to the individual grains, the
non-linear plastic response of the specimen was reproduced based on grain deformation and
granular reorganisation, according to frictional contact conditions based on experimental
8
representation of the numerical membrane using deformable thin-shell elements that enable a
more realistic representation of the laboratory conditions.
The evolution of two microscale parameters, the active contact regions and the anisotropy of the
distribution of the contact normal vectors are shown to capture well the macroscopic strain
hardening and the stress ratio plateau of the material. It is also shown here that the grains
experiencing the highest stresses are not necessarily part of the force chains network (i.e. those
grains transmitting an above average force). The use of the ‘stress chain’ concept is discussed
and proposed as a more suitable approach to consider grain breakage that may initiate outside
the strong force network and compromise the stability of the assembly.
ACKNOWLEDGMENTS
The authors would like to acknowledge the provision of the Martian regolith-like sand
associated to the National Science Foundation grant number ACI-1548562. Thanks also to City
University of London for sponsoring the doctoral scholarship of the first author.
REFERENCES
Ahmad, S., Irons, B.M. & Zienkiewicz, O.C., (1970). Analysis of thick and thin shell structures
by curved finite elements. International Journal for Numerical Methods in Engineering, 2(3),
419-451.
Andrade, J.E., Lim, K.W. Avila, C.F. & Vlahinić, I. (2012). Granular element method for
computational particle mechanics. Computer Methods in Applied Mechanics and Engineering, 241, 262-274, ISSN 0045-7825.
Andò, E., Hall, S.A., Viggiani, G., Desrues, J. and Bésuelle, P., (2012). Grain-scale
experimental investigation of localised deformation in sand: a discrete particle tracking
approach. Acta Geotechnica, 7(1), pp.1-13.
Blumenfeld, R. & Ma J. (2017). Bending back stress chains and unique behaviour of granular
matter in cylindrical geometries. Granular Matter19:29, DOI: 10.1007/s10035-017-0707-8 Binesh, S. M., Eslami-Feizabad, E., & Rahmani, R. (2018). Discrete Element Modeling of
Drained Triaxial Test: Flexible and Rigid Lateral Boundaries. International Journal of Civil Engineering, 1-12.
Cavarretta, I., Coop, M. & O'Sullivan, C. (2010). The influence of particle characteristics on the
behaviour of coarse grained soils. Géotechnique60 (6): 413-423.
Cheung, G. & O’Sullivan, C. (2008). Effective simulation of flexible lateral boundaries in two
9
Cuccovillo, T. & Coop, M. R. (1999). On the mechanics of structured sands. Géotechnique 49, No. 6, 741–760, http://dx.doi.org/10.1680/geot.1999.49.6.741.
Cui, L., O’Sullivan, C. & O’Neill, S. (2007). An analysis of the triaxial apparatus using a mixed
boundary three-dimensional discrete element model. Géotechnique 57, No. 10, 831–844 [doi: 10.1680/geot.2007.57.10.831]
de Bono, J., McDowell, G. & Wanatowski, D. (2012). Discrete element modelling of a flexible
membrane for triaxial testing of granular material at high pressures. Géotechnique Letters 2
(4):199–203.
Dassault Systèmes (2014). ABAQUS user’s manual 2014 version 6.14. Providence, RI, USA:
Dassault Systèmes.
Fonseca, J., O'Sullivan, C., Coop, M.R. & Lee, P.D. (2013). Quantifying the evolution of soil
fabric during shearing using directional parameters. Géotechnique63 (6): 487-499.
Fonseca, J., Nadimi, S., Reyes-Aldasoro, C.C, O’Sullivan, C. & Coop, M.R. (2016).
Image-based investigation into the primary fabric of stress transmitting particles in sand, Soils & Foundations56 (5): 818-834.
Gerritsen, M., Kreiss, G. & Blumenfeld, R. (2008). Stress chain solutions in two-dimensional
isostatic granular systems: fabric-dependent paths, leakage, and branching. Physical Review Letters101, 098001.
Hall, S.A., Bornert, M., Desrues, J., Pannier, Y., Lenoir, N., Viggiani, G. and Bésuelle, P., 2010.
Discrete and continuum analysis of localised deformation in sand using X-ray μCT and
volumetric digital image correlation. Géotechnique60 (5), pp.315-322.
Kawamoto, R., Andò, E., Viggiani, G., & Andrade, J. E. (2018). All you need is shape:
Predicting shear banding in sand with LS-DEM. Journal of the Mechanics and Physics of Solids, 111, 375-392.
Krumbein, W. C., & Sloss, L. L. (1963). Stratigraphy and sedimentation, W.H. Freeman and
Company, San Francisco.
Kuwano, R. & Jardine, R. J. (2002). On the applicability of cross-anisotropic elasticity to
granular materials at very small strains. Géotechnique 52(10), 727–749, http://dx.doi.org/10.1680/ geot.2002.52.10.727.
Kong, D. & Fonseca, J. (2017). Quantification of the morphology of shelly carbonate sands
using 3D images. Géotechnique, 68(3), 249-261 https://doi.org/10.1680/jgeot.16.P.278
Lu, Y., Li, X., & Wang, Y. (2018). Application of a flexible membrane to DEM modelling of
10
Maeda, K., Sakai, H., Kondo, A., Yamaguchi, T., Fukuma, M. & Nukudani, E. (2010).
Stress-chain based micromechanics of sand with grain shape effect. Granular Matter 12:499–505. DOI: 10.1007/s10035-010-0208-5
Majmudar, T.S. & Behringer, R.P. (2005). Contact force measurements and stress-induced
anisotropy in granular materials. Nature435, 1079-1082. DOI:10.1038/nature03805
Matsushima, T., & Chang, C. S. (2011). Quantitative evaluation of the effect of irregularly
shaped particles in sheared granular assemblies. Granular matter, 13(3), 269-276.
Michalowski, R.L., Wang, Z. & Nadukuru, S.S. (2017). Maturing of contacts and ageing of
silica sand. Géotechnique, http://dx.doi.org/10.1680/jgeot.16.P.321
Munjiza, A. (2004). The combined finite-discrete element method. West Sussex, England: John Wiley & Sons.
Nadimi, S. & Fonseca, J. (2017). Single grain virtualisation for contact behaviour analysis on
sand. Journal of Geotechnical and Geoenvironmental Engineering, 143 (9), 06017010.
Nadimi, S. & Fonseca, J. (2018a). A micro finite element model for soil behaviour.
Géotechnique, 68(4), 290-302 https://doi.org/10.1680/jgeot.16.P.147
Nadimi, S. & Fonseca, J. (2018b). A micro finite element model for soil behaviour: numerical
validation. Géotechnique, 68(4), 364-369 http://doi.org/10.1680/jgeot.16.P.163
Nardelli, V., Coop, M. R., Andrade, J. E., & Paccagnella, F. (2017). An experimental
investigation of the micromechanics of Eglin sand. Powder Technology, 312, 166-174
Ng, T.-T. (2004). Macro- and micro-behaviors of granular materials under different sample
preparation methods and stress paths. Int. J. Solids Struct. 41, No. 21, 5871–5884.
Oda, M. & Iwashita, K. (1999). Mechanics of granular materials, an introduction. Rotterdam, the Netherlands CRC Press.
O’Sullivan, C. (2011). Particulate Discrete Element Modelling: A Geomechanics Perspective. Spon Press.
Radjai, F., Roux, J.N. & Daouadji, A. (2017). Modeling granular materials: century-long
research across scales. Journal of Engineering Mechanics 143 (4), https://doi.org/10.1061/(ASCE)EM.1943-7889.0001196
Reese, S., Raible, T. & Wriggers, P., (2001). Finite element modelling of orthotropic material
behaviour in pneumatic membranes. International journal of solids and structures, 38(52),
9525-9544.
Satake, M. (1982). Fabric tensor in granular materials. In IUTAM Conference on Deformation
11
Shewchuk, J. R. (2014). Reprint of: Delaunay refinement algorithms for triangular mesh
generation. Computational Geometry: Theory and Applications47 (7): 741-778.
Sze, K.Y., (2002). Three‐dimensional continuum finite element models for plate/shell analysis.
Progress in Structural Engineering and Materials, 4(4),400-407.
Vlahinić, I., Andò, E., Viggiani, G., Andrade, J.E. (2013). Towards a more accurate
characterization of granular media: extracting quantitative descriptors from tomographic
images. Granular Matter16 (1), 9-21.
Wang, L. B., Frost, J. D., & Lai, J. S. (2004). Three-dimensional digital representation of
granular material microstructure from X-ray tomography imaging. Journal of Computing in Civil Engineering, 18(1), 28-35.
Wiebicke, M., Andò, E., Herle, I., & Viggiani, G. (2017). On the metrology of interparticle
contacts in sand from x-ray tomography images. Measurement Science and Technology, 28(12), 124007.
Yang, Z. X., & Wu, Y. (2016). Critical state for anisotropic granular materials: a discrete
element perspective. International Journal of Geomechanics, 17(2), 04016054
Zhang, Y., Shao, J., Liu, Z., Shi, C., & De Saxcé, G. (2018). Effects of confining pressure and
loading path on deformation and strength of cohesive granular materials: a three-dimensional
DEM analysis. Acta Geotechnica, 1-18.
FIGURES
12
[image:13.595.145.453.55.281.2](c) (d)
Fig. 1. Views of the full experimental specimen at: (a) 0% axial strain and (b) 10% axial strain and of the numerical specimen at: (c) 0% axial strain and (d) 10% axial strain
(a) (b)
[image:13.595.122.513.352.581.2]13
(a)
[image:14.595.182.406.54.414.2](b)
Fig. 3. Comparison between the macroscopic results from the µFE model and the experiments: (a) Stress-strain response and (b) Volumetric response
(a) (b)
0 1 2 3 4 5 6 7 8
0 1 2 3 4 5 6 7 8 9 10
σ1 /σ3
εa (%)
Experiment µFE
-1 0 1 2 3 4 5 6 7 8
0 1 2 3 4 5 6 7 8 9 10
εv
(
%)
εa (%)
Experiment
14
[image:15.595.81.510.64.277.2](c) (d)
15
(a)
(b)
Fig. 5. Comparison of the evolution of the stress ratio with two micro scale parameters: (a) anisotropy of the distribution of the contact normal vectors, (b) number of contact normal vectors 0 0.1 0.2 0.3 0.4 0 1 2 3 4 5 6 7 8
0 1 2 3 4 5 6 7 8 9 10
A n is o trop y σ1 /σ 3
εa (%)
Stress ratio Anisotropy 0 20 40 60 80 100 120 140 0 1 2 3 4 5 6 7 8
0 1 2 3 4 5 6 7 8 9 10
No . v e c to rs σ1 /σ3
εa (%)
Stress ratio
No. vectors
[image:16.595.122.401.55.451.2]16
[image:17.595.170.441.81.456.2]