Extraction of lineaments from gravity anomaly maps using the gradient
calculation: Application to Central Anatolia
D. Aydogan
Istanbul University, Engineering Faculty, Department of Geophysics, 34320, Avcilar, Istanbul, Turkey
(Received December 3, 2007; Revised April 7, 2011; Accepted April 9, 2011; Online published December 29, 2011)
Linear anomalies are important in the interpretation of gravity and magnetic data because they indicate some important structural features. In this study, a method is proposed to extract lineaments which may be difficult to recognize. It is based on the convolution between the templates obtained from the second horizontal derivative of the theoretical anomaly due to a truncated horizontal plate and the gravity anomaly. Local maxima of the gradient magnitude determine lineaments in a gravity anomaly map. The method is used in the edge detection of geological structures closer to the surface, which are masked by other structures with various depths and dimensions. A source code in Matlab format for the proposed algorithm is implemented. Firstly, it was tested on synthetic examples and satisfactory results were obtained. Secondly, it was tested on gravity-anomaly maps of the Tuzg¨ol¨u (Salt Lake) basin in Central Anatolia, Turkey. Subsequently, the proposed algorithm and normalized standard deviation (NSTD), another edge-detection filter, were evaluated together to obtain the horizontal location of potential-field source boundaries. A visual evaluation of the outputs was carried out and the results compared with each other. These examples demonstrate that the proposed method can be used in the visual interpretation of gravity-anomaly maps in order to detect geological features such as major and minor faults.
Key words: Gravity anomaly, horizontal gradients, template, lineaments, Tuzg¨ol¨u basin, Central Anatolia, Turkey.
1.
Introduction
One of the most common problems encountered in geo-physical studies is how to determine the geometry of faults, or contacts, at different depths. Gravity is an effective geo-physical method, for determining vertical geological fea-tures. These vertical discontinuities, which might corre-spond to subsurface faults and contacts, appear on gravity and magnetic maps as lineaments. Numerous techniques exist in geophysics to analyze gravity anomalies produced by faults or the boundary of two geologic zones. Major faults which can be defined as first-order faults can be in-ferred from gradient zones on gravity-anomaly maps (Zeng
et al., 1994). But, it is generally difficult to recognize sec-ondary faults which may be masked due to larger structures. Edge-detection algorithms are suitable for the analysis of potential-field data. These are used in the visual interpreta-tion of both gravity, and magnetic, maps in order to detect main geological structures. Lineaments in gravity and mag-netic maps are used to identify areas of high priority for fur-ther detailed exploration. The Radon transform is a useful method for analyzing lineaments in a 2-D map. Pawlowski (1997) has shown the applicability of the Radon transform in displaying linear features in magnetic maps. Yunxuan (1992) applied the Radon transform to synthetic gravity maps in order to demonstrate its usefulness for upward and
Copyright cThe Society of Geomagnetism and Earth, Planetary and Space Sci-ences (SGEPSS); The Seismological Society of Japan; The Volcanological Society of Japan; The Geodetic Society of Japan; The Japanese Society for Planetary Sci-ences; TERRAPUB.
doi:10.5047/eps.2011.04.003
downward continuation to remove unwanted linear features. Sykes and Das (2000) used the Radon transform to en-hance linear features in geophysical maps. Boschetti (2005) has proposed different edge-detection algorithms based on the use of horizontal or vertical gradients of potential-field anomalies. Aydogan (2007) interpreted lineaments of the Bouguer anomaly map of Biga, and its surrounding area, by using a cellular neural network algorithm that is used for image processing. Several edge-detection algorithms can be found in the literature, all of which are based on image gradients. These gradients are calculated from the image it-self, rather than measured. Edge detection neither generates new information, nor extracts information from geophysi-cal maps. It only transforms such information (Boschetti, 2005). Via edge detection, the information which is con-tained within the entire image pixel set is displayed in a form that helps the user to focus on the main features of a map and to interpret them in terms of geological structures (Hornbyet al., 1999).
Works on edge detection have been adopted by vari-ous authors (Blakely and Simpson, 1986; McGrath, 1991; Mallat and Zhong, 1992; Moreauet al., 1997; Boschettiet al., 2001; Trompatet al., 2003; Cooper and Cowan, 2006). Several authors have developed various methods based on the use of horizontal, or vertical, gradients of potential-field anomalies (Rao et al., 1981; Grauch and Cordell, 1987; Reidet al., 1990; Marcotteet al., 1992; Roestet al., 1992; Zenget al., 1994; Hsuet al., 1996; Fedi and Florio, 2001).
Since potential-field data correspond to the superposition of effects from all causative sources, the determination of
904 D. AYDOGAN: EXTRACTION OF LINEAMENTS USING A GRADIENT METHOD
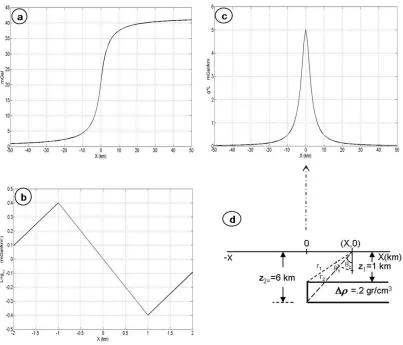
Fig. 1. (a) Gravity profile of the truncated horizontal-plate model shown in Fig. 1(d), (b) 1-D gradient operator, (c) Convolution output described in the text, (d) Plain view of the truncated horizontal-plate model,z1is the depth to the top of the model,z2is the depth to the bottom of the model,ρis
the density contrast.
geologic boundaries usually suffers from nearby source in-terference which produces false edges. In this work, our edge operator is based on the second horizontal derivative of a truncated horizontal-plate model. This approach is a useful tool for detecting deep faults, even in the presence of shallower near-surface features. The validity of the algo-rithm is proved by experiments on both synthetic and real examples. The real data in the study are from the Tuzg¨ol¨u basin and surrounding area in Central Anatolia which has been the subject of numerous studies. Several earlier tec-tonic studies have been carried out for different purposes in the region (Arpat and S¸aroglu, 1975; ˙Ilkis¸iket al., 1997; C¸emenet al., 1999; G¨urer and Aldanmaz, 2002; Ates¸et al., 2005; B¨uy¨uksarac¸ et al., 2005; Aydemir and Ates, 2006, 2008). Our approach is also confirmed for the popular method of normalised standard deviation used to estimate the horizontal location of potential-field source boundaries (Cooper and Cowan, 2008). This method, as applied to the location of edges of causative sources, is simple and easy to use and is a good approach for determining vertical, or near vertical, faults.
2.
Lineament Extraction and Mapping
In image processing, edge detection is a process which attempts to capture significant features from the image. The main idea of eddetection techniques is to locate the
ge-ological features for gravity-data processing and interpre-tation. One may consider the input of the edge detector as a discrete image of gravity data, and its output as an-other image called the gravity edge map. It is difficult to design a general edge-detection algorithm which performs well in many contexts. Canny (1986) was thefirst to give analytic expressions for the criteria that have to be opti-mized in edge detection. In the case of a low noise level, gradient estimations are the classical methods which give satisfactory results. Lunscher (1983), Modestino and Fries (1977), and Shanmugam and Green (1979) have developed different edge-detection operators by associating low-pass filtering with the gradient detector. Shen and Castan (1986) proposed an algorithm based on a recursive form with expo-nential impulse response to detect step edge using a second-derivativefilter.
x z cross-section in Fig. 1(d), semi-infinite in the positive
x-axis direction, is bounded by upper and lower horizontal planesz1andz2. Assuming uniform density distributions in the model and the surrounding medium, the gravity effect, and thefirst and second horizontal derivatives, are given by, respectively,
(Telfordet al., 1976). Wherekis the gravitational constant, andρ is the density contrast between the model and the surrounding medium,
Many filters are available to enhance subtle detail in potential-field data, such as downward continuation, hor-izontal and vertical derivatives, and other forms of high-passfilters. A commonly-used edge-detectionfilter is the total horizontal derivative (Cooper and Cowan, 2008). It can be used to enhance certain features, smooth out noise or highlight previously-known shape in potential-field data. The horizontal gradients can be estimated from the convolu-tion kernels (referred to as gradient operator, edge detector, mask operator and template). The two-dimensional cross-correlation is a simple and robust algorithm used to solve different problems in thefield of image processing. In the space domain, if L is the gradient operator (n ×m) and
where the circle denotes cross-correlation. The mathemati-cal definition of discrete convolution is written as
L∗g(x,y)=
where the asterisk denotes convolution. Equations (4) and (5) are identical when the gradient operator is symmetric. The key difference between the two is that convolution is associative. However, in the frequency domain we can express it as a multiplication of the Fourier transforms of the given functions.
The first step in image processing is the estimation of the derivatives in thex- andy-directions in order to smooth the image. In the time domain, this process is carried out through the convolution of the 2-D Gaussian function and the image using the following equations.
fx = ∂
∂x(G∗I), (6a) fy= ∂
∂y(G∗I). (6b)
Here, I is the image,G is the 2-D Gaussian function, fx and fyare the derivatives in thex- andy-directions,
respec-tively. These expressions are not so effective in gradient cal-culations. Using the properties of the convolution process in a more effective way is given below (Canny, 1986);
fx=
The magnitude of the gradient is given by
M =
f2
x + fy2. (8)
In this study, the first horizontal derivative of the trun-cated horizontal-plate model equation (Eq. (2)) was used to smooth the gravity data. Here, g is the gravity data,
gx andgy are thefirst horizontal derivatives in thex- and
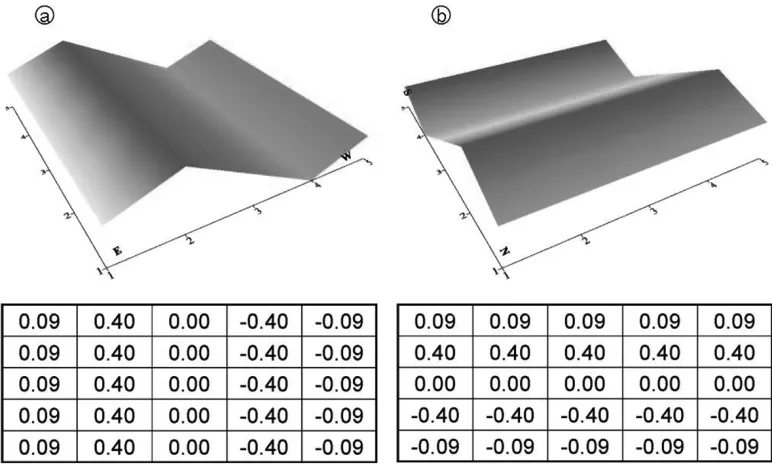
y-directions which can be estimated from the Eqs. (9) and (10). directions derived from Eq. (3), respectively. Also, we have used the second horizontal derivative expression (Eq. (3)) in order to estimate the coefficients of the mask operators. These are shown in Fig. 2.
The edge can be identified by the closed maximum of convolution between these kernels and the gravity data. For the 1-D example, gravity-anomaly (Fig. 1(a)) and edge-operator coefficients (Fig. 1(b)) have been computed along the profile using Eqs. (1) and (3). Figure 1(c) displays the convolution output. As shown in Fig. 1(c), the maximum amplitude of the convolution output delineates the edge of this model quite well.
The edge-detection process can be considered as a pixel classification process by the determination of some pixel as a boundary. It can be determined whether the pixel is a boundary pixel, or not, by taking into account the pixels and its neighboring values for each pixel in a digitized image.
In the image process, a threshold value is generally ap-plied to gradient magnitude values in order to determine lineaments of an image. The threshold value is the most significant parameter that is used in the stage of determin-ing edges from afiltered image. A number of studies in the literature are available for selecting the threshold value in image processing problems: some of which are Prewitt and Mendelsohn (1966), Otsu (1979), Pun (1980) and Tsai (1985).
906 D. AYDOGAN: EXTRACTION OF LINEAMENTS USING A GRADIENT METHOD
Fig. 2. 5×5 operator coefficients obtained from Eq. (3), (a) Gradient operator in the E-W direction. (b) Gradient operator in the N-S direction.
values below the threshold are set to zero. Finally, an edge map is obtained. However, it is difficult to choose a proper threshold. Because of this difficulty, in the edge map there may still be false edges if the threshold is too low or some edges may be missing if the threshold is too high (Peli and Malah, 1982; Hertz and Schafer, 1988; Chen and Shrestha, 2000; Sun et al., 2007; Chen and Ho, 2008). A double threshold can be applied to overcome this problem. Local maxima of the gradient magnitude determine edges in the input data. It is evident that a gradient-based edge detector is an effective and practical approach for both gravity and magnetic data interpretation. This approach can be used to extract geological features such as faults and contacts from a gravity-anomaly map.
3.
Synthetic Examples
In this section, 2-D synthetic examples are used to test the effectiveness of the proposed approach. Some practical results are presented and briefly discussed to demonstrate the success of this approach. Lineaments in the gravity map are indicative of contacts, basement faulting, and other tectonic features of interest. Our goal is to detect edges of geological features which are the cause of lineaments in the gravity map. In this context, an appropriate edge operator is proposed for the determination of lineaments.
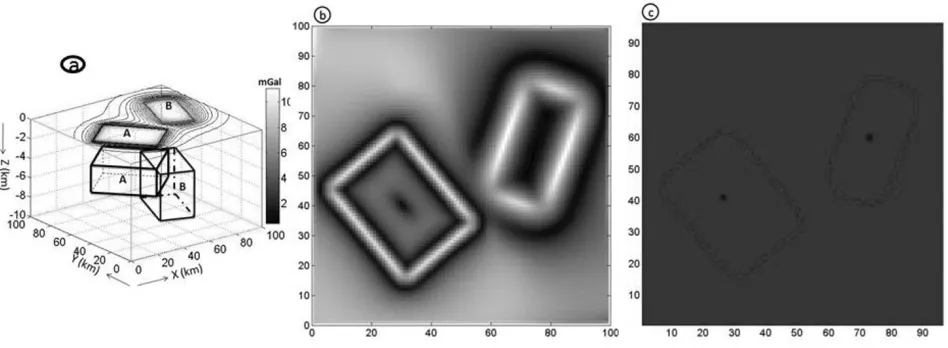
Synthetic Model (1), shown in Fig. 3(a), is produced by using finite rectangular vertical prisms located at various depths. The top and bottom depths of prism A were se-lected as 2 and 5 km, the widths of prism A in thex and
ydirections were selected as 30 and 40 km, respectively. Prism B is deeper than prism A. The top and bottom depths of prism B were selected as 5 and 10 km, and the widths of prism B in thex andydirections were selected as 20 and 40 km, respectively.
The synthetic gravity-anomaly map is shown in Fig. 3(a). In the present study, it is assumed that 1 pixel corresponds to 1 km. The model considers 101×101 pixels in area.
The proposed algorithm is tested on a gravity-anomaly map of synthetic Model (1). Using Eq. (3), we obtained 5×5 masks, shown in Fig. 2, for calculating the derivatives in thex- and y-directions. After the gradients of the gravity data inx- andy-directions are calculated from Eqs. (9) and (10), a gradient magnitude map is obtained from Eq. (8). After that, non-maxima suppression is performed and an edge map is obtained. For the non-maxima suppression, the combinations of high and low threshold values (Th andTl, respectively) were selected based on trial-and-error experi-ments. We have found thatTh=0.4 andTl =0.1 produce the best gravity edge map. As demonstrated in Fig. 3(c), the method delineates the edges of the prisms quite well.
To obtain adequate information from thefiltered output, a threshold operation can be performed. By designating a threshold value, an indented level of detail can be obtained. The applied threshold value could be important in a location whose structure range extends from a narrow fracture to a broad valley. The classification of structures can be easily made by taking an accurate threshold value. In the com-pilation of a tectonic map, an assortment of lineaments is applied. The gradient of the slope and the magnitude of the value are comparative in thefiltered image. Lineaments are described by an appropriate level of pixel values. In gen-eral, a threshold value can be designated in two ways. One way is that it can be determined from a few known struc-tures in the area or from an available tectonic map. It may also be determined by using professional opinion. To some extent, this latter way introduces subjectivity into the map-ping process.
Fig. 3. (a) Gravity data from bodies outlined in black, which were at different depths. Image is 100 km×100 km in size, (b) NSTD map of the gravity data set in (a), (c) Edge map obtained by the proposed edge operators.
Fig. 4. (a) random noise with amplitude equal to 0.07% of the maximum data amplitude was added to the gravity data set shown in Fig. 3(a), (b) NSTD map of the data in (a), (c) Edge map of the data in (a) obtained by the proposed edge operators.
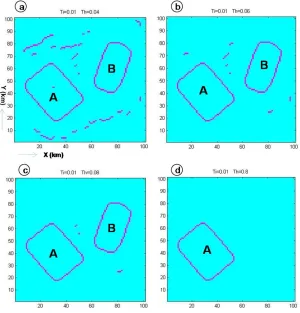
from thefiltered output. In order to obtain desired details, the threshold values can be adjusted accordingly. The ef-fect of the threshold value on the output image is shown in Fig. 5(a–d).
To compare the proposed approach with classical deriva-tive techniques, a NSTD method is applied on the same gravity-anomaly map. This method is based on the ra-tio of related normalized standard deviara-tions (NSTD) to make large and small amplitude edges visible simultane-ously (Cooper and Cowan, 2008). An NSTD map of the gravity data is shown in Fig. 3(b).
To demonstrate how this approach performs on noisy data, random noise with an amplitude equal to 0.07% of the maximum data amplitude was added to the gravity data set shown in Fig. 3(a). Figures 4(a), 4(b) and 4(c) show, respectively, the anomaly map with added noise, the NSTD obtained from the noisy anomaly map and the outputs of the proposed method. In the case of noisy data, it is seen that the proposed method produces better results than the NSTD method (Fig. 4(b)).
The performance of the method in terms of different threshold values for the theoretical model shown in Fig. 3(a) has been investigated and the results are shown in Fig. 5.
In the case of selecting a high threshold value, the effects with long wavelength of the prism B could not be observed (Fig. 5(d)).
For the determination of geologic boundaries, a more so-phisticated example (Model 2) is shown in Fig. 6(a). This model is formed by three rectangular prisms which are lo-cated at various depths and dimensions. The prismatic blocks constructing the model are located at depths A, B and C, given in increasing depth order. The geometric po-sitions of A and B prisms are the same as the theoretical model shown in Fig. 4(a). The top and bottom depths of prism C were selected as 4 and 7 km, and the widths of C prism in thex- andy-directions were taken as 12 and 14 km, respectively.
908 D. AYDOGAN: EXTRACTION OF LINEAMENTS USING A GRADIENT METHOD
Fig. 5. Output images obtained with respect to different threshold values.
Fig. 6. (a) Gravity data from bodies outlined in black, which were at different depths. Image is 100 km×100 km in size, (b) NSTD map of the gravity data set in (a), (c) Edge map obtained by the proposed edge operators.
Figs. 7(b) and 7(c), respectively. In the case of noisy data, we obtained poor resolution for the borders of the B and C prisms. The effect of the threshold value on the output im-age is shown in Fig. 8(a–d). It is observed that with high threshold values, the effects with a long wavelength in the theoretical models are completely lost, while erroneous lin-eaments are produced with low threshold values.
Experimental results demonstrate that our operator, with the use of appropriate threshold values, may produce an edge map from input data. It is shown that the proposed edge-detection algorithm produced fairly good results on both simple and more complex synthetic examples. The
performance of the proposed method is quite good. Thresh-old values play an important role in the identification of lin-eaments. In terms of the estimation power and the computa-tion time, the method can be considered as an effective and powerful tool in the interpretation of gravity and magnetic data.
4.
Application to Real Data
Fig. 7. (a) random noise with amplitude equal to 0.07% of the maximum data amplitude was added to the gravity data set shown in Fig. 6(a), (b) NSTD map of the data in (a), (c) Edge map of the data in (a) obtained by the proposed edge operators.
Fig. 8. Output images obtained with respect to different threshold values.
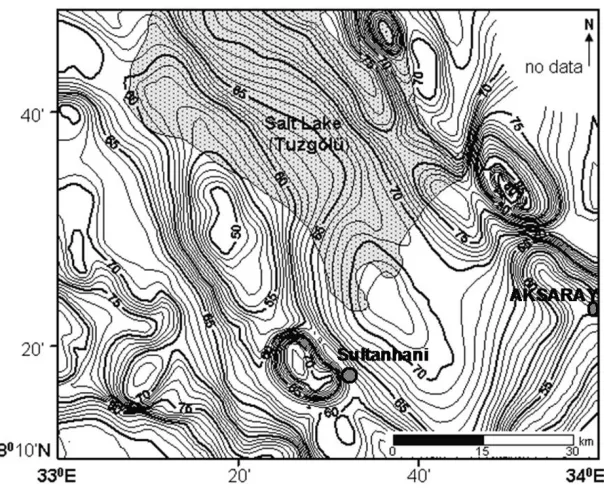
A simplified tectonic map of the Tuzg¨ol¨u basin (compiled from C¸ emenet al., 1999) is shown in Fig. 9. A northwest-striking fault zone is the most prominent structural feature along the eastern margin of the Tuzg¨ol¨u basin. This struc-tural feature was named the Tuzg¨ol¨u fault zone by Arpat and S¸aroglu (1975). It was also referred to as the Kochisar-Aksaray fault (G¨or¨ur et al., 1984) and as the Aksaray-S. Kochisar fault (S¸eng¨oret al., 1985). In the western part of the basin, two parallel fault zones extend from northwest of Yeniceoba and Cihanbeyli. The northernmost of the two faults is called the Yeniceoba fault zone and the southern one is named the Cihanbeyli fault zone. The Yeniceoba
fault zone has been displaced by a northeast striking fault and probably connects to the north- to northwest-striking Sultanhani fault zone. To test the ability of the algorithm to detect major and minor faults, the lineaments are compared with the faults shown in Fig. 9.
magni-910 D. AYDOGAN: EXTRACTION OF LINEAMENTS USING A GRADIENT METHOD
Fig. 9. Simplified tectonic map of the Tuzgol¨u basin and surrounding area (compiled from C¨ ¸emenet al., 1999) in Central Anatolia, Turkey. NAFZ: North Anatolian fault zone, EAFZ: East Anatolian fault zone, EFC: Ecemis fault zone, DSFZ: Dead Sea fault zone, TGB: Tuzgol¨u basin, CACC:¨
Central Anatolian crystalline complex, HB: Haymana basin, IAS:˙Izmir-Ankara suture zone.
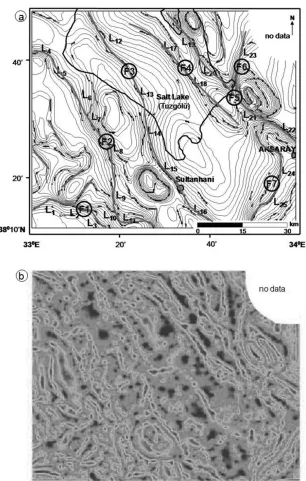
Fig. 11. (a) Edge map obtained by the proposed edge operators. (b) NSTD map of the gravity-data set in Fig. 10.
tude of the input data (Fig. 10). Once the gradient magni-tude of the input data has been calculated, non-maxima sup-pression is performed. The information outside the body edges is eliminated by applying threshold values. A bet-ter edge map is obtained when Th = 0.4 and Tl = 0.1 (Fig. 11(a)). It is observed from this map that the proposed approach can detect major and minor lineaments, but some false lineaments are also detected. The output map is sim-pler and easier to recognize.
The tectonic map, the Bouguer anomaly map, and the NSTD map, which allow us to detect geologic bound-aries of causative sources, are integrated to provide evi-dence of the determination of faults. In the study area, 7 faults are identified after merging 25 lineaments into sin-gle faults. Figure 11(a) shows lineaments superimposed on the Bouguer anomaly map. Lineaments are detected and
912 D. AYDOGAN: EXTRACTION OF LINEAMENTS USING A GRADIENT METHOD
of Tuzg¨ol¨u. This fault is also supported by Fig. 11(b). By combining the L19–L22lineaments which are formed in the same gradient zone, it is observed that they represent the strike-slip Tuzg¨ol¨u fault (F5). The L23 lineament can be considered as a single fault system (F6) oriented in the N-S direction in the gradient zone, and L23 is compatible with the buried fault shown in Fig. 9. It could be said that the L24 and L25 lineaments create one fault system (F7) when they are combined and this fault is supported by Fig. 11(b). Here identified fault traces are named F1–F7 and are shown on Fig. 11(a) as straight lines. According to the NSTD method, our algorithm shows more similarity to the tec-tonic map displayed in Fig. 9. The results of a compar-ison with the tectonic map show that our proposed algo-rithm is able to detect more of the faults shown in Fig. 9 than the number identified from the visual interpretation of geologists. In the southwestern part of the study area, sev-eral minor lineaments which are not to be seen on the tec-tonic map are shown determined on the map obtained by the proposed algorithm. The relationship between these linea-ments and faults can be identified from detailed geophysical studies. Lineaments are extracted as a steep gradient of a gravity anomaly, which corresponds to a density contrast at depth. Faulting is, of course, a possible cause of the density contrast, but other explanations (erosion, etc.) may also be valid. So it is definitely necessary to carry out an additional field survey, or geophysical exploration, to check the result (Takeshi Sagiya, personal communication, 2011).
The proposed method is a tool to aid geophysical inter-pretation. However, the role of interpreters explaining the geological importance of results remains very important.
5.
Conclusions
In this study, an edge operator based on the second hor-izontal derivative of a truncated horhor-izontal-plate model is used to process gravity data and to realize the detection and extraction of lineaments. We have applied a differ-ent gradidiffer-ent-interpretation algorithm for lineamdiffer-ent mapping purposes. The application of the proposed method in grav-ity mapping is not common. As part of the detection proce-dure, a threshold-based gradient method is used to highlight long linear segments or to enhance short linear ones. It is evident that a gradient-based edge detector is an effective and practical approach for both gravity and magnetic inter-pretations. Searching for discontinuities in the input data corresponds to searching for the local maxima of the gradi-ent magnitudes. These maxima provide the edge informa-tion of the input data.
Firstly, the proposed edge operator has been applied on two sets of synthetic data in order to detect borders of verti-cal prismatic blocks and the results are compared with those of another edge detection filter (NSTD) (Figs. 3–8). Af-ter obtaining satisfactory results, the method was applied to the Gravity anomaly map of the Tuzg¨ol¨u basin in Cen-tral Anatolia. The structural features in the area between Yeniceoba, Cihanbeyli, S. Kochisar, Aksaray and Sultan-hani were investigated. The results of the proposed ap-proach (Fig. 10(a)) show a good agreement with previously-observed faults in thefield (C¸emenet al., 1999; Aydemir and Ates, 2006, 2008). Faults that are not clear in the
grav-ity anomaly map can also be identified as well. These re-sults show that the proposed approach constitutes a useful tool to aid fault interpretation. It is observed from the ex-perimental results that increasing the operator size and the threshold values reduce its sensitivity to noise, at the ex-pense of losing some of the real edges in the input data. The threshold value is a key parameter in the proposed ap-proach (Figs. 5 and 8). A selection of the threshold value from the gradient magnitude is related to the accuracy of lineament detection. The localization error in the detected edges also increases as the operator size and threshold value are increased. In other words, it is a way to keep the signif-icant information of the input data whilst getting rid of the unimportant parts. The experimental results demonstrate that this operator can be used in the visual interpretation of gravity-anomaly maps in order to detect geological features such as major and minor faults.
Consequently, by applying the proposed approach to a gravity-anomaly map, a detailed general view of surface and subsurface structural boundaries can be obtained suc-cessfully. The proposed approach, as applied to the location of edges of causative sources, is simple and easy to use, and is good for vertical or near vertical faults. The method is a tool that can contribute to the geophysical interpretation in determining fault traces, but the observations of experi-enced reviewers are needed to define the geological mean-ing of the results. Thus, this method should be considered to be a useful tool, like other geophysics techniques, in the investigation of structural boundaries over wide areas.
Acknowledgments. The author thanks Dr. Aysan Gurer, Dr. Ali¨ Pınar, Dr. Ali Elmas and Dr. Nihan Sezgin for their careful reading and suggestions to improve the manuscript. I would also like to thank an anonymous referee and Dr. Takeshi Sagiya for their reading and constructive comments on the manuscript.
References
Arpat, E. and F. S¸aroglu, Turkiye¨ ’deki bazionemli genc¨ ¸tektonik olaylar, Turkish Geol. Soc. Bull.,18, 91–101, 1975.
Ates¸, A., F. Bilim, and A. Buy¨ uksarac¨ ¸, Curie Point Depth investigation of Central Anatolia, Turkey,Pure Appl. Geophys.,162, 357–371, 2005. Aydemir, A. and A. Ates, Structural interpretation of the Tuzgol¨u and¨
Haymana Basins, Central Anatolia, Turkey, using seismic, gravity and aeromagnetic data,Earth Planets Space,58, 951–961, 2006.
Aydemir, A. and A. Ates, Determination of hydrocarbon prospective areas in the Tuzgolu (Salt lake) Basin, central Anatolia, by using geophysical data,J. Petrol. Sci. Eng.,62, 36–44, 2008.
Aydogan, D., Processing the Bouguer anomaly map of Biga and the sur-rounding area by the Cellular Neural Network: Application to the south-western Marmara region,Earth Planets Space,59, 201–208, 2007. Blakely, R. J. and R. W. Simpson, Approximating edges of source bodies
from magnetic or gravity anomalies,Geophysics,51, 1494–1498, 1986. Boschetti, F., Improved edge detection and noise removal in gravity maps via the use of gravity gradients,J. Appl. Geophys.,57, 213–225, 2005. Boschetti, F., P. Hornby, and F. G. Horowitz, Wavelet based inversion of
gravity data,Exp. Geophys.,32, 48–55, 2001.
Buy¨ uksarac¨ ¸, A., D. Jordanova, A. Ates¸, and V. Karloukovski, Interpreta-tion of the gravity and magnetic anomalies of the Cappadocia region, central Turkey,Pure Appl. Geophys.,162, 2197–2213, 2005.
Canny, J., A computational approach to edge detection,IEEE Transaction on Pattern Analysis and Machine Intelligence,PAMI 8(6), 679–698, 1986.
C¸emen, I., M. C. Gonc¨ uoglu, and K. Dirik, Structural evolution of the¨
Tuzgol¨u basin in Central Anatolia, Turkey,¨ J. Geol.,107, 693–706, 1999.
Chen, C. H. and B. Shrestha, Classification of multi-sensor remote sensing images using self-organizing feature maps and radial basis function net-works, inProceedings of International Geosciences and Remote Sens-ing Symposium (IGARSS), Hawaii, 2000.
Cooper, G. R. J. and D. R. Cowan, Enhancing potentialfield data using
filters based on the local phase,Comput. Geosci.,32, 1585–1591, 2006. Cooper, G. R. J. and D. R. Cowan, Edge enhancement of potential-field
data using normalized statistics,Geophysics,73, H1–H4, 2008. Fedi, M. and G. Florio, Detection of potentialfields source boundaries by
enhanced horizontal derivative method,Geophys. Prospect.,49, 40–58, 2001.
Gor¨ur, N., F. Y. Oktay, I. Seymen, and A. M. C. S¨ ¸engor, Paleotectonic¨
evolution of Tuzgol¨u basin complex, Central Turkey, in¨ The Geological Evolution of the Eastern Mediterranean, edited by Dixon, J. E. and A. H. F Robertson,Spec. Publ. Geol. Soc.,17, 81–96, 1984.
Grauch, V. J. S. and L. Cordell, Limitations of determining density or mag-netic boundaries from the horizontal gradient of gravity or pseudograv-ity data,Geophysics,52, 118–121, 1987.
Gurer,¨ O. F. and E. Aldanmaz, Origin of the Upper Cretaceous-Tertiary¨ sedimentary basins within the Taurid-Anatolide platform in Turkey, Geol. Mag.,139(2), 191–197, 2002.
Hertz, L. and R. W. Schafer, Multilevel thresholding using edge matching, Comput. Vision Graphics Image Process.,44, 279–295, 1988. Hornby, P., F. Boschetti, and F. Horowitz, Analysis of potentialfield data
in the wavelet domain,Geophys. J. Int.,137, 175–196, 1999. Hsu, S. K, J. C. Sibuet, and C. T. Shyu, High-resolution detection of
ge-ologic boundaries from potentialfield anomalies: an enhanced analytic signal technique,Geophysics,61, 373–386, 1996.
˙
Ilkis¸ik, O. M., A. Gurer, T. Tokg¨ oz, and C. Kaya, Geoelectromagnetic¨
and geothermic investigations in the Ihlara Valley geothermalfield,J. Volcanol. Geotherm. Res.,78, 297–308, 1997.
Lunscher, W. H. H. J., The asymptotic optimal frequency domainfilter for edge detection,IEEE Transaction on Pattern Analysis and Machine Intelligence,PAMI 5(6), 678–679, 1983.
Mallat, S. and S. Zhong, Characterization of signals from multiscale edges, IEEE Transactions on Pattern Recognition and Machine Intelligence, 14, 710–732, 1992.
Marcotte, D. L., C. D. Hardwick, and J. B. Nelson, Automated interpreta-tion of horizontal magnetic gradient profile data,Geophysics,57, 288–
295, 1992.
McGrath, P. H., Dip and depth extent of density boundaries using hor-izontal derivatives of upward continued gravity data,Geophysics,56, 1533–1542, 1991.
Modestino, J. W. and R. W. Fries, Edge detection in noisy images using recursive digitalfilter,Comput. Graphics Image Process,PAMI 1, 409–
433, 1977.
Moreau, F., D. Gibert, M. Holschneider, and G. Saracco, Wavelet analysis of potentialfields,Inverse Problems,13, 165–78, 1997.
Otsu, N., A threshold selection method from gray-level histograms,IEEE Transactions on Systems,9(1), 62–66, 1979.
Pawlowski, R. S., Use of slant stack for geologic or geophysical map lineament analysis,Geophysics,62, 1774–1778, 1997.
Peli, T. and D. Malah, A study of edge detection algorithms,Comput. Graphics Image Process.,20, 1–21, 1982.
Prewitt, J. M. S. and M. L. Mendelsohn, The analysis of cell images,Ann. Newyork Academy Sci.,128, 1035–1053, 1966.
Pun, T., A new method for gray-level picture thresholding using the en-tropy of the histogram,Signal Processing,2, 223–237, 1980. Rao, D. A., H. V. Babu, and P. V. Narayan, Interpretation of magnetic
anomalies due to dikes: The complex gradient method,Geophysics,46, 1572–1578, 1981.
Reid, A. B., J. M. Allsop, H. Granser, A. J. Millett, and I. W. Somerton, Magnetic interpretation in three dimensions using Euler deconvolution, Geophysics,55, 80–91, 1990.
Roest, W. R., J. Verhoef, and M. Pilkington, Magnetic interpretation using the 3-D analytic signal,Geophysics,57, 116–125, 1992.
S¸engor, A. M. C., N. G¨ or¨ur, and F. S¨ ¸aroglu, Strike slip deformation basin formation and sedimentation, strike-slip faulting and related basin for-mation in zones of tectonic escape, Turkey as a case study, inStrike-slip Faulting and Basin Formation, Soc. Econ. Paleont. Mineral. Spec. Pub., edited by Biddle, K. T. and N. Christie-Blick,37, 227–264, 1985. Shanmugam, K. S. and J. A. Green, An optimal frequency domainfilter for
edge detection in digital pictures,IEEE Transaction on Pattern Analysis and Machine Intelligence,1, 37–49, 1979.
Shen, J. and C. Castan, An optimal linear operator for edge detection, Proceeding Conference on Vision and Pattern Recognition (CUPR), 109–114, 1986.
Sun, G., Q. Liu, C. Ji, and X. Li, A novel approach for edge detection based on the theory of universal gravity,Pattern Recognition,40, 2766–2775, 2007.
Sykes, M. P. and U. C. Das, Directionalfiltering for linear feature enhance-ment in geophysical maps,Geophysics,65, 1758–1768, 2000. Telford, W. M., L. P. Geldart, R. E. Sheriff, and D. A. Keys,Applied
Geophysics, Cambridge University Press, 1976.
Trompat, H., F. Boschetti, and P. Hornby, Improved downward continua-tion of potentialfield data,Expl. Geophys.,34(4), 249–256, 2003. Tsai, W., Moment preserving thresholding: A new approach,Comput.
Vision Graphics Image Processing,29, 377–393, 1985.
Ugurtas˘ ¸, G., Geophysical interpretation of part of the Tuzgol¨u basin,¨ M. T. A. Bull.,85, 38–45, 1975.
Yunxuan, Z., Application of the Radon transform to the processing of air-borne geophysical data, Ph.D. thesis, Internat, Inst., Aerospace Survey and Earth Sciences, 1992.
Zeng, H., Q. Zhang, and J. Liu, Location of secondary faults from cross-correlation of the second vertical derivative of gravity anomalies, Geo-phys. Prospect.,42, 841–854, 1994.