O
UT OFS
AMPLEE
STIMATION FORS
MALLA
REAS USINGA
REAL
EVELD
ATAA
YOUBS
AEI,
R
AYC
HAMBERSA
BSTRACTA Fay-Herriot type model with independent area effects is often assumed when small area
estimates based on area level data are required. However, under this approach out of sample
areas are limited to synthetic estimates. In this paper we relax the independent area effects
assumption, allowing area random effects to be spatially correlated. Empirical best linear
unbiased predictors are then developed for areas in sample as well as those that are not in
sample, with variance components estimated via maximum likelihood and residual (restricted)
maximum likelihood. An expression for the mean cross-product error (MCPE) matrix of the
small area estimators is derived, as is an estimator of this matrix. The estimation approach
described in the paper is then evaluated by a simulation study, which compares the new
method with other methods of small area estimation for this situation.
Out of Sample Estimation for Small Areas using Area Level Data
Ayoub Saei and Ray Chambers†
Southampton Statistical Sciences Institute, University of Southampton, Highfield, Southampton, SO17 1BJ, UK
Email: [email protected] and [email protected] † Contact author for correspondence.
Summary
A Fay-Herriot type model with independent area effects is often assumed when small area estimates based on area level data are required. However, under this approach out of sample areas are limited to synthetic estimates. In this paper we relax the
independent area effects assumption, allowing area random effects to be spatially correlated. Empirical best linear unbiased predictors are then developed for areas in sample as well as those that are not in sample, with variance components estimated via maximum likelihood and residual (restricted) maximum likelihood. An expression for the mean cross-product error (MCPE) matrix of the small area estimators is derived, as is an estimator of this matrix. The estimation approach described in the paper is then evaluated by a simulation study, which compares the new method with other methods of small area estimation for this situation.
1. Introduction
Large sample surveys are usually designed to produce reliable estimates of national or large area characteristics. However, there is a growing demand for similar estimates for smaller areas or domains. Such estimates are now routinely calculated using the so-called indirect or model-based approach. This uses auxiliary information for the small areas of interest and has been characterized in the statistical literature as ″borrowing strength” from the relationship between the values of the response variables and the auxiliary information.
An immediate benefit of using such models is that prediction of random area effects for out of sample areas becomes straightforward. In an earlier paper (Saei and Chambers, 2005) the authors developed this approach for the case where unit level data are available from the in-sample areas. This paper extends this approach to the important aggregate data situation. In particular, the empirical best linear unbiased predictor (EBLUP) for an area level characteristic for areas in sample as well as those that are not in sample is derived for the case of aggregate area level data, assuming a Fay-Herriot-type linear mixed model with spatially correlated area random effects.
In section 2 we define this model and its associated notation. The EBLUP is developed in section 3, based on use of either maximum likelihood or restricted maximum
likelihood methods for estimating the variance components of the model. The mean cross-product errors matrix of the EBLUP estimator and an estimator of this quantity are developed in section 4. Results from a simulation study of the performance of the new method are then provided in section 5. Section 6 concludes the paper with a discussion of potential avenues for further research.
2. Model Specification
characteristics, a random area effect Z′u, where Z is a vector of area level
characteristics, and an individual random effect. This induces a linear model for , given by
θ
θ =Xβ +Zu, where X is the matrix of area means of X, is the matrix of (area level) values of Z, β is a vector of unknown regression coefficients (including an intercept) and is an unknown vector of random area effects. Following standard practice, we assume that is a realisation from a multivariate normal distribution with zero mean vector and variance-covariance matrix of order D. Furthermore,
is a function of an unknown parameter
Z
u
u
σu2Ω
Ω = Ω(λ) λ.
Not all of the areas will be represented in sample. An area d will be denoted as in sample if a direct survey estimate for the characteristic of that area is available. Otherwise the area is out of sample. Let denote the number of small areas in sample, with denoting the number of out of sample areas. We can then partition
the matrices
θd
Ds
Dr = D−Ds
X and Z into X=[X′s X′r] and ′ corresponding to sample
and non-sample areas. Similarly we can partition the random area effects vector as . The objective is to predict the value of
Z= Zs 0
0 Zr ⎡ ⎣ ⎢ ⎢ ⎤ ⎦ ⎥ ⎥
u=[u′s u′r]′
θ= θs
θr ⎡ ⎣ ⎢ ⎢ ⎤ ⎦ ⎥ ⎥=
Xsβ +Zsus Xrβ rur ⎡ ⎣ ⎢ ⎢ ⎤ ⎦ ⎥
⎥. (1)
+Z
the underlying unit level model that led to (1) implies that these direct estimates will follow the closely related model
s = sw+ s
e
θ θ (2)
where θsw=Xswβ +Zsus and es represents estimation error. Here Xsw denotes the weighted estimate of Xs obtained from the sample data in the in sample areas. Note that
Xswcan be replaced by Xswhen Xswis not available.
The model (2) is often referred to as a Fay-Herriot model. Under this model the sampling error vector is assumed to be independent of u and normally distributed, with zero mean vector and variance-covariance matrix , where is a known square matrix of order n (the overall sample size). Combining this assumption with (1), we see that the implied model for
es
σ2
Ws Ws
s
θ is
s = sw+ s = sw + s s+ s = sw s
e X Z u e X
θ θ β β + ζ (3)
where Var(ζs)=σ2(Ws +ϕZsΩZ′s)=σ2Σs and ϕ =σu2 /σ2.
3. Empirical Best Linear Unbiased Prediction
In this section we describe an algorithm for computing the empirical best linear unbiased estimate of β and the corresponding predictions of and u given the area level data
us r
s
θ and Xsw. This assumes that the parameter in (3) is known (or that a good estimate of it is available), and is based on combining the ideas of Henderson (1950) and Harville (1977).
Put l1 equal to the log-likelihood for β generated by θs given the value of the random
component vector , equal to the logarithm of the probability density of given the value of the random component vector , l
us l2 us
ur 3 equal to the logarithm of the
probability density function of random component ur and set l . The best linear unbiased predictors (BLUPs) of
=l1+l2 +l3
β, and are then the values of these
quantities where is maximised (Henderson, 1950). Of course, these BLUPs depend on the variance components
us ur
l
ϕ and , so the empirical best linear unbiased predictors (EBLUPs) are obtained by substituting estimates for these parameters. In what follows, we describe an algorithm that calculates these EBLUPs by combining the above method for calculating the BLUPs of , and u with ML and REML estimation of the variance components.
λ
β us r
Let denote the partition of the variance-covariance matrix corresponding
to the in sample and out of sample components of u. Similarly, put Ωss Ωsr
Ωrs Ωrr ⎡ ⎣ ⎢ ⎢ ⎤ ⎦ ⎥ ⎥ Ω
T*= Tss
* T
sr
*
Trs* T
rr * ⎡ ⎣ ⎢ ⎢ ⎤ ⎦ ⎥ ⎥= ′
ZsWs−1Z
s+ϕ
−1Λ
s|r −ϕ
−1Λ
s|rΩsrΩrr
-1
−ϕ−1Ω
rr
-1Ω
rsΛs|r ϕ
−1(Ω
rr
-1+ Ω
rr
-1Ω
rsΛs|rΩsrΩrr
-1 ) ⎡ ⎣ ⎢ ⎢ ⎤ ⎦ ⎥ ⎥ −1
where . An iterative procedure for obtaining the ML estimates
of
Λs|r =(Ωss − ΩsrΩrr-1Ωrs)−1
ϕ and λ for given σ2is then:
1. Assign initial values to the variance components ϕ andλ.
where Σs*−1=W−1−W−1ZsTss*Z W′ −1 .
s
4. Update us =T Z Wss* ′s s−1(θ − β) Xs . 5. Update r sr* s s1( s
−
′
u =T Z W θ −Xβ).
6. Update ϕ= Ds−1(tr(Tss*Ω .
s
−1
)+σ−2u′sΩs−1us)
7. Check for convergence of the different estimates. If not return to step 2. 8. Update λ= f( , ,λ ϕ Tss*,σ2,us) where f is the Fisher score or Newton-Raphson
updating function for this parameter, i.e. a function whose specification depends on the parameterization of Ω, and where current values for variance
components are used in the right hand side of this equation.
9. Return to step 2 and repeat the procedure until the values of the different parameters converge.
We denote the final values of β, us and ur output by the above iterative process by βˆ, ˆs
u and respectively. These estimates are then substituted in (1) to give the
ML-based EBLUP of ˆr
u
ˆ
θ θ,
ˆ ˆ ˆ
ˆ
ˆ ˆ ˆ
s s s s
r r r
⎡ ⎤ ⎡ + ⎤
=⎢ ⎥ ⎢= ⎥
+
⎢ ⎥ ⎢ ⎥
⎣ ⎦ ⎣ ⎦
X Z u X Z u
θ β
θ
θ β r . (4)
In order to define the REML-based EBLUP, we modify this iterative procedure to give the REML estimates of ϕ and λ. Define
V= ′
XswWs−1Xsw X′swWs−1Zs 0 ′
ZsWs−1X
sw Z′sWs
−1Z
s+ϕ
−1Λ
s|r −ϕ
−1Λ
s|rΩsrΩrr
-1
and let and be the partitions of the
matrix V and its inverse that correspond to the dimensions of V=
V11 V12 V13 V21 V22 V23 V31 V32 V33
⎡ ⎣ ⎢ ⎢ ⎢ ⎤ ⎦ ⎥ ⎥ ⎥ V
−1=T=
T11 T12 T13 . T22 T23 . . T33 ⎡ ⎣ ⎢ ⎢ ⎢ ⎤ ⎦ ⎥ ⎥ ⎥
β, and . Replacing
by in the iterative algorithm above leads to the REML estimates of the variance components, and hence to the REML-based EBLUP of
us ur
Tss
* T
22
θ.
4. Estimating the Mean Cross-Product Error (MCPE) Matrix
We first obtain the mean cross-product errors matrix (MCPE) of the ML-based EBLUP
estimator (4). This has prediction error
ˆ ˆ ˆ s s r r ⎡ − ⎤ − = ⎢ ⎥ − ⎢ ⎥ ⎣ ⎦ θ θ θ θ
θ θ , with
. Without loss of generality we assume that the population values are ordered so that values from the D
ˆ ˆ ˆ
MCPE( )θ =E[(θ θ θ θ− )( − )′]
s in sample areas precede the values from
the Dr = D - Ds out of sample areas. Put ω =(ϕ,λ ′′) . Then, following Prasad and Rao (1990) and after some algebra, we have
(5) 2
ˆ
MCPE( )θ ≅MCPE(θBLUP)+Mω(σ , ) ω
where
MCPE(θBLUP)=E[(θBLUP− θ)(θBLUP− θ ′) ]= Mβ(σ2, ω)+Mβu(σ2, ω)+Mu(σ2, ω) . Here and measure the uncertainty due to estimation of β and u;
is the covariance between the estimators of Mβ(ω) Mu(ω)
Mβu(ω) β and u and measures the
uncertainty due to estimation of the variance components
Mω(ω)
Mβ(σ2, ω)=σ2XT11X′
Mu(σ2, ω)=σ2ZT*Z′
and Mβu(σ2
,ω)= −σ2
[X(X′swΣs−1Xsw)−1X′swWs−1ZsT*Z′ +ZT*Z′
sWs
−1X
sw(X′swΣs
−1X
sw)
−1X′ ].
The final component is a measure of the uncertainty due to estimation of the variance components
Mω(σ2,ω)
ω =(ϕ λ ′′) and is defined as follows. Put
and let be the ∆ =ZT*=
[∆1′, ∆′2,...,∆′D]′ Zα αth row of the matrix , so that . Then
Z
∂∆α /∂ω = ∂(ZαT*) /∂ω
Mω(σ2, ω)=σ2[tr(∇αΣs*∇′α′B)]
where Σs* = ′ZsWs−1Zs+ϕZ′sWs−1Zs½sZ′sWs−1Zs and ∇α is the first Ds columns of the matrix . Here B is the asymptotic variance-covariance matrix of the estimator of the variance components vector
∂∆α /∂ω
ω. An estimator of the MCPE matrix of the EBLUP is therefore
ˆ θ
n ˆ 2 ˆ 2 ˆ 2 ˆ
( ) ( , ) u( , ) u( , ) 2 ( , )
MCPE θ =Mβ σ ω +Mβ σ ω +M σ ω + Mω σ2 ωˆ (6)
where ωˆ is the ML estimate of the variance components vector ω.
In order to define the corresponding estimator of the MCPE matrix of the REML-based EBLUP, we replace the ML estimate ˆω and its asymptotic variance-covariance matrix, B by corresponding REML values, and evaluate at the REML estimates of the various parameters. Substitution in (6) then yields the REML-based estimator of the MCPE matrix.
5. Simulation Results
In this section we use simulation to demonstrate how the new methodology outlined above provides improved results compared with existing EBLUP methods for small area estimation when not all areas of interest are represented in sample. The population values were generated from a linear mixed model with spatially correlated area random effects, defined by
. (7) ydi =0.5+xdi+ud +edi
The values were independently generated from a normal distribution with zero mean and variance . The values were generated from a
multivariate normal distribution with zero mean vector and variance-covariance matrix edi
σ2 u=
[u1,u2,...,uD
s
,...,uD]′
(8) σu2Ω(λ
)=σu2[(ID−λΨ)(ID−λΨ′)]−1
where ID is an identity matrix of order D and Ψ is a known square matrix of the same order containing strictly positive weights. This is the SAR or simultaneous
autoregressive model (Cressie, 1993). Let Ψ0 =[ψ0ij] to be a D×Dmatrix with = 1 if areas i and j are considered “spatial neighbours” and is zero otherwise. The weight matrix was then constructed by scaling the elements of to have row sums equal to one. Two different versions for Ψ were used, defined by the regional maps for Ghana and Nigeria provided in Cliff and Ord (1973). The values were generated from a uniform distribution between 0 and 1 and were kept fixed throughout the simulations. Values of were generated for D = 40 (Ghana) and D = 50 (Nigeria) with 90 population units per area. The first D
ψ0ij
Ψ Ψ0
0
xdi
ydi
sample. Random samples of size nd were taken from each in sample area, with nd increasing with d. The population data were aggregated to yield area level means for both in sample and out of sample areas. The sample data from the in sample areas were also aggregated to produce corresponding sample means, which were then used to estimate the model parameters via REML. Note that under the SAR model (8) the updating equation for the parameter λ under the Fisher scoring method (see step 8 of the EBLUP estimation procedure described in section 3) is given by
λk = λk−1+b1b2
where and
is the (2, 2) element of inverse of the information matrix for the estimators
b1 = −0.5[ϕ−1σ−2u′s(∂Ωss−1/∂λ)us+ϕ−1tr((∂Ωss−1/∂λ)T22* )−tr((∂Ωss−1/∂λ)Ωss−1)]
b2 ϕˆ and λˆ.
Note that we fixed at its true value throughout the estimation process. The information matrix of the REML estimators
σ2
ˆ
ϕ and λˆ is given by
IREML = 1 2
ϕ−2
(ν−2r1)+ϕ−4r11 ϕ−1(2k1-v1−ϕ−1k11) . (ϕ−2k11(11)+v11−2k1(11)) ⎡
⎣ ⎢ ⎢
⎤
⎦ ⎥ ⎥
where
r1=ϕ1tr(Ωss−1T22),
r11=tr(Ωss−1T22Ωss−1T22),
k1=ϕ−1tr((∂Ωss−1/∂λ)T22),
v1=tr((∂Ωss−1/∂λ)Ωss),
k11 =ϕ-1tr(T22(∂Ωss−1/∂λ)T22Ωss−1),
v11 =tr((∂Ωss−1/∂λ)Ωss(∂Ωss−1/∂λ)Ωss),
k11(11) =
k1(11) =ϕ−1tr[(∂Ωss−1/∂λ)T22(∂Ωss−1/∂λ)Ωss].
Given the above set up, we considered four ways of defining the small area estimates. The first corresponded to a synthetic estimation procedure, where the mixed model defined by (7) and (8) is first fitted to the sample data, but then estimation is carried out on the basis that ud = 0 in every small area. We refer to this as method A below. The second also fits (7) and (8) to the sample data, but forces λ=0 in (8), i.e. this method assumes there is no spatial correlation among the area effects. Estimation then
incorporates predicted area effects for in sample areas, but sets these to zero for out of sample areas. This is denoted method B in what follows. In contrast, the third method takes account of the correlation between areas when estimating the model parameters. However, it still sets the predicted value of u to zero for out of sample areas. We refer to this as method C. Finally, the fourth method, denoted D, corresponds to the EBLUP procedure defined earlier in this paper.
d
The process of generating population and sample data, estimation of model parameters and calculation of (A) – (D) was independently replicated 3000 times. For each set of estimates and each small area d we then calculated the actual and average estimated mean squared errors
ˆ θ
3000
1
ˆ ˆ
( )( ) / 3000
d d k k k k
k
ActMSE diag =
⎛ ′ ⎞
= ⎜ − − ⎟
⎝
∑
θ θ θ θ ⎠n 3000
1
ˆ
( ) / 3000
d d k
k
EstMSE diag MCPE =
⎛ ⎞
= ⎜ ⎟
where diagd(X) denotes the dth element of the main diagonal of X. The actual coefficient of variation
ActCVd =100× ActMSEd
θdk / 3000
k=1
3000
∑
and the estimated coefficient of variation
3000
1 100
ˆ / 3000
d d
dk k
EstMSE EstCV
=
= ×
∑
θwere then calculated, as was the average coverage of the area d total by the nominal 95% confidence intervals defined by these estimated mean squared errors.
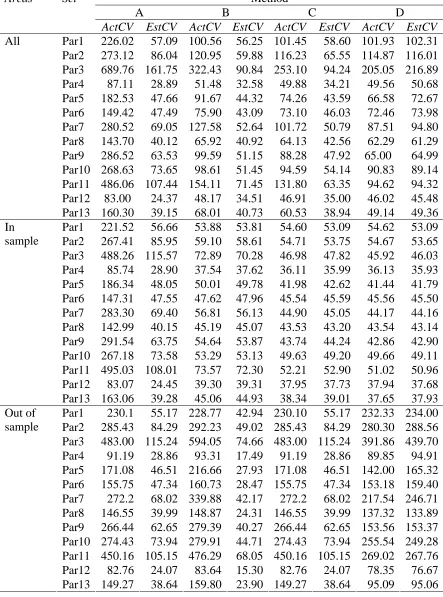
that average values of ActCV for Methods B, C and D in Table 2 are very similar for small values of λ, but use of Method D leads to substantial gains in efficiency for large values of σu2 and λ. As might be expected, these gains are more pronounced for large values of D.
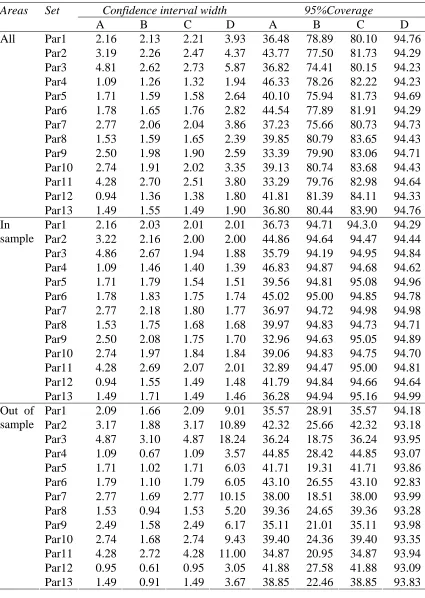
Irrespective of potential increases in efficiency, an important gain from modelling the spatial correlation of the area random effects is better estimation of mean squared error. This is confirmed in Table 3 where we see that prediction intervals generated under Method A generally lead to severe undercoverage because they are based on
conditionally biased synthetic estimators. In contrast, intervals generated under Method B has good coverage for in sample areas, but a very poor coverage for out of sample areas (even when there is no spatial correlation), reflecting this method’s use of
conditionally biased synthetic estimators for out of sample areas. There also seems to be some evidence that this coverage gets worse as this spatial correlation increases. The same pattern applies for the results generated by Method C, with somewhat better coverage for out of sample areas. On the other hand, Method D records coverages very close to the nominal 95% level for in sample areas, and only slightly less for out of sample areas. Furthermore, this overall good performance holds across all sets of parameter values investigated, including where there is no spatial correlation. Note that larger values of D also lead to better coverage performance.
wide confidence intervals. This reflects large standard error estimates under Method A for these values of σu2 and λ. However, in spite of these large estimated standard errors, prediction interval coverages are very far from the nominal 95% level because of the biased estimators under this method. Small differences in covariate values for in sample and out of sample areas leads to insignificant differences in average confidence interval width for Method A. However, the three other methods considered, especially Method D, lead to significant differences in average confidence interval width between in and out of sample areas in such situations.
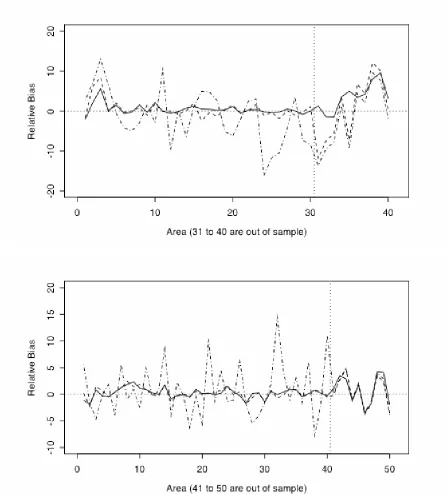
Finally, in Figure 1 we show the variation in relative bias for Methods A, B and D by area for both in and out of sample areas for two parameter sets (par3 and par 11). These confirm the overall superiority of Method D.
6. Summary and Discussion
In this article we develop EBLUP estimates for small area means under a Fay-Herriot type model when there are no sample units in the area. The model assumes spatially correlated area effects defined by the SAR model (8). Our simulations indicate that our proposed method has the potential to lead to substantial increases in prediction
efficiency for these areas when there is strong spatial correlation in the data. They also show that the estimates of mean squared error calculated under the spatial model are much more accurate than those based on the usual synthetic estimates that are often used for out of sample area prediction. As a consequence, confidence intervals based on these estimates of mean squared error tend to be more accurate, in the sense of
simulation results just by leaving 10 areas out of sample, out of a total of 40 (Ghana scenario) and 50 (Nigeria scenario). We anticipate that the better performance of Method D relative to that of Methods A – C will become even more clear when the proportion of out of sample areas increases.
Note that our method makes the usual area level data assumption (e.g. Rao and Yu, 1994) that is known. Recently, Wang and Fuller (2003) have investigated methods for fitting area level models without this assumption, and work is underway to see whether their ideas can be applied here.
σ2
References
Butar, F.B. and Lahiri, P., 2003. On measures of uncertainty of empirical Bays small-area estimators. Journal of Statistical Planning and Inference 112, 63 – 76.
Cliff, A.D. and Ord, J.K., 1973. Spatial Autocorrelation. Pion, London. Cressie, N., 1993. Statistics for Spatial Data. John Wiley, New York.
Datta, G.S. and Lahiri, P., 2000. A unified measure of uncertainty of estimated best linear unbiased predictors in small area estimation problems. Statistica Sinica 10, 613 – 627.
Fay, R.E. and Herriot, R.A., 1979. Estimates of income for small places: An application of James-Stein procedures to census data. Journal of the American Statistical
Association 74, 269 – 277.
Ghosh, M. and Rao, J.N.K., 1994. Small area estimation: an appraisal. Statistical Science 9, 55 - 93.
Harville, D.A., 1977. Maximum likelihood approaches to variance component
estimation and to related problems. Journal of the American Statistical Association 72, 320-340.
Henderson, C.R., 1950. Estimation of genetic parameters (abstract). The Annals of Mathematical Statistics 21, 309 – 310.
Henderson, C.R., 1975. Best linear unbiased estimation and prediction under a selection model. Biometrics 31, 423-447.
Rao, J.N.K. and Yu, M., 1994. Small area estimation by combining time-series and cross-section data. The Canadian Journal of Statistics 22, 511 - 528.
Saei, A. and Chambers, R., 2005. Empirical best linear unbiased prediction for out of sample areas. Working Paper M05/03, Southampton Statistical Sciences Research Insitute, University of Southampton, UK.
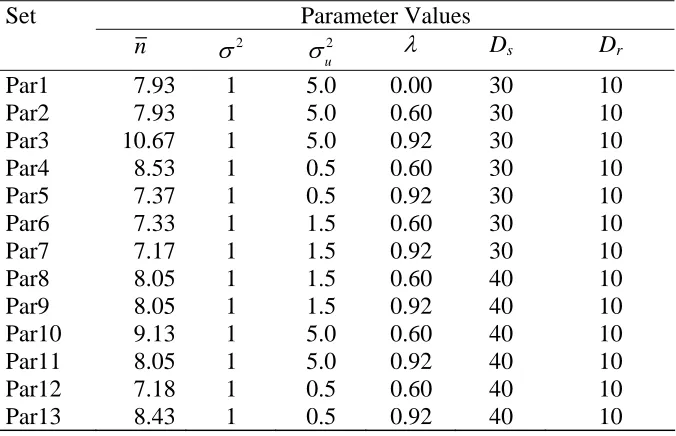
Table 1. Parameter sets used in the simulations. Note Ds= number of in sample areas, Dr= number of out of sample areas and n is average sample size for in sample areas.
Set Parameter Values
n σ2 σu2 λ Ds Dr
Par1 7.93 1 5.0 0.00 30 10
Par2 7.93 1 5.0 0.60 30 10
Par3 10.67 1 5.0 0.92 30 10
Par4 8.53 1 0.5 0.60 30 10
Par5 7.37 1 0.5 0.92 30 10
Par6 7.33 1 1.5 0.60 30 10
Par7 7.17 1 1.5 0.92 30 10
Par8 8.05 1 1.5 0.60 40 10
Par9 8.05 1 1.5 0.92 40 10
Par10 9.13 1 5.0 0.60 40 10
Par11 8.05 1 5.0 0.92 40 10
Par12 7.18 1 0.5 0.60 40 10
Table 2 Estimated coefficients of variation (EstCV) and actual coefficients of variation (ActCV) for different methods of estimation, averaged over the small areas. Areas denotes the small areas whose values are averaged, while Set denotes the set of parameter values used in the simulation (see Table 1 for their definition).
Method
A B C D Areas Set
ActCV EstCV ActCV EstCV ActCV EstCV ActCV EstCV Par1 226.02 57.09 100.56 56.25 101.45 58.60 101.93 102.31 Par2 273.12 86.04 120.95 59.88 116.23 65.55 114.87 116.01 Par3 689.76 161.75 322.43 90.84 253.10 94.24 205.05 216.89 Par4 87.11 28.89 51.48 32.58 49.88 34.21 49.56 50.68 Par5 182.53 47.66 91.67 44.32 74.26 43.59 66.58 72.67 Par6 149.42 47.49 75.90 43.09 73.10 46.03 72.46 73.98 Par7 280.52 69.05 127.58 52.64 101.72 50.79 87.51 94.80 Par8 143.70 40.12 65.92 40.92 64.13 42.56 62.29 61.29 Par9 286.52 63.53 99.59 51.15 88.28 47.92 65.00 64.99 Par10 268.63 73.65 98.61 51.45 94.59 54.14 90.83 89.14 Par11 486.06 107.44 154.11 71.45 131.80 63.35 94.62 94.32 Par12 83.00 24.37 48.17 34.51 46.91 35.00 46.02 45.48 All
Par13 160.30 39.15 68.01 40.73 60.53 38.94 49.14 49.36 Par1 221.52 56.66 53.88 53.81 54.60 53.09 54.62 53.09 Par2 267.41 85.95 59.10 58.61 54.71 53.75 54.67 53.65 Par3 488.26 115.57 72.89 70.28 46.98 47.82 45.92 46.03 Par4 85.74 28.90 37.54 37.62 36.11 35.99 36.13 35.93 Par5 186.34 48.05 50.01 49.78 41.98 42.62 41.44 41.79 Par6 147.31 47.55 47.62 47.96 45.54 45.59 45.56 45.50 Par7 283.30 69.40 56.81 56.13 44.90 45.05 44.17 44.16 Par8 142.99 40.15 45.19 45.07 43.53 43.20 43.54 43.14 Par9 291.54 63.75 54.64 53.87 43.74 44.24 42.86 42.90 Par10 267.18 73.58 53.29 53.13 49.63 49.20 49.66 49.11 Par11 495.03 108.01 73.57 72.30 52.21 52.90 51.02 50.96 Par12 83.07 24.45 39.30 39.31 37.95 37.73 37.94 37.68 In
sample
Par13 163.06 39.28 45.06 44.93 38.34 39.01 37.65 37.93 Par1 230.1 55.17 228.77 42.94 230.10 55.17 232.33 234.00 Par2 285.43 84.29 292.23 49.02 285.43 84.29 280.30 288.56 Par3 483.00 115.24 594.05 74.66 483.00 115.24 391.86 439.70 Par4 91.19 28.86 93.31 17.49 91.19 28.86 89.85 94.91 Par5 171.08 46.51 216.66 27.93 171.08 46.51 142.00 165.32 Par6 155.75 47.34 160.73 28.47 155.75 47.34 153.18 159.40 Par7 272.2 68.02 339.88 42.17 272.2 68.02 217.54 246.71 Par8 146.55 39.99 148.87 24.31 146.55 39.99 137.32 133.89 Par9 266.44 62.65 279.39 40.27 266.44 62.65 153.56 153.37 Par10 274.43 73.94 279.91 44.71 274.43 73.94 255.54 249.28 Par11 450.16 105.15 476.29 68.05 450.16 105.15 269.02 267.76 Par12 82.76 24.07 83.64 15.30 82.76 24.07 78.35 76.67 Out of
Table 3 Confidence interval width and coverage of nominal 95% confidence intervals (95%Coverage) generated by different methods of estimation, averaged over the small areas. Areas denotes the set of small areas whose values are being averaged, while Set denotes the set of parameter values used in the simulation (see Table 1 for their definition).
Confidence interval width 95%Coverage Areas Set
A B C D A B C D Par1 2.16 2.13 2.21 3.93 36.48 78.89 80.10 94.76 Par2 3.19 2.26 2.47 4.37 43.77 77.50 81.73 94.29 Par3 4.81 2.62 2.73 5.87 36.82 74.41 80.15 94.23 Par4 1.09 1.26 1.32 1.94 46.33 78.26 82.22 94.23 Par5 1.71 1.59 1.58 2.64 40.10 75.94 81.73 94.69 Par6 1.78 1.65 1.76 2.82 44.54 77.89 81.91 94.29 Par7 2.77 2.06 2.04 3.86 37.23 75.66 80.73 94.73 Par8 1.53 1.59 1.65 2.39 39.85 80.79 83.65 94.43 Par9 2.50 1.98 1.90 2.59 33.39 79.90 83.06 94.71 Par10 2.74 1.91 2.02 3.35 39.13 80.74 83.68 94.43 Par11 4.28 2.70 2.51 3.80 33.29 79.76 82.98 94.64 Par12 0.94 1.36 1.38 1.80 41.81 81.39 84.11 94.33 All
Par13 1.49 1.55 1.49 1.90 36.80 80.44 83.90 94.76 Par1 2.16 2.03 2.01 2.01 36.73 94.71 94.3.0 94.29 Par2 3.22 2.16 2.00 2.00 44.86 94.64 94.47 94.44 Par3 4.86 2.67 1.94 1.88 35.79 94.19 94.95 94.84 Par4 1.09 1.46 1.40 1.39 46.83 94.87 94.68 94.62 Par5 1.71 1.79 1.54 1.51 39.56 94.81 95.08 94.96 Par6 1.78 1.83 1.75 1.74 45.02 95.00 94.85 94.78 Par7 2.77 2.18 1.80 1.77 36.97 94.72 94.98 94.98 Par8 1.53 1.75 1.68 1.68 39.97 94.83 94.73 94.71 Par9 2.50 2.08 1.75 1.70 32.96 94.63 95.05 94.89 Par10 2.74 1.97 1.84 1.84 39.06 94.83 94.75 94.70 Par11 4.28 2.69 2.07 2.01 32.89 94.47 95.00 94.81 Par12 0.94 1.55 1.49 1.48 41.79 94.84 94.66 94.64 In
sample
Par13 1.49 1.71 1.49 1.46 36.28 94.94 95.16 94.99 Par1 2.09 1.66 2.09 9.01 35.57 28.91 35.57 94.18 Par2 3.17 1.88 3.17 10.89 42.32 25.66 42.32 93.18 Par3 4.87 3.10 4.87 18.24 36.24 18.75 36.24 93.95 Par4 1.09 0.67 1.09 3.57 44.85 28.42 44.85 93.07 Par5 1.71 1.02 1.71 6.03 41.71 19.31 41.71 93.86 Par6 1.79 1.10 1.79 6.05 43.10 26.55 43.10 92.83 Par7 2.77 1.69 2.77 10.15 38.00 18.51 38.00 93.99 Par8 1.53 0.94 1.53 5.20 39.36 24.65 39.36 93.28 Par9 2.49 1.58 2.49 6.17 35.11 21.01 35.11 93.98 Par10 2.74 1.68 2.74 9.43 39.40 24.36 39.40 93.35 Par11 4.28 2.72 4.28 11.00 34.87 20.95 34.87 93.94 Par12 0.95 0.61 0.95 3.05 41.88 27.58 41.88 93.09 Out of
sample