International Journal of Innovative Technology and Exploring Engineering (IJITEE) ISSN: 2278-3075, Volume-8 Issue-6, April 2019
Abstract: In the previous centuries, our deterministic view of a decisive disease like cancer led us to imagine that only clinical therapy seems to be the ultimate source for prediction of a disease. But the emergence of Machine learning techniques has contributed an astonishingly intellectually efficient mechanism for solving numerous complex biological problems with minimal complexity. Keeping an eye on the need of preliminary detection of initial stages of cancer development, we have reshaped our perception for prediction by implementing certain interdisciplinary fields like Game theory, numerical linear algebraic methods and statistics to reach a valid conclusion. In our work, a model is formulated to determine the existence of malignant neoplasm in the patients sample set using Gauss-Newton method. Our model aims at predicting the class label of an unknown new sample that enters into the system during the runtime. An apodictic approach for construction of an optimized RFE (Recursive Feature Elimination) feature selection model using Dualist Algorithm is incorporated. Furthermore, the optimized features are subjected to a non-linear classification using Decision Tree, K-Nearest Neighbor and Logistic Regression on Wisconsin Breast cancer dataset. In addition, we have applied Euclidean distance and Manhattan Distance to select the most contributing features in a sparsely represented dataset. The simulations carried out using Gauss-Newton method, Logistic Regression, K-nearest neighbor, Decision Tree and Random Forest. Dualist Optimization algorithm with Recursive feature elimination is combined with five different classifier models are experimented. Features with minimum Euclidean distance and Manhattan distance from the sample data are also chosen for training the model and is further optimized using the suggested algorithm.
Index Terms: Classification Models, Game theory, Dual-RFE, k-fold cross validations.
I. INTRODUCTION
The line of research in the field of bioinformatics can be diversified to deal with sparse based representation of data [18]. Intuitively, researchers have developed a handful of computational techniques that could efficiently simulate with a better complexity than the classical methods. Recent studies have illuminated cancer, to be a genotypic disease that occurs due to series of assimilation of genetic alterations in oncogenes, tumor suppressor genes and stability genes
Revised Manuscript Received on April 07, 2019.
Prachi Vijayeeta, School of Computer Engineering, Kalinga Institute of Industrial Technology, [Deemed to Be University], Bhubaneswar.
M. N. Das, School of Computer Engineering, Kalinga Institute of Industrial Technology, [Deemed to Be University], Bhubaneswar.
B. S. P. Mishra, School of Computer Engineering, Kalinga Institute of Industrial Technology, [Deemed to Be University], Bhubaneswar.
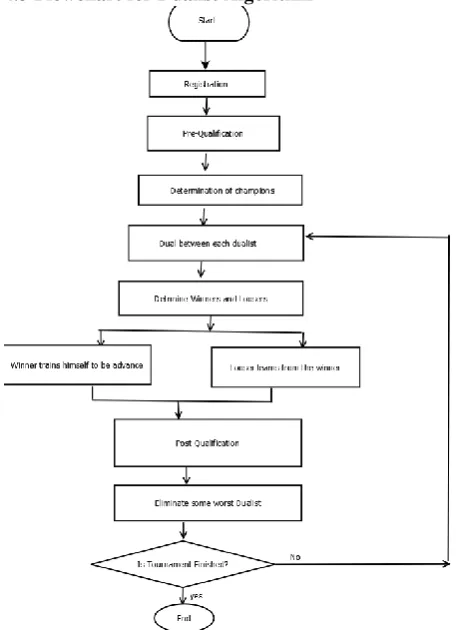
[11]. It is very evident, that almost every researcher suffered from a great hurdle of high dimensionality of dataset due to the presence of irrelevant genes. Upon rigorous studying of previous literatures, we have explored that hardly much of the work have been suggested related to data sparsity. This research gap has been the motivating factor behind the derivation of various computationally robust techniques to yield accurate results. An embedded method (combination of filter and wrapper class) namely Recursive Feature Elimination technique [17] is applied for feature selection and then to choose the optimal features we have implemented Dualist Algorithm. Four non-linear classification techniques namely Decision Tree [14], K-Nearest Neighbor [7] and Logistic Regression, Random Forest were applied on Winconsin Breast Cancer to classify the occurrence of cancerous or non-cancerous cells. The Dualist Optimization algorithm applied in this paper is basically a population based human inspired algorithm. The most significant property of this algorithm is to minimise the blind effect of getting better optimal solution and thus succeeds in generating the global optimal solution for the best features in entire search space. Totok Ruki Biyanto (2015) [5] along with his team formulated this algorithm by analysing the behaviour of the players during a tournament. The most pertinent players (features in our problem) are selected based upon their skillset, strength, intellectual property, luck and decision making capability. The non-pertinent players are thereby removed from team and the remaining players are trained for further competing in the game. This iterative procedure goes on at a faster rate in dual procedure algorithm as compared to other evolutionary game theory and nature inspired algorithm. In DA, all the individuals in a population is defined as Dualist who keep on fighting one-by-one to determine the winners or losers or champions by taking into account their strength, skill, luck and intellectual capability. The loser learns from the winner and in the mean while the winner tries to improve their new potential by training or by adopting some new methods from the opponents. The dual participant with highest fighting skill is called champion who can train a new dualist. The newly generated dualist shall further participate in the tournament as a representative of each champion. Combinedly, all the dualist is re-evaluated for the next match and the one possessing the minimal fighting capability will thereby be rejected from the list. A comparative study is carried out among Gauss-Newton based algorithm [20],
A Novel Approach for Classification of
Malignant Neoplasm Using Non-Linear Dualist
Optimization Algorithm
Decision Tree, K-Nearest Neighbors and Logistic Regression, Random Forest were applied on Winconsin Breast Cancer and Ovarian cancer dataset to classify the occurrence of malignant cells.
II. LITERATURE REVIEW
Abreu[1] have lucidly surveyed many Machine Learning(ML) techniques and estimated there performance on local and open source databases. Ahmad et al.[2] had experimented Decision Tree, Random forest, SVM, K-means algorithms are integrated with feature selection methods (like RFE, chi-square test, correlation based feature selection) to discover hidden patterns for developing predictive models were applied on it. Agarap et al. (2018) [3] had applied GRU-SVM (Gated Recurrent Unit-SVM) model on Winconsin benchmark dataset that resulted in a better complexity. Michalis et al. (2015) [6] had integrated ML techniques (like ANN, Kernel-SVM ) along with robust feature selection methods. Yue et al.(2018)[8] have reviewed a couple of ML techniques applied in intelligent healthcare system. Their study concluded that Switched Particle Swarm Optimization (SPSO) based on Markov chain have achieved faster local convergence speed with higher accuracy. Ahmed et al.(2015)[9]had applied generative approach called Probabilistic Principal Component Analysis (PPCA)for dimensionality reduction and Gaussian Mixture Model (GMM) as well as Mixture of Normalized Linear Transformation for classification. Wang et al. (2017) [10] had proposed a Deep Learning algorithm and a Deep graph to yield the coefficient of determination of breast arterial cancer. Chandra et al.[12]had proposed a non-linear integrated model named Spiking Wavelet Radial Basis Neural Network and compared the classification accuracy with Wavelet Probabilistic Model Building Genetic Algorithm (PMBGA) was proposed by Topon Kumar Paul, Hitoshi Iba,2005[13] for selection of a smaller size gene subset . A hybrid intelligence model that uses the cluster analysis techniques with feature selection for analyzing clinical breast cancer diagnoses was suggested by Chen et al.[15].Bhardwaj & Tiwari [16] had proposed a Genetically Optimized Neural Network for cancer diagnosis that could map GONN to its equivalent Feed Forward Neural Network thereby yielding a better accuracy. A multi-objective Particle swarm optimization for feature selection was suggested by Xue et al.[19] to generate a Pareto front of non-dominated solutions (feature subsets). A new fuzzy model structure was designed by Abonyi et al. [21] where each of the fuzzy rules could represent more than one classes with different probabilities. The classifier was basically an extension of the quadratic Bayes classifier that utilizes a combination of models for estimating the class conditional densities. The main aim of this fuzzy model is to provide a supervised clustering mechanism for determining the class labels. Peng [22] had constructed a model by integrating filter and wrapper methods (hybrid method) into a sequential search procedure with an aim to improve the classification performance of the features selected. Prasad et al.[23] had applied the SVM based classifier in combination with nature inspired swarm intelligence techniques like PSO, ACO, GA on cancer gene benchmark dataset. Ananda Kumar [24] had chosen Analysis of Variance (ANOVA) ranking scheme for
selecting the feature subsets. He then applied a classifier that uses Fast Adaptive Neuro-Fuzzy Inference System (FANFIS) to determine the class labels. Modified Levenberg-Marquardt algorithm is used in the learning phase of this classification model.
III. MOTIVATION AND WORKFLOW
In our work we have adopted Gauss-Newton method for non-linear supervised learning to conjecture the exact class type of an unknown sample arriving dynamically. Therefore, we are motivated to make use of this numerical algebraic approach for obtaining a global optimal solution. Moreover, we have used four non-linear classifiers namely Decision Tree (DT), Logistic Regression (LR), K-Nearest Neighbor (KNN) and Random forest (RF) on WBDC dataset to predict the class label of the samples. A comparative study is pursued on all of the above 5 technique based upon their accuracy. The Workflow consists of two phases i.e Build Phase and Operational Phase.
A. Build Phase: - It includes the following tasks to be carried out prior to the commencement of learning stages.
(i) Gathering the data (ii) Pre-Processing the data
(iii) Decomposing the data into train and test datasets
(iv) Choosing the appropriate model and training the
Data using scikit learn with python-anaconda.
B. Operational Phase: - This phase mainly focuses on the activities as follows:
(i) Prediction Evaluation
(ii) Accuracy Estimation (both test accuracy and train accuracy
(iii) Hyperparameter Tuning
(iv) Performance measure estimation.
3.1 Build Phase
3.3.1 Gathering of Data
We have used Wisconsin Breast Cancer Dataset (WBCD)
for our experiment
(https://archive.ics.uci.edu/ml/datasets/Breast+Cancer+ Wisconsin+(Diagnostic).The software tool used is scikit-learn with python-anaconda. It constitutes of 569 samples with 31 attributes and 2 class labels (Benign /Malignant). The main aim of the cancer classification problem is to correctly identify the class labels (benign or malignant) of an unknown
International Journal of Innovative Technology and Exploring Engineering (IJITEE) ISSN: 2278-3075, Volume-8 Issue-6, April 2019
3.3.2 Pre-Processing the data
It is very evident that there may be some missing values in a dataset as well as variation in the scales of the dataset which appears to be a nightmare in resulting good accuracy. Therefore, we need to clean up those noisy data by normalizing it so that all the values ranges between 0 to 1.
3.3.3 Decomposing the data into train and test datasets
To have a convenient and faster analysis it is quite necessary to divide the sample data set into a ratio of 70% training data and the remaining 30% for the sake of testing the efficiency of the learning model. Many a times it may so happen that if we change the split ratio then it will affect the model output.
3.3.4 Choosing the appropriate model and training the data using scikit learn with python-anaconda
3.3.4.1 Feature Selection
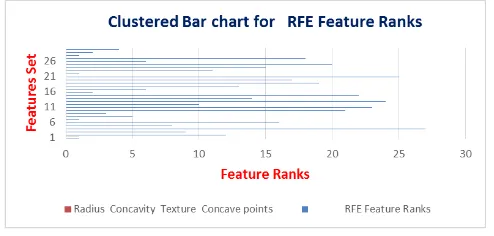
Feature selection phenomenon refers to the selection of the most contributing features from the sample set. It is mostly represented using a n-dimensional vector [25]. Very often the dimension of the clinical data seems to be very huge and as a result the efficiency of the model is badly affected. From our previous literature, we have studied that it is a good advice to choose only the most relevant features to train our model. In our work we have applied Euclidean Distance [20] and Recursive feature selection algorithm (hybrid) technique for feature selection. Moreover we have also optimises the best features using Dualist Algorithm [5]. Recursive feature elimination is an ensemble method that uses feature ranking mechanism to select the appropriate features. Table 2 represents the ranks of the features with True value to be the most feasible one and the false values are rejected by repeated calculations. Fig 3 represents the graph being plotted for the ranks. We have also used another one method that computation of Euclidean distance (l2 norm) between the test sample y and the training sample
Error! Reference source not found.. A large
Error! Reference source not found. indicates that the sample Error! Reference source not found. is an unsuitable training sample and needs to be discarded. Our primary goal is to formulate an objective function that will minimize the distance Error! Reference source not found.. We have applied a new optimization algorithm called as Dualist Algorithm whose concept is based on Game Theory. Initially, the Euclidean distance is calculated as follows: -
Error! Reference source not found. (1)
3.3.4.2 Choosing and applying appropriate models
1. Gauss-Newton Method
We have applied Gauss-Newton method to test a sample Error! Reference source not found. which is a combination of linear weights of the input feature vector
Error! Reference source not found.. Therefore, the expression is formulated as follows:
(2)
Where Error! Reference source not found. are N training samples with Error! Reference source not found. is a N-vector of weighting coefficients allotted to each training sample Error! Reference source not found.. Our main goal is to obtain the optimal value of Error! Reference source not found. that will enable us to obtain a best solution. Many researchers have proposed lot of optimization techniques to yield the global optimal solution. The fitness function is a non-linear function that minimizes the sum of the squared error (SSE).
Therefore, Error! Reference source not found. (3) Where Error! Reference source not found. is the Regularization parameter used to obtain a stable solution by avoiding singularity. It is an additional penalty term applied to the fitness function to control the model complexity and to solve over fitting problems in machine learning. We can choose the value of Error! Reference source not found. [20]. But while simulating, for Error! Reference source not found. we get variations in the values of the objective function. Gauss Newton method is used to minimise equation (3) by updating the values of Error! Reference source not found. in each iterations with the formula as follows:
Error! Reference source not found. (4)
Where Error! Reference source not found.
Error! Reference source not found. is the Identity Matrix
Error! Reference source not found.= Desired O/P – Actual O/P
Error! Reference source not found. is the
Transpose of the Input feature vector.
2. Logistic Regression
3. K-nearest neighbor
In pattern recognition, the k-nearest neighbors algorithm (k-NN) is a non-parametric method that does not assume anything about the underlying data. This property of k-NN (where k is any integer) method is useful for classification and regression of real world clinical data that most often do not possess any theoretical assumption of linear separability or any uniform distributions. It simply calculates the distance of a new data point to all other training data points. Generally Euclidean or Manhattan
distance is calculated with respect to nearest data points. In this section we have imported K-Neighbors Classifier
class from sklearn.neighbors package of python scikit learn. Data is pre-processed by importing Standard Scalar from sklearn.preprocessing. Then we have used Dualist optimization algorithm for finding best value of K.
IV. DECISION TREE
It is a graphical representation of conditions with corresponding possible solutions with one Root node and various child nodes. This type of supervised learning keeps on decomposing the training data by generating feasible decisions. Mostly there are 5 parameters that could be possible for optimization in decision tree model. Such as: Decision criterion, number of leaf nodes, split size, information gain and tree depth. Our optimization algorithm takes into account a combination of decision criterion and the information gain ratio as the parameter to be optimized. Decision Tree Classifier class is imported from sklearn.tree package of the python-anaconda tool.
RANDOM FOREST
Another supervised learning technique we have used in which is a combination of several decision trees. The overall population is splitted into sub-samples, on which a decision tree classifier is modelled to ensure better predictive accuracy and hence control over-fitting. We have
imported RandomForestClassifier class from
sklearn.ensemble package of python anaconda. Moreover, we have used the methods classification_report(), confusion_matrix(), accuracy_score() from sklearn.metrics package to estimate the values.
4. Research Framework
The basic framework of our research activity is modelled in a step wise manner as follows: -
Fig1:- Research Framework Diagram
4.1 Algorithm for the model Implemented Step-1: Input Pattern
Step-2: Computation and Optimization of Ranking Weights for all Features
(i) Set the input vector Error! Reference source not found.
(ii) Find the features possessing minimum weigweight:
(iii) Apply Dualist Optimisation algorithm to optimize the weights (Error! Reference source not found.). Call function dualist Opti ().
Step-3: Output Pattern
4.2 Dualist Optimization Algorithm (dualist_opti( ) )
Step-1 : Registration of Dual Candidates
Input a n-dimensional binary array for representing the skill set of the Dualist such that:Error! Reference source not found. Step-2 : Pre-Qualification Evaluation
Considering the skillset data, evaluate and test the fighting potential of each candidate within it.
Step-3 : Determination of Champion Board
International Journal of Innovative Technology and Exploring Engineering (IJITEE) ISSN: 2278-3075, Volume-8 Issue-6, April 2019
Step-4 : Dual List Improvement
Each dualist will fight using the fighting skill and luck to determine the winner and loser as follows:-
(a) Initialization:-
A_Dualist[ ] and B_Dualist[ ] two Binary array and Luck _coefficient.
(b) Computation of luck:-
(c) Winner-Loser Decision making:-
then
Error! Reference source not found.
else
End if
Step-5 : Define a Dual schedule between each dualist
The dualist fighting capabilities need to be improved for all the three participants:-
Step-6 : Elimination Phase
Elimination of features with low weights.
4.3 Flowchart for Dualist Algorithm
fig:2 FLOWCHART for dualist algorithm
V. EXPERIMENT AND RESULT
We have used Wisconsin Breast Cancer Dataset (WBCD) for our experiment
(https://archive.ics.uci.edu/ml/datasets/Breast+Cancer+ Wisconsin+(Diagnostic).The software tool used is scikit-learn with python-anaconda. It constitutes of 569 samples with 31 attributes and 2 class labels (Benign /Malignant). We have also used another dataset called ovarian cancer data set from UCI repository that contains 569 samples with 285 as Malignant and 284 as Benign.
5.1 Statistical Tests
In our work we have performed two types of tests:
1. t-Test: It is the comparison of two means of a group within a sample set. If the t-score value is larger then the groups are very dissimilar otherwise they are likely to be similar. The computational formula used is:
Error! Reference source not found.
Where Error! Reference source not found. is the difference between the two group value s.
[image:5.595.45.274.433.748.2]2. p-value Test :- It is the probability of estimating the observed values at the extreme end to represent the marginal level of significance. As a matter of convention, the level of significance is mostly chosen as 0.05 or 0.01 for N-1 degrees of freedom. If the value of Error! Reference source not found. then the null hypothesis is rejected otherwise it is selected. We have calculated the p-values of the classifiers in Table 5. Other statistical properties like specificity,
sensitivity, mean, confidence interval etc. are also demonstrated in Table 1 and Table 5.
[image:5.595.308.548.466.828.2]Table-2 Feature Rank Estimation
Table-3 Confusion matrix representation of classifiers.
Table- 4 Summary for accuracy, specificity, sensitivity of classifier model with RFE
Table-5 Optimised Statistical properties of classifiers
Table- 6 Summary of Dualist optimized Euclidean Distance
We have simulated the algorithms along with the application of a new Dualist optimization algorithm. The results shown in table in Table 4 and Table 7 reveals the statistical properties of all the classifiers used. Among all the methods used Random Forest with Dual-RFE yields an accuracy of 97.13%, followed by Decision Tree with an accuracy of 95.02%. In our work, we have split our dataset into 70% training and 30% test dataset. The later one succeeds in generating a better accuracy of nearly 1.985% on an average more than the previous method. 10, 5,3-fold cross validation is studied to evaluate the accuracy and reliability of the methods.
International Journal of Innovative Technology and Exploring Engineering (IJITEE) ISSN: 2278-3075, Volume-8 Issue-6, April 2019
5.2 Graph Plotting
5.2 Performance Measurement Criteria
[image:7.595.305.546.135.268.2]To improve the predictive performance and accuracy of the learning models, external validation is an absolute necessity. Initially, we need to split the labelled dataset into training and testing subsets using k-fold cross validation [6]. In this paper we have applied k-fold cross validation and have tested the accuracy forError! Reference source not found.In k-fold validation Fig 5, each sample is executed k-times for training and only once for testing.
Fig 3:- Graph for feature rankings
Table 8 Performance estimation using k-fold cross validation
From our experiment we have inferred that for different values of k the accuracy rate varies and we cannot assure that for increased value of k the accuracy will be higher [14], rather there can be drastic rise in the computational cost. A line graph has been plotted for demonstrating the k-fold validations.
VI. CONCLUSION AND FUTURE SCOPE
Evolutionary adaptations increases the overall fitness of the group but occurs at a cost to the individual. The main objective of this paper is to study the impact of dualist optimization algorithm for feature subset selection on WBCD dataset and Ovarian dataset. We have compared the various statistical properties of four different classification models with Recursive feature elimination method as well as with optimized Dualist RFE method. In both the datasets Random Forest has proved to yield a better accuracy as compared to other classifiers. Moreover the performance of the classifier for k=10, 5, 3 fold cross validation is evaluated and the variations in the average accuracy. For future work, we need to apply many more optimization techniques which may be any evolutionary and biologically inspired, population based algorithms on various filter or wrapper or ensemble feature selection methods. Efficient algorithms could be formulated with a view of generating best global solution with reduced computational cost. Moreover, we can also apply our techniques on various other standardized datasets like cervical cancer etc. from good repositories.
REFERENCES
1. Abreu, Pedro Henriques, Miriam Seoane Santos, Miguel Henriques Abreu, Bruno Andrade, and Daniel Castro Silva. "Predicting breast cancer recurrence using machine learning
2. techniques: a systematic review." ACM Computing Surveys (CSUR) 49, no. 3 (2016): 52.
3. Ahmad, L. Gh, A. T. Eshlaghy, A. Poorebrahimi, M. Ebrahimi, and A. R. Razavi. "Using three machine learning techniques for predicting breast cancer recurrence." J Health Med Inform4, no. 124 (2013): 3. 4. Agarap, Abien Fred M. "On breast cancer detection: an application of
machine learning algorithms on the Wisconsin diagnostic dataset."
In Proceedings of the 2nd International Conference on Machine
Learning and Soft Computing, pp. 5-9. ACM, 2018.
5. Ekgedawy, M. N. "Prediction of Breast Cancer using Random Forest, Support Vector Machinesand Naive Bayes." International Journal of
[image:7.595.46.293.214.332.2]6. Biyanto, Totok Ruki, Henokh Yernias Fibrianto, Gunawan Nugroho, Agus Muhamad Hatta, Erny Listijorini, Titik Budiati, and Hairul Huda. "Dualist algorithm: an algorithm inspired by how dualist improve their capabilities in a duel." In International Conference in Swarm
Intelligence, pp. 39-47. Springer, Cham, 2016.
7. Kourou, Konstantina, Themis P. Exarchos, Konstantinos P. Exarchos, Michalis V. Karamouzis, and Dimitrios I. Fotiadis. "Machine learning applications in cancer prognosis and prediction." Computational and
structural biotechnology journal 13 (2015): 8-17.
8. MOUNT,DAVID W.,CHARLES W.PUTNAM,SARA M.CENTOURI,ANN M. MANZIELLO, RITU PANDEY, LINDA L. GARLAND, AND JESSE D. MARTINEZ."USING LOGISTIC REGRESSION TO IMPROVE THE PROGNOSTIC VALUE OF MICROARRAY GENE EXPRESSION DATA SETS: APPLICATION TO EARLY-STAGE SQUAMOUS CELL CARCINOMA OF THE LUNG AND TRIPLE NEGATIVE BREAST CARCINOMA." BMC MEDICAL GENOMICS 7,
9. NO.1(2014):33.
10.Yue, Wenbin, Zidong Wang, Hongwei Chen, Annette Payne, and Xiaohui Liu. "Machine Learning with Applications in Breast Cancer Diagnosis and Prognosis." Designs 2, no. 2 (2018): 13.
11.Otoom, Ahmed Fawzi, Emad E. Abdallah, and Maen Hammad. "Breast Cancer Classification: Comparative Performance Analysis of Image Shape-Based Features and Microarray Gene Expression Data." International Journal of Bio-Science & Bio-Technology 7, no. 2 (2015): 37-46.
12.Wang, Juan, Huanjun Ding, Fatemeh Azamian Bidgoli, Brian Zhou, Carlos Iribarren, Sabee Molloi, and Pierre Baldi. "Detecting Cardiovascular Disease from Mammograms with Deep Learning." IEEE
Trans.Med. Imaging 36, no. 5 (2017): 1172-1181.
13.Vogelstein, Bert, and Kenneth W. Kinzler. "Cancer genes and the pathways they control." Nature medicine 10, no. 8 (2004): 789.
14.Chandra, Bala, and KV Naresh Babu. "Classification of gene expression data using spiking wavelet radial basis neural network." Expert systems
with applications 41, no. 4 (2014): 1326-1330.
15.Paul, Topon Kumar, and Hitoshi Iba. "Gene selection for classification of cancers using probabilistic model building genetic algorithm." BioSystems 82, no. 3 (2005): 208-225.
16.Nematzadeh, Zahra, Roliana Ibrahim, and Ali Selamat. "Comparative studies on breast cancer classifications with k-fold cross validations using machine learning techniques." In Control Conference (ASCC), 2015 10th Asian, pp. 1-6. IEEE, 2015.
17.Chen, Chien-Hsing. "A hybrid intelligent model of analyzing clinical breast cancer data using clustering techniques with feature selection." Applied Soft Computing 20 (2014): 4-14.
18.Bhardwaj, Arpit, and Aruna Tiwari. "Breast cancer diagnosis using genetically optimized neural network model." Expert Systems with
Applications 42, no. 10 (2015): 4611-4620.
19.Hastie, T. , Tibshirani, R. , & Friedman, J. (2009). The elements of statistical learning (2nd ed.). Springer Science & Business Media . 20.Mahmoudi, M. , & Sapiro, G. (2012). Sparse representations for range
data restora- tion. IEEE transactions on image processing: A publication of the IEEE Signal Pro- cessing Society, 21 (5), 2909–2915.
21.Xue, Bing, Mengjie Zhang, and Will N. Browne. "Particle swarm optimization for feature selection in classification: A multi-objective approach." IEEE transactions on cybernetics43, no. 6 (2013): 1656-1671.
22.Dora, Lingraj, Sanjay Agrawal, Rutuparna Panda, and Ajith Abraham. "Optimal breast cancer classification using Gauss–Newton representation based algorithm." Expert Systems with Applications 85 (2017): 134-145.
23.Abonyi, J. , & Szeifert, F. (2003). Supervised fuzzy clustering for the identification of fuzzy classifiers. Pattern Recognition Letters, 24 (14), 2195–2207 .
24.Peng, Yonghong, Zhiqing Wu, and Jianmin Jiang. "A novel feature selection approach for biomedical data classification." Journal of
Biomedical Informatics 43, no. 1 (2010): 15-23.
25.Prasad, Yamuna, K. Kanad Biswas, and Chakresh Kumar Jain. "SVM classifier based feature selection using GA, ACO and PSO for siRNA design." In International conference in swarm intelligence, pp. 307-314. Springer, Berlin, Heidelberg, 2010.
26.AnandaKumar, K., and Dr M. Punithavalli. "Efficient cancer classification using fast adaptive neuro-fuzzy inference system (FANFIS) based on statistical techniques." IJACSA) International Journal of Advanced Computer Science and Applications, Special Issue on Artificial Intelligence (2011): 132-137.