International Journal of Innovative Technology and Exploring Engineering (IJITEE) ISSN: 2278-3075, Volume-8, Issue-11, September 2019
Abstract: A novel anomaly detection-based NIDS is main demand in the computer networking security for discriminating malicious software attack at the early stage. It monitors and analyzes network traffics, checking abnormal behaviors or attack signatures. The detection rate or accuracy is the prerequisite in the network intrusion detection models,also, developing adaptive and flexible model is a critical challenge regarding to unseen attack. This search paper included the deep neural network (DNN) as anomaly detection model can be used within software defined networking (SDN). Dropout technique is used to prevent DNN model from overfitting. Six features have information about the flow were chosen from NSL-KDD dataset to fit and evaluate this model, these data features could be matched to packet-in message header values, also, these features enable the model to be a good generative, and well perform on intrusion recognition issue with a subset of the data. Cross entropy loss function with SoftMax output layer were used for getting the differences between the two different distribution and mapping to multiple class classification covered five class labels, one is normal and the others are attacks (Dos, R2L, U2L and Probe). Accuracy is a comparative metric utilized for assessing the model performance. The results are promising, where accuracy achieved 92.65%.
Keywords: Software Defined Networking, Deep Neural Network, Dropout, and NSL-KDD dataset
I. INTRODUCTION
T
he Internet and online applications are the important tools in our daily life today. They have been used as a primely component of education and business functionalities. Therefore, network security required to be carefully concerned to enforce secure information channels[1]. The network intrusion detection systems (NIDS) are important tools to the network system administrator for detecting a multiple security violation inside an organization network. The NIDS observes and analyzes each packet entering into or exiting from the network equipment’s of an organization and raises alarm if an intrusion is watched. There are two types of NIDS depending techniques to detect malicious software attacks. First one is signature-based NIDS (SNIDS), despite that method cannot recognize a novel attack, it still most popular method in IDS. Anomaly detection-based NIDS (ADNIDS) is the second one, compares the new data features using the model to the normalRevised Manuscript Received on September 05, 2019.
* Correspondence Author
Zaid Khalaf Hussein, Department of Computer Science, College of Science, AL-Nahrain University, Baghdad, IRAQ Email:
Ban N. Dhannoon, Department of Computer Science, College of Science, AL-Nahrain University, Baghdad, IRAQ Email:
user. ADNIDS technique installed with flow-based monitoring in IDSs. Flow-based monitoring depend on packet header information, in that case flow-based NIDSs handles with considerably lower amount of information.
Software defined networking (SDN) is the promised architecture that is dynamic manageable, it separates the network forwarding, and control panels, making the network control to be immediately programmable, and allowing the infrastructure underlying to be abstracted for network services and applications. Because of the logical centralization of controller in SDN and a global network overview, it can offer opportunity to the networking security. SDN also exposures to dangerous potential threats [2]. Many machine learning algorithms were utilized to develop anomaly detection-based NIDS, such as neural networks (NN), support vector machines (SVM), Naïve Bayesian (NB), random forests (RF), and self-organized maps (SOM). The ADNIDSs are developed as models to discriminate the normal traffic from the anomalous traffic[3]. Deep learning is evolving as a recent approach related to machine learning could be reaching in higher accuracy than traditional machine learning methods, it has the ability to use in detecting intrusions on computer systems as classifiers to develop adaptive NIDSs[4]. It has the ability to learn advanced level features on its own, and has flexibility with resource constrained networks such SDN context [5]. The artificial neural network with a huge number of parameters make very powerful computing machine learning method. However, overfitting is a main problem in such networks. solving the overfitting by resemble the predictions of multiple thinned neural nets at test time. Dropout technique has been addressed for this problem [6].
Precisely, the significant contributions for this search paper are:
• Presenting an IDS in the SDN paradigm using DNN model, dropout is technique was used to avoid the deep model from overfitting.
• The proposed DNN model yields a detection rate reached to 92.65%, and it has ability to classify into five class labels (normal, and four attack labels) by utilizing six number of features were selected from NSL_KDD dataset.
II. RELATEDWORK
various studies have been reported about SDN paradigm, and deep learning models for classification enhancement problems exactly in the intrusion detection. Most of them are listed below:
Deep Neural Network with Dropout for
Anomaly Detection in Software Defined
1) Reyadh Shaker Naoum1, et.al, “An Enhanced Resilient Backpropagation Artificial Neural Network for Intrusion Detection System”, 2012[7]. According this paper the authors designed intrusion detection system. Their proposed classifier system used an enhanced resilient backpropagation neural network. This approach has ability to classify in five classes with a reasonably good detection rate, achieved to 94.7%. The NSL KDD-99 dataset was used in their experiment.
2) Ni GAO, Ling GAO, et.al,” An Intrusion Detection Model Based on Deep Belief Networks” 2014[8]. This paper prepared on intrusion detection classifier utilizing deep belief networks (DBNs), this deep model is combination of multilayer unsupervised learning network called RBM, with backpropagation network. The KDD CUP 1999 dataset was used in the experiment, the model detection rate was 91.7%.
3) Quamar Niyaz, et.al” A Deep Learning Approach for Network Intrusion Detection System” 2016[3], Self-taught Learning (STL) approach was used as an algorithm in this paper, and NSL-KDD dataset was utilized for their experiments, also they used soft-max regression (SMR) for classification into five class labels, the classification accuracy achieved 79.10%.
4) Georgi A. Ajaeiya , et.al, “Flow-Based Intrusion Detection System for SDN "2017[9].Their proposed flow-based IDS technique used built-in periodically collected flows’ statistics from the OF switches to discriminate the network traffics. The system was transparent from the intruders when it runs over the control plane. Eight features were used read from packet-in message. The proposed system provided high detection rate accurate, F1score metric was used and achieved 0.98.
5) Tuan A Tang, et.al “Deep Recurrent Neural Network for Intrusion Detection in SDN-based Networks”2018[5]. The authors proposed Gated Recurrent Unit Recurrent Neural Network as approach for NIDS in SDN context. NSL-KDD dataset was utilized in their experiments. The accuracy metric achieved was 89% with only six features.
6) Majd Latah, and Levent Toker(Towards an Efficient Anomaly-Based Intrusion Detection for Software-Defined Networks)2018 [10]. The authors provided a comparative study to choose the effective ANIDS within context SDNs. Supervised machine learning methods were focused by authors such as: Extreme Learning Machine, Decision Trees, Naive Bayes, Linear Discriminant Analysis, Neural Networks, Support Vector Machines, Random Forest, BaggingTrees, RUSBoost, AdaBoost, LogitBoost and K Nearest-Neighbour. They used NSLKDD dataset for comparing the performance of each classifiers. PCA feature extraction method was used to enhance the accuracy to be 88.74% in comparing with utilizing the basic features used by the context SDN.
7) Pedro Manso, et.al” SDN-Based Intrusion Detection System for Early Detection and Mitigation of DDoS Attacks” 2019 [11]. The authors have displayed a security framework dependent on the SDN paradigm at the client side, they designed SDN detection system that responsively impairs the attacks at its origin. This system has ability to distinguish DDoS-based cyber-attack situations and limits them at their inception at the client side. Total the conducted attacks (DDoS attack, DDoS attack with IP spoofing, and a DDoS with IP packet size) utilized the UDP protocol in various
simple situations, this system had the option to identify every one with an average DDoS alleviation time of 3.07 s, an average RTT of 0.541 milliseconds.
III. DEEPNEURALNETWORK(DNN) Deep learning is a powerful accumulation of techniques for learning in neural nets. The neural network is a biologically inspired paradigm which it makes the computer to learn from observational data [12]. The idiom “deep” refers to many hidden layers within the artificial neural network, each hidden layer can be seen as an individual machine learning algorithm on its own. The simple structure of DNN includes input/visible layer, number of hidden layers, and the output layer. when preprocessed data are feed to the deep model, the output values are computed progressively through hidden layers along the network. During each layer, the input vector representing the output values of each unit in the previous layer combining with weight vector for each unit in the current layer to produce the weighted sum. Then, a nonlinear function, such as a Tanh, sigmoid, or ReLU is applied to compute the output values of that layer. The computation in each layer transforms the representations in the layer below into bit more abstract representations [13].
IV. DROPOUT
A dropout is the regularized technique use to cripple the deep neural network by removing hidden units stochastically during training case, in order to reduce the overfitting, that means we randomly omit hidden units with specific rate (p), where p can be determined in using a validation set or using a fixed rate such as 0.5. Dropout is applied to sample in a thinned network. The thinned network consists of all the units that survived from dropout. This means sampling from collection of different possible thinned networks (n is the number of units’ which can be dropped), all these thinned nets are share weights that means the number of thinned networks is greatly less than . This is same bagging can get, by taking the geometric mean of the predictions of these thinned nets. At test time, using the mean network that has all the outgoing weights halves[6]. This technique can be can defined as adding a special type of noise to the hidden units’ activations through the forward pass. The noise limits fraction of the neurons in current layer [14].
V. SOFTWAREDEFINEDNETWORKING(SDN)
International Journal of Innovative Technology and Exploring Engineering (IJITEE) ISSN: 2278-3075, Volume-8, Issue-11, September 2019
[image:3.595.371.479.48.193.2]Flow table within a switch includes flow information, this table comprises a header (opposed to incoming packet which is matched) to apply on matching packet. All packets were processed by the switch are compared to its flow table. If the matching with flow entry is found, the actions from that entry are occurred on that packet. If doesn’t, the packet will forward to the upper controller. The controller may decide to install flows in the switch at this point according to the packet’s header, also it has ability to forward through switches without setting the flows. This can give the flexibility in determining the exact packets on a specific set of activities were to be needed.
SDN controller was developed to manage OpenFlow protocol. The essential idea behind this controller is to centralize the observation of network states, choose the required policies depend on that state observation, then apply these policies by installing flow information in the switches[17]. Although, SDN has ability of logical centralized control, and dynamic updating of forwarding rule, it has ability to react to network attacks.
VI. NSL-KDDDATASET
This dataset is prepared to avoid the inherent problems with KDD Cup 99 dataset. Although, this dataset is old and not ideal representative of actual real networks, it is remained a good reference for NIDS classifiers, it used to evaluate the performance of NIDS by researchers, this dataset contains 125,973 network traffic samples stored in ‘KDD Train+.csv’ file [18]. Each traffic sample has 41 data features. NSL is prepared using the network traffic captured by 1998 DARPA IDS evaluation program, the traffic includes normal and attack traffics (probing, denial of service, user-to-root, and root-to-local).
[image:3.595.298.564.294.677.2]VII. THEPROPOSEDSULUTIONFORIDS The deep neural network was constructed, consisted of an input layer, two hidden layers and an output layer. The input vector values are six features values which they are selected manually from the NSL-KDD dataset for fitting the model and evaluating its performance[2]. These six features and their details are shown in table (I). These six features have information about the flow, and they could be checked to packet-in message header values.
Table-I: The detail of the six traffic features
Features Name
Descriptio n
Duration
Number of seconds of the connection
Protocol-typ e
Protocol types (tcp, udp), etc.
Src-bytes
Number of bytes(data) from source to destination
Dst-bytes
Number of data bytes (destination to source)
Count
Number of connections within the same host as the same connection during the past two seconds
Srv-count
Number of connections to the current service
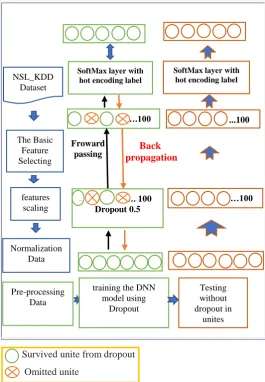
The dataset is categorized into five classes according to their characteristics, one is normal and the four others are attacks. The hidden layers contain 100 and 100 neurons respectively. The learning rate was 0.1, ReLU activation function units are used in first hidden layer, where, sigmoid activation function units are utilized in second hidden layer. SoftMax function layer used for mapped to five output nodes. Figure (1) is showing the general block diagram of the proposed system.
Survived unite from dropout
Omitted unite
Fig 1. General block diagram to the proposed system
NSL_KDD Dataset
The Basic Feature Selecting
features scaling
Pre-processing Data
…. 100
Dropout 0.5
z z z z z z z z
…….100 ………100
SoftMax layer with hot encoding label
Back propagation
Froward passing
…100 ...100
SoftMax layer with hot encoding label
…
training the DNN model using
Dropout
Testing without dropout in
unites Normalization
[image:3.595.73.229.587.789.2]Bias
weight VIII. THEPROPOSEDMODELDESCRIPTION
After data Preprocessing (features selection, features scaling and normalization), DNN model consists of two hidden layers. denotes the input vector to second hidden layer, denotes the output vector consequent from first hidden layer. = x is the input. and are the biases and weights at first hidden layer. P is dropout rate and it is =0.5
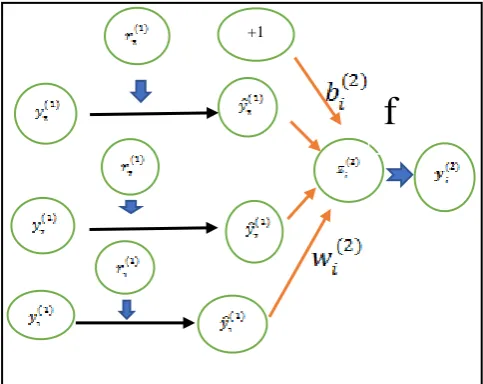
A.The Foreword-Pass
(1)
To more clarify see figure (2).
Here * denotes here element-wise multiplication, is the independent Bernoulli random variables vector, each one has probability 1-p to being 1, the vector r then multiplied as elementwise with the outputs of that layer , to compute the thinned outputs . Then these thinned outputs are
utilized as input to the next layer. The factor of (p is the
dropout rate) used during training to guarantee at test time, when all units are used, the correct total input reaches each layer. f is the activation function, b and w, are the biases and weights, respectively.
Fig 2. Feed-forward with dropout
B
.
Cross-Entropy Function and SoftMax Output Layer:Cross entropy was utilized as loss function in the proposed deep model. This function is commonly used to quantify the difference between two probability distributions, true
distribution (one that the DNN algorithm is trying to match)
and predict distribution. as followed:
(2) p is the target distribution, and q is the predicted distribution. SoftMax can be define as type of output layer for DNNs, this layer must map the neurons to output nodes (here five classes), so that SoftMax activation function is used.
(3)
refers to neuron activation function in the last layer. refers to input value to last layer. See figure (3).
It begins in the same way as sigmoid layer input, but, sigmoid function doesn’t apply. Instead, SoftMax function is applied to the , and map to output nodes (to five nodes).
[image:4.595.49.291.385.577.2]Fig 3. SoftMax output layer
Dropout doesn’t apply at test time. And the network forward will be:
(4)
.
During test time, geometric mean network is used, total the hidden units are active but their outgoing weights were halved [19][6]. This is very analogous performance to averaging of large number of dropout-ed network.
The network at test phase is exactly as taking the geometric mean of the probability distributions over labels predicted by 2^N possible thinned networks (where N is the number of the unites which can be dropped). These k thinned networks do not all make same predictions, and mean network prediction is guaranteed to be a higher log probability for the correct answer than the log probabilities assigned by the individual thinned networks.
each thinned network estimator defined as: (5)
The geometric mean of all predictions of thinned nets, that each thinned network estimator can be computed as in equation (5) above:
(6) Where k indicates to number of all thinned nets caused by dropout during training case
.
IX. EXPERIMENTALRESULTS
The experiments have been applied using NSL-KDD dataset in fit and test DNN model by two estimation methods, k-fold cross validation, and holdout.
+1
f
1
1
International Journal of Innovative Technology and Exploring Engineering (IJITEE) ISSN: 2278-3075, Volume-8, Issue-11, September 2019
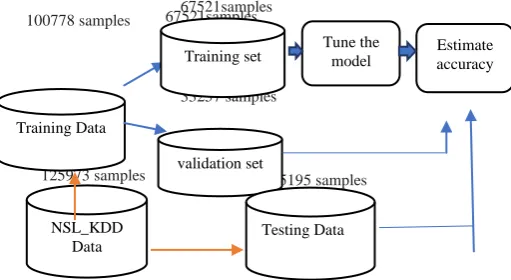
67521samples 100778 samples
33257 samples
125973 samples 25195 samples
67521samples
A.
Results with K-fold Cross Validation Method [image:5.595.299.555.68.208.2]K-fold cross validation (CV) is one of estimating method used to evaluate the classifiers performance on unseen data. This method systematically creates and evaluates multiple classifiers on multiple data subsets. As shown in table (II).
Table-II. Five folds cross validation
[image:5.595.41.282.160.302.2]In this experiment, simple DNN was used, consisted from two hidden layer, first hidden layer were 100 units of ELU activation function, second hidden layer were 100 units of sigmoid unites. dropout rate was 0.5, and learning rate was 0.13, number of epochs was 150. NSL_KDD dataset was used, contains on (125973 traffic samples) partitioned by 5-fold cross validation in to 100780 samples to train, and 25193 samples for testing as (80% training data, and 20% testing data). K-fold cross validation method was utilized to select the best model with the best number of hidden unites, depending on accuracy which it was obtained. The results are shown in table (III).
Table-III: Experimental results in 5-folds cross validation
From these results, we can pick the best one, such third
result when accuracy achieved to 86.5%, and apply the
selected model with its specification in holdout method.
B
.
Results with Holdout MethodNSL_KDD dataset has 125,973 samples stored in” KDDTrain+.csv” file. KDDTrain+ dataset has been partitioned into 100778 samples for training and the remains 25192 to test (training rate=80%, and testing rate=20%). See figure (4).
Fig 4. NSL_KDD partitioning to training, and testing datasets in holdout
Then training dataset has been partitioned into 67521 samples for training and the remains 33257 for validation (training rate=67%, and validation rate=33%). Experiments have been done in three stages, with different number of iterations. The
first stage is used to determine the best activation function
[image:5.595.306.554.416.510.2]were used to hidden units in each layer, by replacing the activation function of hidden layers among each ReLU, ElU, Sigmoid, and Tanh. As shown in table (IV). In current experiment stage. Dropout rate is 0.5, learning rate 0.13, first hidden layer were 100 units, second hidden layer were 100 units, number of epochs was 150.
Table-IV: The results on different activation function types
From the results in table (IV), we can choose the second result that achieved a highest accuracy (92.42%). In the second stage of this experiment, the selected result from last stage of the experiment was used, and trying to determine the adequate learning rate. Table (V) shows the results. Here, dropout rate was 0.5, and the number of epochs was 300.
Table-V: Experiments results on different learning rate
# Learning
rate
Training Acc%
Testing Acc%
1
0.01
91.34
91.11
2
0.1
92.7
92.65
3
0.13
92.67
92.62
4
0.15
92.58
92.56
Testing data
Training dataset
Training dataset
Testing data
Training dataset
Training dataset Testing data
Training dataset
Training dataset Testing data
Training dataset
Training dataset Testing data
# # units in each layer
Model acc in class1 %
Model acc in class2 %
Model acc in class3 %
Model acc in class4 %
Model acc in class5 %
Avg Acc %
1 30/30 85.68 86.15 85.62 81.55 84.91 84.78
2 60/60 85.68 85.77 86.38 85.63 84.63 85.62
3 100/100 86.02 86.02 88.32 86.08 86.04 86.5
4 200/200 86.48 83.63 85.57 85.81 83.63 85.02
# Unit types in each hidden layer
Training Acc%
Testing acc %
1 ElU/ sigmoid 92.18 91.83
2 ReLU/sigmoid 92.51 92.42
3 ReLU/ tanh 91.32 91.31
4 ElU/ tanh 90.76 90.72
Training Data
Training set
validation set
Tune the model
Estimate accuracy
NSL_KDD Data
[image:5.595.42.290.488.605.2]From above results, the learning rate is 0.1, and it was chosen, the model’s accuracy achieved to (92.65%). The final stage used to show the dropout effect; Dropout is the regularization method utilized to avoid overfitting by controlling the complexity of the model which is used. Since the network can’t use its whole potential for each training sample. In some way it combines the advantage of a large NN without the risk of overfitting because the model is too expressive. Table (VI) showing the dropout effect on the DNN model performance.
Table-VI: Experiment result on dropout effect
Finally, the proposed model setting, consisted of (6,100,100,5) nodes respectively, first hidden layer consists of 100 units of ReLU activation function, second one is 100 unites of sigmoid activation function, the learning rate is 0.1, and dropout rate is 0.5. the accuracy was 92.65%.
X. PERFORMANCEEVALUATION
In general, accuracy, F-measure, recall, and precision metrics are used to assess the NIDS performance. A NIDS desired high accuracy. The confusion matrix used to count the (TP, TN, FP, and FN) parameters. Where TP is true positive, the number of attack records correctly classified. TN is true negative, number of normal records correctly classified. FP is false positive, number of normal records incorrectly classified, and the number of attack records incorrectly classified is false negative (FN).
A. Confusion Matrix
Confusion matrix shows the incorrect and correct predictions, caused by the recognition model compared with actual outcomes. The matrix M×M, here M is number of classes. We can calculate the accuracy or any other model performance metric. Accuracy is summation of all the correct classification divided on the total number of classifications.
Accuracy= (7)
Back to our proposed model achieved accuracy= (92.65%). Table (VII) showing the confusion matrix.
Table-VII. The Confusion Matrix
DoS U2R R2L Probe Normal
DoS 8602 0 0 40 497
U2R 1 0 0 0 7
R2L 0 0 0 0 199
Probe 190 0 0 1337 816
Normal 41 0 0 62 13403
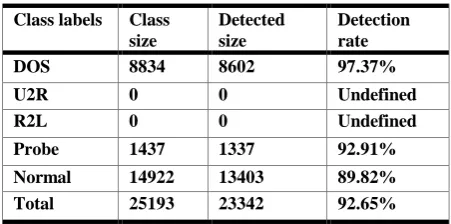
[image:6.595.329.555.63.175.2]The proposed DNN can classify the testing labeled dataset. As shown in table (VIII):
Table-VIII. Labeled Testing dataset Results
[image:6.595.301.554.237.366.2]To calculate, F-measure, recall, and precision metrics, the parameters such, TP, FP, and FN must be computed first. Confusion matrix was used for this purpose. As shown in table (IX).
Table-IX. F-measure, recall, and precision values Class
labels
TP FP FN Precision Recall F1 score
DoS 8602 232 537 0.9737378 0.9412 4
0.9572135
U2R 0 0 8 Undefine
d
0 Undefine d R2L 0 0 199 Undefine
d
0 Undefine d Probe 1337 102 100
6
0.9291174 0.5706 3
0.7070333
Normal 1340 3
151 9
103 0.8982039 0.9923 7
0.9429435
Figure (5) shows the history chart about accuracy of the model implementation during training phase
.
Fig. 5. The classifier accuracy chart during 300 epochs
B. The Model Loss
Log Loss is a comparative metric used to check the misclassification cost damaging for multiple attacks per sample calculated. During the experiment, N are samples belonging to M classes, then the Log Loss can be calculated as this formula:
(8) where denotes whether sample i belongs to target j or not,
refers to probability of sample i belonging to target j.
The proposed model loss was recorded in history loss chart, during the training phase, it achieved 20.89% as shown in figure (6).
Epoch Training
Acc%
Test Acc%
Dropout rate
200 92.43 91.23 None
Class labels Class
size
Detected size
Detection rate
DOS 8834 8602 97.37%
U2R 0 0 Undefined
R2L 0 0 Undefined
Probe 1437 1337 92.91%
Normal 14922 13403 89.82%
[image:6.595.314.542.409.542.2]International Journal of Innovative Technology and Exploring Engineering (IJITEE) ISSN: 2278-3075, Volume-8, Issue-11, September 2019
Fig 6. The classifier Loss chart during 300 epochs
XI. CONCLUSION
Deep neural network (DNN)
method was provide
d to develop anomaly network intrusion detection systemfor
SDNs
. Dropout technique allowed the DNN model to learn more robust attributes that are useful in conjunction with many different random subsets of the other neurons. It required nearly doubles number of epochs for converging. The proposed model ismore computationally effective
for real time, because of the
minimum number of featuresit uses, and the experimental results showed that the proposed model can be implemented efficiently within the SDN context with total detection rate as 92.65%.
REFERNCES
1. Salama, M.A., et al., Hybrid intelligent intrusion detection scheme, in Soft computing in industrial applications. 2011, Springer. p. 293-303. 2. Tang, T.A., et al. Deep learning approach for network intrusion
detection in software defined networking. in Wireless Networks and Mobile Communications (WINCOM), 2016 International Conference on. 2016. IEEE.
3. Javaid, A., et al. A deep learning approach for network intrusion detection system. in Proceedings of the 9th EAI International Conference on Bio-inspired Information and Communications Technologies (formerly BIONETICS). 2016. ICST (Institute for Computer Sciences, Social-Informatics and ….
4. Debar, H., M. Becker, and D. Siboni. A neural network component for an intrusion detection system. in IEEE symposium on security and privacy. 1992.
5. Tang, T.A., et al. Deep recurrent neural network for intrusion detection in sdn-based networks. in 2018 4th IEEE Conference on Network Softwarization and Workshops (NetSoft). 2018. IEEE.
6. Srivastava, N., et al., Dropout: a simple way to prevent neural networks from overfitting. The journal of machine learning research, 2014. 15(1): p. 1929-1958.
7. Naoum, R.S., N.A. Abid, and Z.N. Al-Sultani, An enhanced resilient backpropagation artificial neural network for intrusion detection system. International Journal of Computer Science and Network Security (IJCSNS), 2012. 12(3): p. 11.
8. Gao, N., et al. An intrusion detection model based on deep belief networks. in Advanced Cloud and Big Data (CBD), 2014 Second International Conference on. 2014. IEEE.
9. Ajaeiya, G.A., et al. Flow-based intrusion detection system for sdn. in 2017 IEEE Symposium on Computers and Communications (ISCC). 2017. IEEE.
10. Latah, M. and L. Toker, Towards an efficient anomaly-based intrusion detection for software-defined networks. IET Networks, 2018. 7(6): p. 453-459.
11. Manso, P., J. Moura, and C. Serrão, SDN-Based Intrusion Detection System for Early Detection and Mitigation of DDoS Attacks. Information, 2019. 10(3): p. 106.
12. Buduma, N. and N. Locascio, Fundamentals of deep learning: Designing next-generation machine intelligence algorithms. 2017: " O'Reilly Media, Inc.".
13. Min, S., B. Lee, and S. Yoon, Deep learning in bioinformatics. Briefings in bioinformatics, 2017. 18(5): p. 851-869.
14. Gal, Y. and Z. Ghahramani. Dropout as a Bayesian approximation: Representing model uncertainty in deep learning. in international conference on machine learning. 2016.
15. Jadidi, Z., et al. Flow-based anomaly detection using neural network optimized with GSA algorithm. in Distributed computing systems workshops (ICDCSW), 2013 IEEE 33rd international conference on. 2013. IEEE.
16. McKeown, N., et al., OpenFlow: enabling innovation in campus networks. ACM SIGCOMM Computer Communication Review, 2008. 38(2): p. 69-74.
17. Mehdi, S.A., J. Khalid, and S.A. Khayam. Revisiting traffic anomaly detection using software defined networking. in International workshop on recent advances in intrusion detection. 2011. Springer.
18. Tavallaee, M., et al. A detailed analysis of the KDD CUP 99 data set. in Computational Intelligence for Security and Defense Applications, 2009. CISDA 2009. IEEE Symposium on. 2009. IEEE.
19. Dahl, G.E., T.N. Sainath, and G.E. Hinton. Improving deep neural networks for LVCSR using rectified linear units and dropout. in Acoustics, Speech and Signal Processing (ICASSP), 2013 IEEE International Conference on. 2013. IEEE.
AUTHORS PROFILE
Zaid Khalaf Hussein, M.Sc. in Computer Science, Department of Computer Science, College of Science, Al-Nahrain University.