Virtual Environments
Samuel Roger Aldiss Taylor
A thesis subm itted for the degree of
Doctor of Philosophy at
The Australian National University
A PhD is a long road to tread, and I owe a great debt of thanks to all those who have helped me over the last four years. I have been privileged to study at the Australian National University, an institution which continues to inspire generations of young Australians. Within the Department of Computer Science I must thank my super visory panel and in particular Dr Chris Johnson, who always made time for me and always challenged me to think in new directions.
Special mention has to go to the Cooperative Research Centre for Advanced Com putational Systems (ACSys). ACSys was a remarkable organisation: it gave me the opportunity to work with great people on fascinating problems using state-of-the- art technology, and ultimately to develop this dissertation. Beyond that I made some wonderful friends through ACSys: John Zigman, Matthew Wilson, Markus Buch horn, Linda Wallace, Raj Nagappan, Nick Craswell, Dave Walsh, Hugh Fisher, Zhen He, Luke Kirby, Alonso Marquez, Steve Blackburn and Jan Bitmead.
Away from work there are just as many kind people who helped and encouraged me. I have been lucky enough to be part of two wonderful caring families, the Taylors and the Jensens, both of whom offered their unconditional love and support. My mates helped me maintain my sense of perspective, each in their own unique way. Angus O’Shea introduced me to the world of Belgian beers, John Zigman got me riding and forced me in to the gym, Tim Edwards showed me just how much you can achieve when you really want to, and Gavin Longhurst fed me a steady diet of mad ideas and exquisite language. Then there were the lunchtime coffee drinkers - Gavin Mercer, Andrew Slater and Matt Taylor - who prove that nothing beats a good conversation and a strong espresso sat outside in the Canberra sunshine.
Finally Richard Walker’s refined aesthetic sense, remarkable knowledge of BTgX and very great patience made it possible for me to typeset this thesis.
The goal of this thesis is to enable geospatial images from earth observation satel lites to be visualised in a Collaborative Virtual Environment (CVE). Geospatial im ages are a valuable commodity and are used in fields as diverse as meteorology, de fence, environmental impact analysis and urban planning. They are also very large, and collections of images are typically kept on slow tertiary storage devices. Collab orative Virtual Environments are sophisticated visualisation systems with the added attraction of human interaction. They are also computationally demanding applica tions which must respond to user input in real time. So, while there is great value in combining CVEs and geospatial imagery, a range of performance and management problems must first be considered.
The general challenge is to retrieve imagery from storage archives, transform it through various image processing operations, and disseminate it to visualisation clients with a minimum of latency. This challenge implies four fundamental require ments: for responsive client access to imagery, for high rates of throughput when dis seminating imagery, for sharing collaborative data between clients, and for a struc tured approach to application management.
The major contribution of this thesis is to report a software architecture that addresses each of these requirements. Known as the Responsive Architecture for Pipelined Imagery Dissemination (Rapid), it consists of three main components:
1. A general-purpose dissemination pipeline is used to access and process im agery at high rates of throughput.
2. Large, parallel caches are deployed close to visualisation clients to decouple them from the pipeline and provide responsive access to processed imagery. These caches are also organised to route collaborative data between sites. 3. An application management framework is defined to allow dissemination pipe
lines to be created within a computational grid.
The Rapid architecture has been validated through the development of numerous working systems. Three case studies are presented, which allow general architec tural principles to be distilled from practical work.
Acknowledgements vii
Abstract ix
1 Introduction 1
1.1 Data Domain: Geospatial I m a g e r y ... 1
1.2 Visualisation Domain: Collaborative V E ... 2
1.3 The Problem Framed as Four Functional R equirem ents... 5
1.3.1 Responsiveness... 5
1.3.2 T h ro u g h p u t... 5
1.3.3 Collaborative Data Sharing ... 6
1.3.4 Application M a n a g e m e n t... 6
1.4 Scope and Suitability of the P ro b le m ... 7
1.5 A Solution ... 8
1.6 Approach and M ethodology... 8
1.7 O rganisation... 9
2 Formative Concepts 11 2.1 Managing and Using Geospatial Imagery... 11
2.1.1 Earth Observation Systems and D a ta ... 11
2.1.2 Storage and Repositories... 12
2.1.3 Image Processing and Dissemination Pipelines... 13
2.1.4 Tiling and Resolution... 15
2.1.5 Map Projections and Coordinate S y stem s... 17
2.2 Challenges with Collaborative Virtual Environm ents... 18
2.2.1 Data Distribution T rad eo ffs...18
2.2.1.1 Model/View D istinction... 19
2.2.1.2 Data Size... 20
2.2.1.3 Access and Communications P attern s... 20
2.2.1.4 Computational C o s t ... 21
2.2.1.5 Time Sensitivity and B u fferin g ...21
2.2.1.6 Scalability... 22
2.2.2 Object Position Estim ation... 22
2.2.3 Perceptual Consistency and Collaborative Data S haring... 23
2.2.4 Terrain Rendering... 24
2.3 Distributed Com puting... 27
2.3.2 Caching ... 28
2.3.3 Application Management, Metacomputing and G r id s ... 29
2.4 Sum m ary...31
3 Techniques and Approach 33 3.1 Runtime T e c h n iq u e s...33
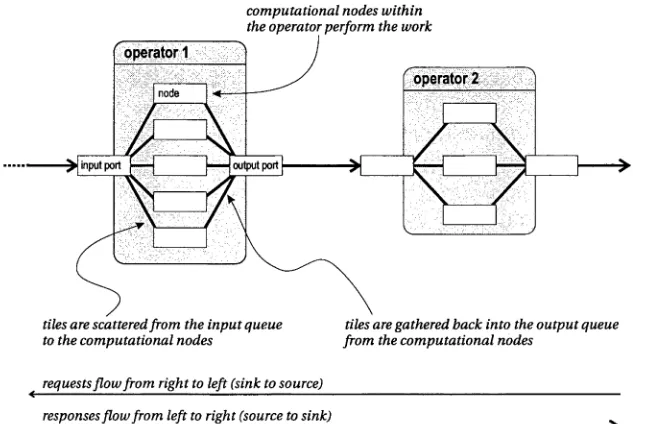
3.1.1 Pipelined Imagery Dissemination...33
3.1.2 Pipeline Scheduling... 38
3.1.3 Parallel Caches at Visualisation S ite s ... 40
3.1.4 Group Communications for Collaborative Data S haring... 42
3.1.5 Inter-site Tile Sharing... 43
3.1.6 Parallel Streaming in the Dissemination P ipeline...43
3.1.7 Approximating Tiles ... 47
3.2 Grid-based Application M anagem ent... 48
3.3 Bringing the Pieces Together... 52
3.3.1 Illustrative Example... 53
3.3.2 Negotiating a S erv ice... 53
3.3.3 Initialisation of S e rv ic e s...56
3.3.4 Provision of S e rv ic e s... 57
3.3.5 Disposal of Services... 59
3.4 C av eats... 59
3.5 Sum m ary... 60
4 Rapid: Responsive Architecture for Pipelined Imagery Dissemination 63 4.1 Documenting An Architecture...63
4.1.1 UML and P erspectives...65
4.1.2 Implementation P ro files...65
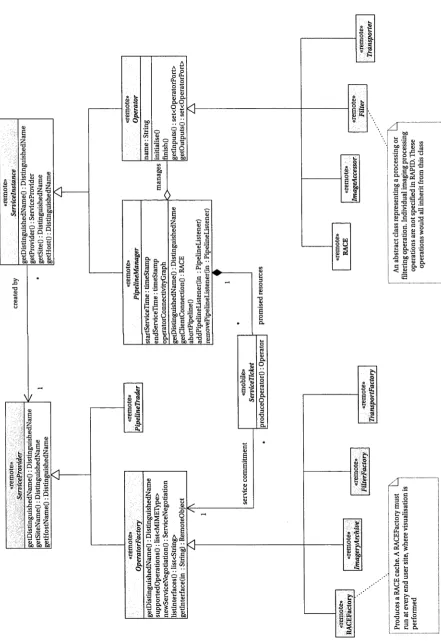
4.1.3 The UML Object Model and New Stereotypes... 66
4.2 Service Negotiation and Application M anagem ent... 67
4.2.1 Actors and the Pipeline Life-cycle...68
4.2.2 Negotiating Access to a R eso u rce...70
4.2.3 Managing Access to Special Purpose N etw orks...73
4.2.4 A Schema for Resource Discovery...73
4.3 Creating the Pipeline During Service In itialisatio n... 76
4.3.1 The Structure of a New O p e r a to r ...77
4.3.2 Connecting Ports and Creating Links... 79
4.4 Provision of Service with a Dissemination P ip elin e... 81
4.4.1 Basic Network C o m m u n icatio n s...81
4.4.2 Rapport: The Rapid Operator P ro to c o l...84
4.4.3 Port Buffers and Approximating R e su lts...87
4.4.4 Handling and Processing Tile Requests... 88
4.4.5 Supporting Parallelism in the P ip e lin e ... 91
4.4.5.1 Intra-operator parallelism ... 92
4.4.5.3 Parallel Streaming Through Upstream Scattering . . . 94
4.5 Race: The Rapid C ache... 95
4.5.1 Structure of the Ra c e... 95
4.5.2 Nodes and Ports in a Ra c e... 98
4.5.3 Handling R e q u e s ts ... 99
4.5.4 Scheduling Speculative R e q u ests...100
4.5.5 Inter-site Bus and Collaborative Data Sharing... 101
4.6 Minor Details and Points of Clarification...102
4.6.1 How Clients Connect to a P ip e lin e ... 102
4.6.2 Termination of S erv ice...102
4.6.3 Tiling and Level of Detail M echanism s... 103
4.6.4 Observability ...103
4.7 Sum m ary... 103
5 Comet: a Study in Client Responsiveness 105 5.1 Overview of C o m e t ... 106
5.2 Requirements of C om et...106
5.3 Architecture of C om et...108
5.3.1 Data Distribution and the Server C luster...108
5.3.2 The Rendering P ro c ess... 110
5.3.3 Client Caching Strategies...I l l 5.3.4 Multithreading and Quasi-asynchronous Data D elivery... I l l 5.4 Analysis of C o m e t... 112
5.4.1 Test Environment and M etrics... 112
5.4.2 Caching ... 113
5.4.3 Tile Sizes for Rendering and Distribution ...115
5.4.4 Multithreading and Asynchronous C om m unication...117
5.4.5 Level of Detail and Cache U tilisation... 119
5.4.6 Network Bandwidth U sage... 119
5.5 Sum m ary... 121
6 Short Studies in Dissemination and Throughput 123 6.1 OATS: Study of an Imagery Archive B row ser... 124
6.1.1 Overview and Requirements... 124
6.1.2 Architecture and Im plementation...126
6.1.3 Analysis ... 128
6.1.4 Summary of OATS... 128
6.2 IMAD: Pipelined Imagery Dissemination...128
6.2.1 Overview and Requirements... 129
6.2.2 Experimental A n a ly sis...130
6.2.2.1 Communications T h ro u g h p u t...131
6.2.2.2 Efficiency of Loop-back Communications ...133
6.2.3 Architecture and Relationship to Rapid ...133
6.2.5 Subsequent W o rk ... 138
6.2.6 Summary of IM A D ...139
6.3 CROP: Optimising T h ro u g h p u t... 139
6.3.1 Overview and Requirements...140
6.3.2 A rchitecture...141
6.3.3 Analysis ...142
6.3.4 Summary of CROP ...143
6.4 Sum m ary... 143
7 vGrid: a Study in Application Management 145 7.1 Overview of the v G rid ... 145
7.1.1 M otivation...145
7.1.2 Requirements of Collaborative Virtual Environments ...147
7.1.3 G o a ls ... 147
7.2 Relationship to Ra p i d... 148
7.3 A rch itectu re... 148
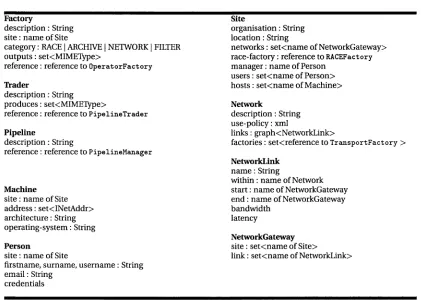
7.3.1 Resource S c h e m a ... 149
7.3.2 Factories and T raders... 151
7.3.3 Im plem entation... 153
7.4 Analysis of vG rid...155
7.4.1 Success of vG rid... 155
7.4.2 Virtual World M a n a g e m e n t...155
7.4.3 Static and dynamic configuration... 156
7.4.4 Schema Encoding...157
7.4.5 Interoperability... 157
7.5 Sum m ary...158
8 Conclusions and Future Work 161 8.1 Sum m ary... 161
8.2 Future Directions for Research... 162
8.2.1 A Full Implementation of Ra p i d... 162
8.2.2 Evaluating Scheduling and Prefetch Policies... 163
8.2.3 High Level User Interaction and C ollaboration... 163
8.2.4 Other I s s u e s ... 163
8.3 C o n clu sio n s... 164
Appendices 165 A Rapid Class Reference 167 A.l Service Negotiation Classes ... 167
A.2 Operator and Pipeline C lasses... 171
A.3 Rapport Classes... 178
B UML Notation and Conventions 189
B.l Class Diagrams ... 189 B.2 State Diagrams... 190 B.3 Sequence D iagram s...190
Bibliography 191
Introduction
This thesis is about using Collaborative Virtual Environments (CVEs) to explore im agery from earth observation satellites. CVEs are extremely sophisticated visualisa tion systems. They completely immerse the user in a virtual space where the periph eral vision is saturated and the perception of depth is accurate. Not only are they compelling display devices, they have the added dimension of human interaction and so are a powerful forum for teams of experts to visualise and solve problems. Geospatial imagery is among the richest and most valuable visual data, and often requires careful analysis by experts in multiple domains. So there is great potential to use Virtual Environments for collaborative visualisation of geospatial imagery.
In a perfect world we would be able to access and interact with geospatial im agery as easily as we access a remote website or interact with a printer on a local area network. Before this potential can be realised, however, there are significant performance and resource management problems which must be solved. Geospa tial images are large and difficult to manage and distribute. They also require consid erable processing before they can be visualised. CVEs are demanding applications: real-time interaction and high performance terrain rendering are both very sensi tive to latency. The challenge for this thesis is to efficiently stream data out of image archives and allow visualisation clients to access it with minimal latency.
1.1 Data Domain: Geospatial Imagery
Geospatial images are an extremely valuable commodity. Around the world there is great interest in earth observation data [45]. All major space organisations include an earth observation group, as do most defence forces and an increasing number of commercial enterprises. Geospatial imagery is valuable because it can be applied to many different fields, including:
• meteorology and weather prediction;
• military command, control, communications and intelligence (C3I) services; • scientific assessment of environmental impact and climate change;
• town planning and monitoring the effects of urbanisation;
• insurance assessments for underwriting major construction projects.
Estimates vary widely but by 2005 the commercial market for geospatial imagery may be worth as much as $US2.5 billion1. The value to the scientific and defence sectors is immeasurable.
Just as there are many applications of geospatial imagery, so too there are many sources of images. The first civilian remote-sensing satellite, Landsat-1, was launched in 1972. Today there are a great number of different earth observation satellites in orbit around the planet, each providing unique and valuable data. Satellites vary in terms of the number of sensors they carry, the spatial resolution and spectral cover age of each sensor and their orbital characteristics. For example, the French SPOT satellites sit in a low altitude polar orbit and provide results from four spectral chan nels at a resolution of 10-15 metres over an area 60 kilometres wide. By contrast the Japanese GMS weather satellites sit in a high altitude geo-stationary orbit and provide images which cover a significant portion of the southern hemisphere, but at a resolution of no better than one kilometre. Obviously these differences have a profound affect on the images produced by each satellite. Figures 1.1 and 1.2 show examples of imagery from several different systems.
The diversity of data presents many challenges to those who use geospatial im agery. Perhaps the greatest challenge is due to the sheer volume of data. Individual geospatial images are very large; time series of images can be massive. This means that geospatial imagery is usually held in a mass-storage facility, such as a tape silo. Such devices are optimised to stream out data at high bandwidth, but incur signif icant initial latency. Other challenges relate to the processing and dissemination of images. Most geospatial data is archived in raw form or with minimal loss-less filter ing. Consequently it requires considerable processing before it is fit for direct visu alisation. Efficiently processing and streaming large images to visualisation clients is a challenging problem.
1.2 Visualisation Domain: Collaborative VE
A Collaborative Virtual Environment (CVE) is an artificial space in which geograph ically separated people can meet and interact. CVEs have the potential to revolu tionise the way we communicate and work because it is possible to see and do things in a computer-generated space that are not practical or possible in the real world. Constraints such as distance, scale, visibility, occlusion, mobility and cost need not apply in a virtual environment. This freedom of interaction has been essential to the success of CVEs in many different domains, including:
Scientific Visualisation - where multiple participants cooperatively explore scien tific data sets, or interactively steer a simulation running on a remote High Per formance Computing (HPC) resource [108].
Figure 1.1: A composite, false colour image of our planet, produced by NASA.
(i) Landsat MSS (ii) SPOT (iii) IRS-1C
[image:14.526.12.513.20.646.2]Military Training and Simulation - the armed forces have a long history of using computer simulations to train personnel. They have well defined protocols and architectures for building scalable simulations and virtual battlefields, in cluding the Distributed Interactive Simulation (DIS) protocol [68] and the Higher Level Architecture (HLA) [25]
Cooperative Design - designers and engineers can work in a shared space to build virtual prototypes rather than physical models. VE-based CAD tools have been developed by a number of large vehicle manufacturers, including General Mo tors and Caterpillar [83]
Education - a Virtual Environment can be an exciting and compelling setting for many education and learning applications [74]. For example, the Narrative Immersive Collaborative Environment (NICE) is a virtual garden, where young children can interact and play with a range of objects and plants, and explore a number of learning themes [119]
Medical Training - a particularly specialised and successful use of VEs for educa tional purposes is in the area of medicine. Collaborative VEs can be used to provide general practitioners with access to specialists [114]. Rich hapto-visual environments are also being developed to allow trainee surgeons to develop their skills.
Entertainment - in financial terms video games have now surpassed mainstream cinema and recorded music as the most valuable global media [69]. Multi player and on-line video games are a particularly high growth genre. They are a unique category of Collaborative Virtual Environment, requiring both a com plex set of interactions and a high degree of scalability. Massively multi-player games such as “Ultima Online” and “Everquest” commonly support thousands of players interacting in a shared virtual world [29]. Future games have even more ambitious scalability goals [22].
Socialisation - a Virtual Environment can also be an appropriate neutral venue for people to meet and socialise. Multi-user VRML [153,154] worlds are popular as virtual chat forums and for other types of casual, non-competitive interac tion. Users of such worlds often go to a considerable effort to customise their appearance and environment and generally build a rich virtual persona.
1.3 The Problem Framed as Four Functional Requirements
The ultimate goal of this thesis is to enable collaborative visualisation of geospatial imagery within Virtual Environments. This is a general goal which encompasses a number of more specific, research issues. Consequently we will frame the problem in terms of four basic, functional requirements:
1. To provide visualisation clients (CVEs) with low latency access to very large geospatial datasets. This we will characterise as a requirement for responsive ness.
2. To process and disseminate imagery in a way that makes efficient use of high- bandwidth networks and high performance computing resources. This is a requirement to optimise the rate of throughput.
3. To share data required for user interaction and a shared sense of presence. This implies a requirement for collaborative data sharing.
4. To support management of resources and configuration of applications in a heterogeneous distributed environment. This is a requirement for application management.
These four requirements define the scope of this thesis and the solutions it develops.
1.3.1 Responsiveness
Response rate is all important to a Collaborative Virtual Environment. To achieve a sense of real-time interaction visual, auditory and haptic2 rendering must be per formed within stringent time constraints [109]. Visual rendering typically occurs 30 - 60 times per second and, although it can be pipelined to some extent, a lag of even a few frames becomes noticeable and distracting. Bi-directional audio channels are more tolerant, but typically cannot work with latencies greater than 100 - 200 mil liseconds. Haptic rendering is most demanding: updates are performed 500 - 1000 times per second affording a latency of one or two milliseconds at most. It is crucial to visualisation to have timely, low latency access to data. In other words, respon siveness is a fundamental requirement.
1.3.2 Throughput
Low latency data access is not the only performance requirement. The size and pro cessing requirements of geospatial images mean they must be streamed efficiently. Tertiary storage facilities can migrate data off store at very high rates: often faster than a commodity network can handle. This means that high bandwidth networks are required to disseminate images efficiently. Many image processing operations are highly parallel and perform very well on high-performance computing facilities. Consequently it is important to be able to access, transfer and process images at very high rates of throughput.
1.3.3 Collaborative Data Sharing
Why is the collaborative aspect important? There are a many reasons why group ex ploration enhances the way we use geospatial imagery Earth observation images provide a complex picture of our world. Interpreting them can be difficult and time consuming, and usually requires specialist knowledge. In this context there is con siderable value in having multiple analysts develop a collective interpretation of an image. Furthermore, when images are being used as part of a decision making pro cess, it is clearly preferable if all stake-holders can view the images at the same time, sharing observations and forming a consensus. For example, in a military context it may be valuable for officers in the field and trained image analysts to participate when command staff use reconnaissance data to make tactical decisions. There is also an economic argument in favour of collaboration. Access and processing large datasets incurs considerable costs in terms of network and computational resource consumption. These costs can be shared when more than one user views a dataset. Finally there are technical arguments for considering collaboration in this disserta tion. Firstly, the information shared for collaboration can also be used to improve application performance. Secondly, collaboration is not easily retro-fitted to exist ing solutions and should to be built in from the start. So collaborative data sharing
is a fundamental requirement.
1.3.4 Application Management
Large-scale and widely distributed computing systems present a number of unique problems, relating to application management. The central issue is how resources are used in a decentralised, heterogeneous computing environment. There are two sides to application management: the need of an individual application to use re sources; and the need of a resource owner to moderate use of the resource. On the one hand each distributed application needs answers to the following questions:
• what resources are available? • when are they available? • how do I access them? 3
These questions are all about discovering resources and configuring applications to deal with heterogeneity. The answer is to provide clients with generic means of describing, looking for and accessing resources. On the other hand, resource owners need answers to a different set of questions:
• how do I make clients aware of my resource?
• how do I guarantee availability of the resource to a client? (to avoid over committing a resource)
• how do I limit availability of the resource? (to prevent use by inappropriate clients, to stop a single client monopolising the resource, to make the resource available only at certain times)
These are questions of resource management, and are about ensuring that a re source is used appropriately, efficiently and fairly. Answering these questions also requires that clients use standard ways of finding and accessing resources. View ing geospatial images in a CVE involves a variety of network, data and computing resources. Hence a systematic approach to application management is required.
1.4 Scope and Suitability of the Problem
In setting the scope of this work the aim has been to consider a problem which is broad enough to be interesting, yet focused enough to be achievable. All work has limits and imagery dissemination and collaborative analysis present challenges be yond the four basic functional requirements described above. Perhaps the most sig nificant is the process of searching for images. This is a rich and complex problem in its own right, and is not considered in this work: rather it is assumed that the user already knows about the images that he or she is interested in. Image search ing is an area of active research and, in this respect, a CVE client is no different to any other. Security is another important issue not considered here. For military applications security is paramount and the value of geospatial imagery means that security is also relevant for other applications. Finally, collaboration brings with it a unique set of issues. Although this work is firmly rooted in area of Collaborative Virtual Environments it does not concentrate on the human factors associated with collaboration, but on the underlying problem of data distribution4. Important as each of these problems may be, they are beyond the scope of this work.
With any problem where data volume or processing rates are the limit it is rea sonable to ask if Moore's Law will ultimately provide a solution. Will the massive in creases in storage and processing capacity of future systems fundamentally change the way we address the four functional requirements? The answer is no. We can ex pect that the percentage of data held in online tape silos will increase. However, just as storage and processing capacity is increasing, so too are the spatial and spectral resolution capabilities of earth observation systems. New hyper-spectral, high reso lution satellites are coming online all the time and the volume of data produced by these new systems will be considerably greater than currently available. If anything, the volume of data will increase faster than our ability to deal with it. It is reasonable, therefore, to suppose that visualising geospatial imagery in Collaborative Virtual En vironments will remain an interesting research problem for many years to come.
1.5 A Solution
The solution proposed here is a software architecture for imagery dissemination that optimises responsiveness and supports collaborative data sharing. This addresses the runtime performance requirements of a single application. The architecture also addresses the broader application management requirement for a production sys tem. Known as the Responsive Architecture for Pipelined Imagery Dissemination
(Rapid), it consists of three main elements:
1. A dissemination pipeline used to access data from imagery archives, process and transform it in arbitrary ways, and deliver it to visualisation clients. The pipeline uses parallel streaming techniques to optimise bulk data movement between processing operations. Parallel streams are formed using a flexible connection object. Data movement is further optimised by flow control and scheduling mechanisms. These all work to meet the basic requirement for high rates of throughput.
2. A parallel data cache, deployed at client sites to optimise responsiveness. The
Rapid Cache (Race) isolates visualisation clients from the latency of the dis semination pipeline. It uses speculative fetching policies and approximates results to further improve responsiveness. In addition it provides a inter-site communications topology to support collaborative data sharing.
3. An application management framework to allow dissemination pipelines to be formed within the context of a computational grid [35]. This includes a well- defined life-cycle for pipelines, a collection of brokers and traders to manage resources and a schema for publishing resource descriptions in a public direc tory service.
The centrepiece of the architecture is the Rapid Cache, a middle-tier component which performs a unique set of functions. It integrates latency sensitive visuali sation clients with a high-bandwidth, high-latency dissemination pipeline without coupling their executions.
1.6 Approach and Methodology
This thesis adopts the methodology of a software architect: a practitioner’s approach grounded in the development and review of working systems. Independent solu tions exist within the data and visualisation domains for each of the four basic func tional requirements. The challenge is to integrate these disparate elements into a coherent whole. In this context an architectural approach can bear much fruit.
system. Consequently the evaluation of experimental systems is a blend of experi mental results and systems analysis. The goal of the experimental work is to distill general architectural principles from practical system.
Where possible, standard notations are used to report results. I deliberately avoid defining my own language, calculus or notation. System diagrams are presented in the Unified Modeling Language (UML) [39]. Use-Cases [71] and Design Patterns [40] are used to characterise system behaviour. This style of reporting reflects a belief that exploratory research should not preclude good software engineering practice.
1.7 Organisation
In keeping with the architectural approach, this thesis is organised along the lines of the classic waterfall model of software engineering. It moves from the general to the specific through chapters which consider requirements, specification, design and implementation. Real software engineering projects rarely follow the linear progres sion implied by the waterfall model, and this thesis is no exception. The transition from abstract to concrete is a useful descriptive device, but does not present the work in chronological order. In fact the experimental systems were all built before the Rapid architecture was specified. So the case studies validate some portions of
the architecture, and motivate others.
Chapter 2 reviews formative concepts from relevant literature. The emphasis here is not on an exhaustive taxonomy of research into geospatial imagery or collab orative virtual environments. Rather, the aim is to identify key requirements from the data and visualisation domains and so provide the context for Rapid.
Chapter 3 sketches a general outline of a complete solution. It specifies the key techniques and ideas that need to be encapsulated in the architecture. A concrete design is presented in Chapter 4. This describes the three main elements of Rapid
in considerable detail, and is the major result of the thesis.
The remaining chapters present three case studies into working systems. Each system demonstrates different elements of Rapid. Chapter 5 presents the first case
study, which considers the responsiveness requirements of a visualisation client. It is based on the Comet terrain exploration tool, which was presented at the tenth ple nary meeting of the Committee of Earth Observation Scientists (CEOS). The second case study, presented in chapter 6, describes three different imagery dissemination systems, with an emphasis on achieving high rates of throughput in a distributed pipeline. The final case study, in chapter 7, considers how a computational grid can provide the required application management services. It describes the vGrid, a framework for executing and managing Collaborative Virtual Environments and the resources they consume.
Formative Concepts
This thesis sits at the convergence of two existing areas of research: geospatial im agery and Collaborative Virtual Environments. It is informed by results from both the data and visualisation domains. Before diving into a detailed consideration of how to integrate the two domains, it is useful to review the state of the art in each. There are also several important areas of distributed computing research which are relevant. This chapter considers the major concepts and significant literature that provide the context for Ra p i d.
2.1 Managing and Using Geospatial Imagery
The term geospatial imagery is applied to a highly diverse collection of earth ob servation data. Mature techniques already exist for collecting, managing and pro cessing this data. In this section we will review some of the essential characteristics of earth observation data and the methods currently used for storing and process ing it. We will also look at approaches to tiling and degrading imagery, and the in evitable issues of coordinate systems and map projections which arise from using tiling mechanisms.
2.1.1 Earth Observation Systems and Data
There are many kinds of geospatial imagery produced by the various satellites and sensors in orbit around the planet. Some of these were mentioned in Section 1.1 of the previous chapter. Although there are many differences in earth observation system it is possible to define a number of characteristics common to all geospatial imagery. Each image may contain more than one viewable channel, representing different portions of the spectrum or different sensors. The major component of each channel is a two-dimensional contiguous block of pixel data1. All pixels in a channel will be recorded with the same precision (bits per pixel), which usually
im-1 This pixel data is usually supported by a variety of ephemeral data to describe the conditions, time and orientation of the vehicle when the image was recorded.
plies an optimal packed encoding of a channel2. The contiguous nature of the pixel data also implies that tiling strategies can be used to decompose the images into smaller blocks, or to form different levels of detail. Finally, images are recorded on a regular basis and so each individual data set is part of a larger temporal series. Often the frequency of recording is a function of the orbital characteristics of the satellite, and can be quite complex (for polar orbits in particular).
From these characteristics it is apparent that each individual pixel of a geospatial image has extent in the following dimensions:
• two or possibly three spatial dimensions3; • the channel set or spectral domain;
• the temporal dimension.
In addition there will be a collection of ephemeral metadata associated with each image.
Perhaps the defining characteristic of geospatial imagery is simply its size. Indi vidual images from current generation satellites may be tens of megabytes in size. As a result, even short time series of images consume very large amounts storage space. For example the GMS-5 satellite produces 210MB of compressed data per day: approximately 75GB each year. Yet GMS-5 is not a new satellite and by current standards its output is quite modest. Next generation satellites are expected to pro duce terabytes of data every day. Furthermore the number of new earth observation systems is increasing, as commercial companies enter the market. By the end of 2001 companies such as Space Imaging [66] and Orbimage [107] will have launched a series of civilian satellites with resolutions less than one metre4. The trend is clear: in coming years we will have access to more geospatial imagery, and at a higher res olution than ever before.
2.1.2 Storage and Repositories
Geospatial data consumes great amounts of storage space. Although the size of sec ondary storage (disks) continues to increase according to Moore’s Law, the volume of geospatial imagery is increasing at least as fast. The result: any non-trivial col lection of imagery must be maintained on a tertiary storage system, such as a tape silo. These devices can often stream data out at high rates, but incur a heavy start up delay. The number of tape drives within the device also limits the number of images
2It is important to note that since earth observation systems are rarely restricted to the visible spec trum they do not return pixel data in familiar (red, green, blue) triplets. Mapping results into the visible spectrum is a non-trivial operation and there are many different algorithms used to produce colour and false-colour images.
3Three dimensional imagery is produced from stereoscopic pairs of images. Generally speaking such imagery is rare and the overwhelming majority of geospatial imagery has extent in only two spa tial dimensions [45]. However, digital elevation models are common. Use of elevation data is consid ered in more detail in section 2.2.4.
that can be accessed concurrently. If a silo only has two drives then only two images can be stream ed out of the silo concurrendy. So access to tape silos, and the archives of data they contain, m u st be m anaged carefully.
Digital warehouses an d libraries have b een used for som e tim e to provide a high- level service interface to large tertiary storage facilities [87, 101]. There has also been considerable work providing rem ote access to archives of geospatial data. No table projects include NASA's Earth Observing System Data and Inform ation Service (EOSDIS) [110] and the Australian Centre for Remote Sensing (ACRES) Digital C ata logue [32]. These projects were developed in a piecem eal fashion with little thought of standardisation or inter-operability. However, standard archive interfaces are now being developed, with separate initiatives from the defence and com m ercial sectors. One set of draft standards is being developed by the OpenGIS C onsortium [141,142]. The U.S. National Im agery and M apping Association (NIMA) has a m ore m ature family of standards targeted at the defence sector, known as the U.S. Imagery and Geospatial Inform ation System (USIGS) [64,65]. The core of USIGS is an archive in terface standard, known as the Geospatial Im agery Access Services (GIAS) [149]. The GIAS is an elaborate specification and developing a full im plem entation involves considerable work [20,56].
A significant aspect of all archive interfaces is the way they decouple searching and browsing functions from data access. The GIAS, for example, uses one set of com ponents for query operations an d a com pletely separate set of com ponents for data access [149]. This decoupling stem s from an obvious engineering constraint: searching and browsing functions use a catalogue of m etad ata which is small enough to be m aintained on secondary storage, w hereas im age access involves m igrating large volum es of data off tape. The separation is particularly significant to Rapid: it
does not consider query issues, and is focused purely on data access.
2.1.3 Image Processing and Dissemination Pipelines
Figure 2.1: Rectifying an image to correct for the curvature of the earth. On the left is a raw NOAA image of the eastern half of the Australian continent. On the right is same image rectified to the more familiar Mercator projection. This image processing was performed in close to real-time using a parallel rectification operator running on a high-performance computing cluster.
Many image processing system s adopt a pipeline architecture [93]. Pipelines are form ed from a collection of processing operators, linked together so that the output of one operator flows into the input of the next. Each operator transform s the data as it flows along the pipeline, with the cum ulative results as the output of the last op erator. The term pipeline is som ew hat misleading since it implies a single sequence of operations. However, m any processing operations require m ore than one input or produce m ore than one output. For example to m ap the effects of urban growth involves examining the differences in images taken over a long period of tim e [45]. W hen an operator requires m ore th an one input the result is a joint in the pipeline: w hen it produces more than one output the result is a fork. So rather than being a linear sequence, a pipeline is actually a directed acyclic graph (DAG) of process ing operators; otherwise known as a data flow network. This architecture has been widely employed in a great m any image processing systems including, AVS [136], the Java Advanced Imaging (JAI) library [134] and PISTON [76,146].
ar-chitectures.
Whether processing is performed within the archive or not, there is still a need to distribute data to visualisation clients. A dissemination pipeline is a distributed data flow network which moves data from source archives through a set of processing operations and ultimately delivers it to visualisation clients. An important issue for any data flow network is how and when flows are initiated: this becomes crucial for a dissemination pipeline. A major theme of Ra p id is optimising the flow of data along
a dissemination pipeline.
2.1.4 Tiling and Resolution
There are two useful techniques for managing the size of geospatial data: decom position of an image into tiles and degradation of an image to lower levels of detail (LoD). Tiling techniques operate by treating a large image as an array of regularly sized smaller images. Data size is reduced without compromising resolution, but by limiting the spatial extent of each tile. LoD techniques take the opposite approach by degrading the resolution of an image. Hence size is reduced without limiting the spatial extent of an image. Both techniques are valuable for storage management and for interactive visualisation of earth observation data5.
Every image can be decomposed into a hierarchy of levels of detail and a three dimensional matrix of tiles of different sizes6. These two independent decomposi tions are demonstrated in Figure 2.2. Using both level of detail and tiling techniques results in quite a complex hierarchy of tiles. This hierarchy is partially depicted in Figure 2.3 as a two dimensional matrix7. The visualisation problem is essentially about ensuring that a client has a subset of the tile hierarchy sufficient to satisfy its rendering requirements.
It is often convenient to limit tile size and resolution to be powers of two. In this scheme the largest tile is twice as wide and twice as broad as the next largest tile: the highest level of detail has twice as much resolution, in each dimension, as the next highest level of detail. Note that since we are considering two-dimensional imagery, in both cases the largest tile or highest LoD will be four times the size of the next largest or highest. This organisation is convenient for paging and cache management since it promotes the use of fixed sized buffers of memory.
The two dimensions of the hierarchy shown in Figure 2.3 help illustrate four po tentially useful tile operations. Tile composition is the act of combining four neigh bouring tiles to form a larger tile. Tile decomposition is the reverse operation and involves dividing a large tile into four smaller tiles. In the matrix presented in Fig ure 2.3 composition equates to moving up one level, while decomposition equates to moving down a level. Tile degradation is the act of reducing the resolution of a
5The requirements of real-time terrain rendering are considered in detail in section 2.2.4.
(i) Level of detail hierarchy (ii) Matrix of tiles and sizes
Figure 2.2: Techniques for decomposing images: (i) by level of detail, and (ii) as a matrix of tiles at different sizes
Si
■ 5
decreasing level of detail
--- ►
tile, and it corresponds to moving to the right in the matrix. The forth operation is
tile refinement, which involves increasing the resolution of a tile and corresponds to moving left in the matrix. For most types of data composing and decomposing tiles is cheap and involves simple concatenation and subset of memory buffers. Degra dation is a sub-sampling problem, which may also be cheap for some types of data.
Although tiling and resolution mechanisms are useful for both storage and ren dering purposes, it is unlikely that both will use a single common hierarchy Dif ferent image processing operations within a pipeline may also place restrictions on how tiling and LoD are used and on the types and representation of data. One novel solution to this problem comes in the form of the A:-Tile [30] algebra. This pro vides a way of characterising the arrangement of regular data structures and mech anisms for mapping between different arrangements. It has been successfully used in image processing pipelines to describe and re-map data as it flows through the pipeline [146].
2.1.5 Map Projections and Coordinate Systems
An essential part of any tiling strategy is being able to describe what portion of an image any one tile represents. This requires a way to characterise the spatial extent and orientation of both the image and its tiles. Geodesy is the science of measuring and mapping the location of objects on the Earths surface [27]. It remains an active area of research, due to the irregular shape of the Earth. These irregularities, and our inability to precisely describe the shape of the planet, mean geospatial data is produced using a variety of map projections and coordinate systems. Mapping be tween coordinate systems, and rectifying images to a different projection, are com putationally expensive operations.
Coordinate systems are defined one of two ways: in terms of a two-dimensional map projection overlayed with a reference grid; or in terms of the shape of the earth. The Universal Transverse Mercator8 (UTM) projections [100] are widely used, but UTM is by no means the only standard for map projection. For example, the State Plane Coordinate System (SPCS) [130] is also common in the United States. Earth- based coordinate systems are characterised as either geocentric or geodetic. Geo centric systems use polar coordinates (angles of latitude and longitude and a dis tance) from the centre of the planet9. Geodetic systems are based on latitude and
8These are a derivative of the well-known Mercator projection, named after sixteenth century Dutch map maker Gerardus Mercator (1512-1594). The Mercator projection is produced by encompassing the volume of the Earth in a cylinder, where the axis of the cylinder is aligned with the poles and the sides of the cylinder touch the equator. An elegant property of the Mercator projection is that lines of latitude and longitude intersect at an angle of 90°: the disadvantage is that it greatly distorts the po lar regions. The Transverse Mercator projection, developed by Johann Lambert (1728-1777), shifts the area of distortion by setting the axis of the cylinder perpendicular to the axis of the earth. UTM is a collection of Transverse Mercator projections formed by dividing the Earth into 60 zones between lati tudes 84°N and 80°S, each 6° wide in longitude. There is an extensive body of literature on projections. Useful starting points may be found in [27,100].
longitude and elevation above sea level, but must account for the irregular shape of the world. The World Geodetic System 1984 (WGS-84) [63] defines a standard model of the planet, and is a popular basis for geodetic coordinate systems.
Although the profusion of coordinate systems is inconvenient, it will always be the case that images and coordinates will require mapping. The roughly spherical shape of the planet obviously affects and distorts images as they are acquired, but for visualisation it is usually preferable to treat the surface of the planet as a flat plane. So there is an inevitable mismatch between raw acquisition data, and that required for visualisation. Consequently, the costs of mapping between coordinate systems and of rectifying images are in many ways inherent. This problem is already considered in some standards, such as the OpenGIS Coordinate Transformation Ser vices [143]. Although not considered in detail in this dissertation, Rapid is sensitive to the need for rectification and coordinate mapping.
2.2 Challenges with Collaborative Virtual Environments
Having formed an understanding of the data domain it is time to consider how Col laborative Virtual Environments (CVEs) can be used to visualise this data. Collabo ration is what distinguishes a CVE from other forms of visualisation, and the impor tance of shared experience and real-time interaction are hard to overstate. Smith and Weingarten go so far as to describe a CVE as “the ultimate synthesis of network ing and media technologies” [128].
CVEs are real-time, distributed applications. With current, best-effort networks there are a number of difficult tradeoffs and limitations which affect how data is distributed; these are reviewed in section 2.2.1. Perhaps the defining problem of CVE research is estimating the position of moving objects in a virtual space; this problem is considered in section 2.2.2. Addressing the basic requirement for collaborative data sharing involves developing loose models of consistency and causality; these are considered in section 2.2.3. Finally, real-time terrain rendering is an interesting and demanding problem in its own right and the major techniques are reviewed in section 2.2.4.
2.2.1 Data Distribution Tradeoffs
CVEs make use of a broad range of data types and media, which must be distributed and shared quickly enough to preserve a sense of real-time interaction [138]. Data types commonly used in CVEs include: 3D geometry and models, streams of au dio and video media, 2D images and textures, haptic (force feedback) information, results from database queries and output from high-performance computing simu lations [24]. These data types each have unique sharing and responsiveness require ments, which translate into a raft of quality of service (QoS) issues. With current
best-effort networks any form of QoS is hard to guarantee, and the solutions that work for one data type may not work for any other. Consequently, despite consider
able research into CVEs [15,25,68,84,97,145,153,159], there is no generic solution to the data distribution problem.
Rather than reveal a single solution, CVE research has identified a range of en gineering trade-offs that affect how collaborative data is shared in real-time. In the words of Michael Capps and Chris Greenhalgh:
The field of shared virtual environments has matured. We now have a reason able understanding of the range of issues that must be considered, and of the key technologies and approaches that can be successfully deployed within par ticular domains of use. We do not believe that any single technological solution can address every potential application. However, we now have access to a num ber of enabling technologies that allow us to construct flexible and extensible technology building-blocks, that can be drawn together in different combina tions for different applications and requirements.
Michael Capps and Chris Greenhalgh, CVE 2000
The Consistency-Throughput Tradeoff [126, pages 102-107] is one important engi neering compromise that must be made for any CVE. Singhal and Zyda explain the tradeoff succinctly:
It is impossible to allow dynamic shared state to change frequently and guaran tee that all hosts simultaneously access identical versions of that state.
Sandeep Singhal and Michael Zyda [126, page 103]
Many other tradeoffs exist. In attempting to introduce a new type of data, such as geospatial imagery, into a CVE it is important to understand the factors that will affect how that data is shared.
2.2.1.1 Model/View Distinction
In keeping with the Model-View-Controller [77, pages 26-49] design pattern there are two fundamentally separate sets of data used in a CVE. First there is an underly ing model of a virtual world. This is the state of the application that must be shared between all participants. Second there is representational data, which is used to render the virtual world to visual displays, auditory systems and haptic devices. For example, a flight simulator must represent the aerodynamic properties, damage and ordinance levels of every aircraft in the simulation as well as having geometry, tex tures and audio samples to render the aircraft. The former are model data structures, the later are views.
an audio stream or the occasional dropped fram e in a video are acceptable. Model data structures, by com parison, are less affected by latency bu t do require reliable delivery and high degrees of consistency.
It is not always possible to cleanly separate m odel and view data, and the dis tinction is ignored by m any CVE toolkits. For example the Avango [145] toolkit com pletely merges all m odel and view data into a shared scene graph. While this blurring of the lines simplifies the construction of very sim ple applications, it does not work for large or complex data such as geospatial imagery. Although, on first impressions, geospatial images my seem to be view structures they cannot be rendered directly10. Consequently, Ra p i d concerns itself w ith the distribution of m odel data.
2.2.1.2 Data Size
Leigh, Johnson and DeFanti [85] argue that it is useful to categorise CVF data into three sizes: small, medium and large. Small data, in the order of a few kilobytes, can be distributed in real tim e and broadcast to all participants w ithout too m uch concern for relevance. A good exam ple of a small data structure is the Entity-State packets* 11, used by the D istributed Interactive Sim ulation (DIS) [68] protocol to u p date the position of objects moving in a virtual environm ent. M edium data is too large for indiscrim inate distribution, b u t still small enough to fit w ithin the m em ory of an en d -u ser’s visualisation m achine. Large data exceeds the m em ory capacity of a typical display m achine and so m ust be m aintained on a rem ote server, partitioned and accessed piece by piece.
Although considerable work has b een done on single-user visualisation oflarge scientific data sets [150], only recently has the problem been considered for a CVF [86] The goal of Ra p i d is to integrate one family oflarge data structures into Collaborative
Virtual Environments.
2.2.1.3 Access and Communications Patterns
Patterns of access to a data structure have a significant im pact on how it m ust be dis tributed. In particular the ratio of readers to writers is a crucial consideration [138]. Low-latency read access can be achieved by replicating state to all readers. Write access is m uch more expensive, since it entails all the problem s of locking and seri alisation associated w ith strict equivalence to sequential write consistency [1,3,16, 111]. Hence, the num ber of writers and p atterns of access affect how a data structure is distributed.
An intim ately related issue is the p attern of com m unications betw een hosts in a CVF, and the connections used to access data. W hen a CVE has well-defined com m unications patterns it is possible to optim ise the m ovem ent and routing of data. Such optim isations require the developer to define an application-level topology of
10Section 2.2.4 considers terrain rendering in detail.
connections, tailored to the particular flows of data between hosts. The first CAV- ERNsoft [84,85] toolkit was based on this concept, and affords great flexibility in the way topologies are formed and data shared. CAVERNsoft applications first create a network of connections between hosts, then specify what data should be shared over each connection and how it should be kept consistent. This approach is especially relevant to dissemination pipelines, which have static communication patterns and require optimal throughput.
2.2.1.4 Computational Cost
Computational cost affects how, and more importantly where, data should be dis tributed. Rendering a three dimensional virtual environment can easily consume all the cycles of a visualisation workstation. If the environment contains an expensive feature, such as a numerically intensive simulation, then there is a case for centralis ing the feature on a single server and broadcasting the results to visualisation clients. This approach has been used successfully with many different high-performance computing simulations [13,24,108].
Conversely, if there is a low cost associated with a feature it may be better to have replicas on all client machines. Local replicas avoid the latency associated with ac cessing results from a remote server. They can also be a useful way to overcome com munication bottlenecks. If the results of a computation are larger than the inputs, then it is more efficient to share inputs and replicate the computation. Multi-player video games commonly use this technique to overcome the bandwidth limitations
of modems 17].
2.2.1.5 Time Sensitivity and Buffering
Certain types of data are highly dependent on time and/or have a constant rate of change. Such types lend themselves to data streaming. Obvious examples are au dio and video media, both of which have constant rates of change and rely on data streaming models for distribution. The significance of time dependent and constant change data is twofold: it is typically very sensitive to variation in network latency (jitter); and it implies a minimum constant bit-rate required of a network. These two issues correspond to quantifiable network quality-of-service requirements. How ever, time dependent data may be quite tolerant of latency. For example if two users on opposite sides of the world are listening to the same network radio stream it does not matter if one user hears the stream two seconds before the other, what matters is that they both hear the stream at a constant rate.
strategic use of buffering is a major element of Rapid.
2.2.1.6 Scalability
Large-scale military simulations involve tens of thousands of participants: current and future multi-player games feature hundreds of thousands of players [22]. Build ing virtual worlds that can scale to support a very large number of participants is a challenging problem [46]. The solution is to minimise the amount of information sent to each user, known more formally as area-of-interest management.
Area-of-interest management is essentially a load-balancing problem. The sim plest solution is to statically partition the virtual space into a number of areas. This approach was used in NPSNET [95, 96] and is effective as long as participants are evenly distributed through the space. Dynamic area of interest management in volves creating and managing a collection of interest groups, or locales. Systems such as Mitsubishi Electric Research Labs (MERL) Spline VE [158] and Sony's Com munity Place [80,81], as well as numerous multi-player games, have used dynamic interest management with some success. Perhaps the most sophisticated example of interest management was the MASSIVE-2 [47] environment, which was based on a comprehensive spatial model of interaction [5,46]. These systems reveal a familiar result for dynamic load balancing: there is an important tradeoff between the degree of load balance and the cost of computing the partitioning.
2.2.2 Object Position Estimation
So far the discussion has focused on how arbitrary data types are shared in a CVE. Perhaps the single most important shared data type is object positions, since the movement of objects is a very common cause of change in a virtual space. In fact sharing in real time the position of many moving objects is one of the defining re search problem for Collaborative Virtual Environments. Early CVEs, such as SIM- NET [75], identified the challenge: it is not practical to simply broadcast the posi tion of an object as it moves. There are numerous problems with a naive broadcast strategy: network latency means that object positions would be spatially correct but temporally incorrect; smooth animation of moving objects would require that ren dering and broadcasting be synchronised for all hosts; and the bandwidth use for even moderate numbers of objects would overwhelm a contemporary LAN.
error threshold. This greatly reduces the volume of data that must be shared, and also allows different hosts to render at different frame rates. Dead reckoning is such an effective technique that it has been used as the basis of many commercial video games, the defence simulation High Level Architecture (HLA) [25], and has been codified as an IEEE standard [68].
Dead reckoning is a useful, general-purpose algorithm for object position esti mation but it doesn’t guarantee smooth continuous motion. Consequently the ba sic technique has been improved in various ways to remove discontinuities. The Paradise project [125] was able to refine the technique by using a log of past posi tions to improve the accuracy of estimates, and converge smoothly when estimated position varied significantly from the real position. It had the added advantage of transmitting less data than classical dead reckoning. Ryan and Sharkey [121] took a different approach by skewing the temporal perception of a virtual space. Rather than attempt to mask the latency of the network, they explicitly modelled it as part of the environment. Data from remote hosts is rendered in different “time zones” depending on the latency between hosts12. This approach works very well, but only as long as time zones do not overlap. Finally it is possible to introduce application- specific information to further improve the accuracy of position estimates and at the same time reduce the amount of data shared [78]. For constrained problems special purpose estimators can be built that share the minimum of non-deterministic infor mation about object position [79].
Object position estimation is fundamental to all collaborative virtual environ ments. Using the criteria defined in section 2.2.1 it is obvious that object positions are a very different type of data structure to geospatial imagery. Dead reckoning packets are small, view-level data structures with minimal computational cost and only limited sensitivity to time. The access and communication patterns are also very different to those of a large geospatial data set. Consequently the data sharing mechanisms for object positions will be different to those used for imagery dissem ination.
2.2.3 Perceptual Consistency and Collaborative Data Sharing
Interaction between users of a virtual environment requires a common perception of the passage of time, and a shared sense of action and consequence. This is known
as perceptual consistency: a m uch weaker notion of consistency than that applied to classical distributed system s [1, 111]. Perceptual consistency works on the basis th at replicas of a data structure are allowed to becom e inconsistent across m ultiple m achines, so long as these inconsistencies are not perceptible to the end user. Dead reckoning exploits perceptual consistency: the shared sense of an object’s position is allowed to becom e inconsistent but the spatial error is barely perceptible. This form of bounded inconsistency is similar to the notion of Epsilon serializability [112,165] developed w ithin the database community. However, for an arbitrary data structure it is not possible to define w hether an inconsistency is perceptible or not, so it falls to application developers to define the consistency sem antics of shared data stru c tures.
Perceptual consistency is a hard concept to support in a general-purpose co m m unications toolkit. The basis of m ost sequential consistency models is the ability to im pose a total ordering on events within a distributed system. The ISIS [8,9] group com m unication toolkit was used by several early CVEs because it provides total o r dering of messages. However, total ordering is expensive to im plem ent and does not scale well. W hat is needed to im plem ent perceptual consistency is a group co m m u nication m echanism th at allows the application developer to define w hat m essage ordering is sufficient. This is known as sufficient casual order am ong messages.
In practical term s, sufficient causality requires a group com m unications service with reliable and unreliable delivery m odes13, and very flexible message ordering semantics. Roberts and Sharkey [117] describe how sufficient causality can be sp ec ified by sequencing m essages in term s of casual and non-casual order and optionally against a global wall- clock. This approach was used as the basis of the PaRADE [116] and MASSIVT-3/HIVEK [129] toolkits. The im portance of sufficient causality is th at it provides a very sim ple program m ing abstraction, w hich allows the application d e veloper to m inim ise the costs of ordering and reliability. It also provides a basis for exploiting im perceptible inconsistency am ong replicas of a shared data structure.
Provision of a group communication service with sufficient causal order is an important element of Rapid.
2.2.4 Terrain Rendering
Visualising geospatial data in a CVE involves rendering a three-dim ensional terrain surface in real-tim e. Naive rendering algorithm s do not work at interactive rates for even modestly sized pieces of terrain, and so a n u m b er of sophisticated techniques have been developed for real-tim e terrain rendering. A terrain surface is form ed from elevation geom etry decorated with one or m ore texture images. This presents two related rendering problem s: limiting the n u m b er of triangles used to tessellate a terrain surface and m anaging caches of texture im agery used to decorate the surface.
At the heart of all real-tim e terrain rendering system s is an algorithm to m a n age level of detail (LoD) in the surface geometry. Such algorithms refine the coarse
— f— }---...;
: ' ' j l ± L | J ' J L
r: " .r r - x , v - \(i) uniform surface tessellation
(ii) adaptive surface tessellation with maximum resolution in the camera foreground
LoD techniques described in section 2.1.414. To render natural looking terrain it is necessary to tessellate (decompose) the terrain surface into a mesh of triangles. The mesh need not be uniform in density: some terrain features require many small tri angles to represent accurately; others can be approximated by a few large triangles. The location and orientation of the camera is crucial, since it defines the frustum of observable space and so limits the area of the surface which must be rendered. It also defines what resolution different portions of the surface should be rendered at: typically objects in the camera foreground should be rendered at a much higher resolution than those on the horizon. Figure 2.4 demonstrates the inefficiency of a uniform tessellation because most triangles are concentrated on the horizon, where they are of least value. Consequently, the goal of any LoD algorithm is to minimise the number of triangles used to approximate a surface within a frustum of observ able space and some bound of spatial error.
Non-uniform surface tessellation can be achieved by subdividing triangles to dif ferent degrees. The result is a hierarchy of triangles stored in a quad-tree or equiva lent data structure. Early LoD algorithms, such as Lindstrom’s [90], used a bottom- up approach to building this hierarchy. Bottom-up algorithms have the disadvan tage that they require the elevation data at full resolution in order to build the hier archy, thus precluding paging of elevation data and so limiting terrain extent. Most current algorithms are derived from ROAM [26], a top-down algorithm which achieves excellent performance using a pre-computed multi-resolution elevation data struc ture. Perhaps the major driver of current work on LoD algorithms is the computer games industry. Modern games place a premium on photo-realistic graphics and high quality, high performance terrain renders are used in many flight simulators, sports and driving games. Many of these are based on the ROAM algorithm [147] but with considerable modifications to support features such as paging elevation data [148].
Surface tessellation is one major problem for a real-time terrain Tenderer; the other is texture management. Texture memory in graphics hardware is a very lim ited resource. MIPmaps [104] are the basic mechanism used by almost all contem porary hardware to manage texture size and optimise use of available texture mem ory. MIPmapped textures are a hierarchy of two-dimensional images at progres sively lower levels of detail. Low levels in the MIPmap are very small and represent the texture at very low resolution; high levels are larger and feature much greater res olution. MIPmapping works well, but only when a texture is small enough to fit in system memory at full resolution. Larger textures, such as geospatial images, require