Impact Evaluation of the SEND
Pathfinder Programme
Research report
October 2013
SQW - Meera Craston, Graham Thom and Rhian Spivack
Ipsos MORI – Claire Lambert and Fay Yorath
BPSR – Susan Purdon and Caroline Bryson
2
Contents
List of figures 5
List of tables 6
Acknowledgements 10
The Team 11
The Evaluation team 11
Executive Summary 12
Conclusions and implications 12
Families experience of the process 13
Delivery of services 14
Change in families’ perceptions of the processes 14
Outcomes experienced 15
Staff work and satisfaction 15
Indicative costs of reform 16
1: Introduction 17
The SEND pathfinder programme 18
An introduction to the evaluation 18
Contents of the report 19
2: An introduction to the impact study and the supplementary qualitative family research20
The impact study 20
The quasi-experimental design 21
Matching to improve comparability 22
Outcome measures 23
3
Summary 29
3: Families’ experience of the process 30
Understanding of the process/decisions 34
Parent carer perspective 34
Child/family-centred processes 36
Child and young person perspective 41
The role of the plan 43
The role of the key worker 44
Joint working 46
Burden placed on families 55
Satisfaction with the process 56
Summary 64
4: Families’ experience of the processes: Delivery of services 65
Choosing support services 65
Sufficiency of support 69
Satisfaction with services 71
Sub-groups 73
Summary 74
5: Families’ experience of the processes: Change in families’ perceptions of the
processes 75
Summary 79
6: Outcomes experienced 80
Child outcomes 80
Health and wellbeing 80
4
Experience of education 82
Parental/family relationship outcomes 84
Understanding what has led to changed outcomes 86
Summary 86
7: Staff work and satisfaction 88
An introduction to the staff survey 88
Context 90
Staff work and satisfaction 90
Reflections on the new approach 93
Summary 94
8: Indicative costs of reform 96
Costs of developing the pathfinder approach 97
Funding and spend 97
Estimating the costs of setting up of the pathfinder approach 99
Delivery of the pathfinder approach 100
The cost of all staff participating in formal EHC Plan meetings 101
The cost of keyworkers across all EHC Plan activities 105
Costing the process 106
Summary - Indicative costs of reform 107
9: Conclusions and implications 108
Annex A: A summary of our approach to the pathfinder evaluation 120
Annex B: Additional tables from the impact study 124
Annex C: Family based case studies 137
5
List of figures
Figure 1 Organisational responsibilities 11
Figure 2 The new process – summary of most common stages and sequencing 33
Figure 3 Funding allocation and spend by pilot area 98
Figure 4 Breakdown of 2011/12 and 2012/13 costs by CDF theme and by the service that
incurred the cost 99
Figure 5 Characteristics of the EHC Plan process 102
Figure 6 Number of EHC Plan meetings per case, by type of process 103 Figure 7 Professional and family time spent in EHC Plan meetings per case, by type of
process 104
Figure 8 Length of the EHC Plan process per case, from first meeting to sign off of plan 104 Figure 9 Learning and challenges experienced by the pathfinders 113
Figure 10 Aims and objectives of the evaluation 120
Figure 11 The evaluation approach 123
Figure 12 Organisational support 149
Figure 13 Decision influence 149
Figure 14 Cross working 150
Figure 15 Physical demand 150
6
List of tables
Table 1 Categorisation of the outcomes 23
Table 2 Profile of pathfinder families in the impact study 27 Table 3 Extent to which parent carers agreed they understood the processes 34 Table 4 Extent to which parent carers agreed decisions were explained clearly 35 Table 5 Extent to which parent carers agreed families’ views taken into consideration 36 Table 6 Extent to which parent carers agreed that they were encouraged to think about
what wanted 37
Table 7 Extent to which parent carers agreed their suggestions were listened to 38 Table 8 Extent to which parent carers felt decisions supported families’ views 39 Table 9 Extent to which parent carers agreed young person had a say over support 42 Table 10 Extent to which parent carers agreed young person’s views were taken into
account 42
Table 11 Extent to which parent carers agreed processes were straightforward 49 Table 12 Extent to which parent carers agreed they had to explain on multiple occasions
50 Table 13 Extent to which parent carers agreed services worked closely together 51 Table 14 Parent carer views on the extent to which support planning had taken place
jointly or separately 52
Table 15 Parent carer views on the extent to which support planning took into account all of a young person’s needs when it took place separately for each service 53
7
Table 21 Satisfaction with the outcomes of the process 59
Table 22 Dissatisfaction with the process 61
Table 23 Dissatisfaction with the outcomes 63
Table 24 Parent carer views on the perceived amount of choice over providers 66 Table 25 Parent carer views on the perceived amount of information on providers 67 Table 26 Parent carer views on the level of ease of organising support and services 69 Table 27 Parent carer views on whether the young person receives support needed 70
Table 28 Parent carer views on satisfaction with services 72
Table 29 Parent carer views on satisfaction with services, education services 73 Table 30 Parent carer views on whether support services better or worse than before 76 Table 31 Parent carer views on whether processes more or less straightforward than
before 77
Table 32 Advantages of single plan and Statement 77
Table 33 Parent carer views on whether services work more or less closely than before 78 Table 34 Parent carer views on whether young person receives more or less
encouragement to be involved than before 79
Table 35 Parent carer views on how well the young person gets on with other young
people 81
Table 36 Extent to which parent carers agree that their child enjoys educational setting 83 Table 37 Overall response rate for the baseline and follow up surveys 89 Table 38 Composite net change between baseline and follow up survey 91 Table 39 Departmental grant allocation for the 18 month pathfinder programme 97 Table 40 Average funding allocation, spend and difference between allocation & spend
across areas 97
8
Table 42 Overarching costs (2011/12 and 2012/13) 100
Table 43 Details of those included in tracking analysis 101
Table 44 Formal meetings in the EHC Plan process 103
Table 45 Average number of hours spent per month per case 105
Table 46 Conversion of monthly time commitment into the time required to take one
family through the process 106
Table 47 Estimated costs of delivery 107
Table 48 Indicative costs of reform (based on 2011/12 and 2012/13 figures) 107 Table 49 Extent to which parent carers agree that decisions were fair given money
available 124
Table 50 Extent to which parent carers agreed that decisions were fair compared to other
young people 125
Table 51 Parent carer views on satisfaction with process, social care 125 Table 52 Parent carer views on satisfaction with process, specialist health services 126 Table 53 Parent carer views on satisfaction with services, social care 127 Table 54 Parent carer views on satisfaction with services, specialist health care 128
Table 55 Parent carer reported health of young person 129
Table 56 Parent carer reported of young person’s quality of life, by pathfinder and
comparison groups 129
Table 57 Parent carer views on concerns about young person’s safety outside the home 130 Table 58 Parent carer views on frequency their child plays sport 130 Table 59 Parent carer views on the frequency their child sees friends 131
Table 60 Parent carer views on young person’s confidence 131
Table 61 Parent carer views on young person’s confidence talking with adults 132 Table 62 Extent to which parent carers agreed that young person is motivated at
9
Table 63 Parent carer views on post-16 aspirations for their child 134
Table 64 Parent carer self-reported parental health 134
Table 65 Parent carer reported parental control over daily life 135
Table 66 Parent carer reported parental quality of life 135
Table 67 Parent carer views on family functioning scale, by pathfinder and comparison
10
Acknowledgements
11
The Team
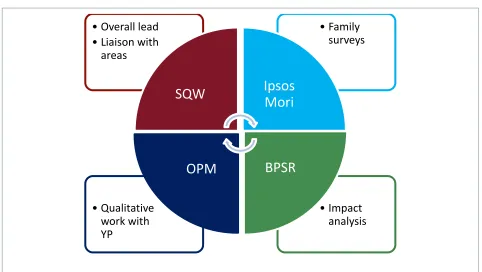
SQW was commissioned by the Department for Education to lead a consortium,
including Ipsos MORI, BPSR and the Office of Public Management (OPM), to undertake the evaluation of the SEND Green Paper Pathfinder Programme. The team drew
[image:11.595.55.537.211.483.2]together a wide range of complementary experience. Each organisation had a distinct role to contribute to the effective evaluation of the Programme as shown in the diagram below.
Figure 1 Organisational responsibilities
OPM
The Evaluation team
Graham Thom, a Director at SQW, acted as the Project Director of the Evaluation.
Meera Craston (nee Prabhakar), a Director at SQW, acted as the Project Manager of the Evaluation.
Rhian Spivack (nee Johnson), Kerry Fox, Christopher Carr, Rachel Redman and Tarran Macmillan formed the other members of the SQW research team.
Emma Wallace and Claire Lambert, a Research Director and an Associate Director, acted as the leads for Ipsos MORI.
Susan Purdon and Caroline Bryson acted as the leads from BPSR. Sanah Sheikh and Lucy Smith acted as the leads for OPM.
• Impact analysis • Qualitative
work with YP
• Family surveys • Overall lead
• Liaison with areas
SQW
Ipsos
Mori
12
Executive Summary
This report is the second of two volumes containing the evaluation findings from the first 18 months of the Special Educational Needs and Disabilities (SEND) Pathfinder
Programme. This volume covers the impact evaluation, which describes and analyses the:
Experiences, outcomes and distance travelled by the initial cohort of participating families
Extent to which working practices have changed for staff/individuals that have worked directly with these families
Indicative assessment of the costs of the reforms1.
This report contains data gathered through a survey of parent-carers (gathering the views of the first cohort of families, the majority of whom were interviewed in the first half of 2013), qualitative case studies with families that participated in the pathfinder, a staff work and satisfaction survey and the cost/expenditure and family-related elements of the SQW monitoring tool.
Conclusions and implications
Overall the results show that the new approach can work. They present a series of statistically robust improvements around many elements of the process. Families are noticing a difference and reporting: greater understanding of the process; feeling more involved and listened to; improved joint working across services; having better information; and being more satisfied with the service that they are receiving. They appeared to prefer the new process to the old SEN Statementing approach, finding it broader based and more long term in focus. Also positive was that pathfinder families were less likely than comparison group families to report that they did not have enough choice or enough information about the choice.
In general we mostly found that between 8 to 17 per cent more Pathfinder families ‘strongly agreed’ with positive statements about the process than comparison families (although there are some outcomes for which the percentage difference was higher and some for which it was lower). While positive, the overall level of change appears modest at this relatively early stage2. The amount of change may reflect both that a good number of families were content with the old process and that pathfinders continue to refine their approaches. In parallel it is apparent that on many of the process indicators
1
The process and implementation evaluation, which describes and analyses the approaches adopted to deliver the new processes and should be read in conjunction with this report was published in June 2013.
2
13
the level of dissatisfaction has declined to roughly half of what it was before. The next phase of the evaluation will test if the improvements seen to date become more widespread.
While the overall feedback on the process was positive, as yet the survey found no consistent evidence to illustrate an improvement in outcomes had occurred. The extent to which service receipt and outcomes change over time will be tested in more detail through the next phase of the evaluation.
Overall the findings and implications from the Impact report very closely mirror those of the earlier Process report. They provide broad support for the direction of travel, with statistically robust improvements in many parts of the process. They also highlight a number of lessons for pathfinders and non-pathfinders to focus on as they move closer to full implementation:
The positive impacts appeared to be linked to a range of factors but especially the involvement of a ‘key worker’ or ‘group of individuals’ that had delivered the new process and therefore provided the families with support. The approach,
knowledge and skills of this group going forward will be crucial
There remain issues around the information available to families, emphasising the importance of getting the local offer right
While parents feel much more involved, this has not transferred to the same extent to young people. This may need to be addressed as part of the workforce
development associated with key working
While joint working is getting better, the flows of information between services could be better, to save families having to explain their needs on multiple occasions.
Families’ experience of the process
Pathfinder families were significantly more likely than comparison families (albeit at a 90 per cent confidence level) to strongly agree that they understood the assessment and support planning processes (38 per cent pathfinder families; 27 per cent comparison). They were also more likely to say that their views had been taken into account (88 per cent versus 73 per cent). Families’ understanding of the process and the extent to which it had been child/family centred appears strongly influenced by the skills and knowledge of the ‘key worker’ or ‘group of individuals’ that had provided them with support,
14
Pathfinder parents reported getting a significantly more straightforward and ‘joined up’ service than those in the comparison group. However, the survey findings also
highlighted there was further room for improvement in this area, perhaps reflecting cases where some services had not engaged as fully as expected. The effects of improved joint working included more timely access to services and less of a burden on parents to make this happen.
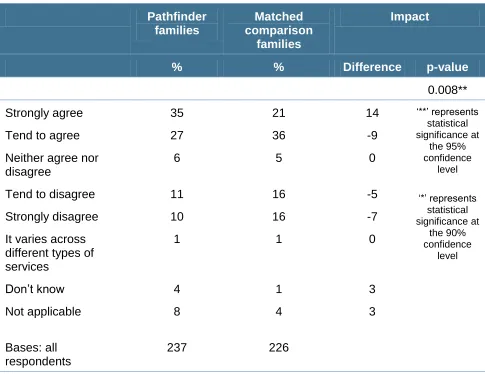
Overall, pathfinder families reported being more satisfied with the assessment process, 35 per cent of pathfinder families were ‘very satisfied’ with the assessment and planning process versus 27 per cent of the comparison families.
Delivery of services
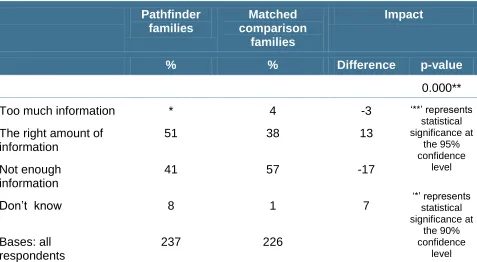
The pathfinder successfully reduced the proportion of parents saying they had ‘not enough choice’ in services, 45 per cent of pathfinder parents reporting ‘not enough choice’ compared to 61 per cent of comparison group parents. It was also encouraging that significantly fewer pathfinder families reported having too little information about services (41 per cent compared to 57 per cent of comparison group families), although 41 per cent still reported not having enough information emphasising the importance of the local offer.
Pathfinder families were more satisfied with the services that they received, with the difference appearing to reflect improvements in education services.
Our sub-group analysis showed no discernible differences in reported impacts across a range of groups, suggesting that the pathfinder EHC Plan is achieving similar results across the full range of families with whom it is being used.
Change in families’ perceptions of the processes
Pathfinder families reported noticing a difference in the process. Half (54 per cent) felt that the quality of the support services they were now receiving was better than it was before. Only a third (36 per cent) of comparison group families felt the same. They also reported that the processes they had been through were more straightforward (40 per cent versus 14 per cent); that services were working more closely together (39 per cent versus 23 per cent).
15
That said, on each of the measures above, between a third and a half of pathfinder parents said that what they had experienced under the EHC Plan was the same as before. This reflects both that many families were often satisfied with the service they received previously and that the pathfinders are continuing to refine and develop their approaches. As changes are made some more families may notice a difference / become more satisfied in future.
Outcomes experienced
To date, we have found no consistent statistical evidence of the pathfinder approach having had an impact on wider child and parent outcomes. This could be because the impacts are fairly small and our sample sizes are too small to detect them; the survey may have taken place too early for impacts to have occurred; or it may be that changes to the process will not significantly impact on outcomes.
There were examples of impact through the qualitative work. However, these were not substantiated through the survey. The examples included: where the plan had facilitated a transition from one school to another; when children were given new or increased support from specialist professionals which could improve their development and educational performance; and where families improved their quality of life as a result of increased respite care.
Whether or not a participant could identify an outcome appeared to be influenced by: whether the plan had led to any changes in their service or support provision; how recently the plan had been finalised; and the timing of services/support outlined in the plan (some changes were not due to begin until later).
Staff work and satisfaction
The majority of the 137 key workers that took part in the survey were drawn from education-related services. Most reported having had only ‘light involvement’ with the pathfinder, which was defined as 25 per cent or fewer of their cases being pathfinder-related.
Reported net change across the five categories of job-related statements - organisational support, decision influence, cross working, physical demand and psychological demand – tended to be small (between -3.1 per cent and 3.1 per cent), suggesting little change. In all but one case (cross working) the net difference was slightly negative, perhaps
16
Despite the general feeling of increased job-related pressures, it was encouraging to find that choice and control for families, collaborative working with adult social care and the Voluntary and Community Sector (VCS), and access to appropriate support from wider services were all reported to have improved in aggregate.
Key workers were largely supportive of the new approaches as they were likely to bring about a more family-centred and multi-agency way of working. However, substantial workforce development and cultural change were still reported to be required.
Indicative costs of reform
The median estimated total cost per area was £333,018 over the first 18 months of the pathfinder, including both financial and in-kind expenditure. However this varied
substantially by area, from a minimum of £205,138 in one area to a maximum of £559,149 in another.
17
1: Introduction
This report is the second of two volumes containing the evaluation findings from the first 18 months of the SEND Pathfinder Programme. The two volumes cover:
The Impact Evaluation, which provides an assessment of the experiences, outcomes achieved and distance travelled by the initial cohort of participating families, an analysis of the extent to which working practices have changed for the staff/individuals that have worked directly with participating families to deliver the process, and an indicative assessment of the costs of the reforms – these issues are contained in this volume
The Process and Implementation Evaluation, which describes the progress made by the pathfinder areas, the approaches adopted to deliver the pathfinder, what
SUMMARY
This report is the second of two volumes containing the evaluation findings from the first 18 months of the Special Educational Needs and Disabilities (SEND) Pathfinder Programme.
This volume covers the impact evaluation, which describes and analyses the:
Experiences, outcomes and distance travelled by the initial cohort of participating families
Extent to which working practices have changed for staff/individuals that have worked directly with these families
Indicative assessment of the costs of the reforms.
The process and implementation evaluation, which describes and analyses the approaches adopted to deliver the new processes and should be read in conjunction with this report was published in June 2013.
18
has worked well and less well and emerging lessons – this report was published in June 20133.
The SEND pathfinder programme
The initial 18 months of the SEND pathfinder programme sought to explore how to reform the statutory SEN assessment and statement framework, as a means of:
Better supporting life outcomes for children and young people Giving parents confidence by giving them more control
Transferring power to professionals on the front line and to local communities4.
The pathfinder programme involved the development and delivery of alternative approaches that could enhance or replace the existing system. Each pathfinder was tasked to develop and trial an assessment process; a single, joined up ‘Education, Health and Care Plan’ (hereafter referred to as the EHC Plan); and personal budgets across education, social care and health, and adult services as appropriate for children and young people from birth to 25 years. In addition, the programme explored how best to utilise and build the skill and resource of families and the voluntary and community sector (VCS), and the development of a local service offer.
Twenty pathfinder sites5, comprising of thirty-one local areas were commissioned to run from October 2011 to March 2013. Each pathfinder area was grant funded to deliver local activities and was made up from the relevant local authorities, NHS agencies and a range of partners from the VCS, parent-carer groups, colleges and schools.
An introduction to the evaluation
The aims of the evaluation, as set out in the Terms of Reference (ToR), were to establish whether the pathfinders:
Increased real choice and control, and improved outcomes for families with disabled children and young people and those who have special educational needs
3
https://www.gov.uk/government/uploads/system/uploads/attachment_data/file/206486/DFE-RR295.pdf
4
Department for Education (July 2011) Pathfinder Specification and Application Pack
5
19
Made the current support system for disabled children and young people and those with SEN and their parents or carers more transparent, less adversarial and less bureaucratic
Introduced greater independence into the assessment process by using the voluntary sector
Demonstrated value for money, by looking at the cost of reform and associated benefits
Were effectively supported by the pathfinder support team.
The methods adopted to undertake the evaluation are set out in summary in Annex A of this report. More detail on the specific methods used to undertake the impact element of the evaluation can be found in the associated technical report.
Contents of the report
This report presents:
Commentary and analysis of the parent-carer survey to illustrate the experiences, outcomes and distance travelled by the initial cohort of participating families, with further analysis tables set out in Annex B
Feedback from the qualitative research that was conducted with families from a sub-set of eight of the pathfinder areas, with additional individual family case studies included in Annex C
Commentary and analysis of the staff work and satisfaction survey, which was undertaken in two waves – a baseline and follow-up – to provide an account of the extent to which the working practices of the staff/individuals who had supported families through the pathfinder process had changed relative to the existing system
20
2: An introduction to the impact study and the
supplementary qualitative family research
The impact study
The impact of the pathfinder programme on parent and child/young person’s outcomes has been measured using a quasi-experimental design. That is, outcomes for parents and children/young people going through the programme have been compared to
outcomes for a matched comparison group of similar parents and children/young people going through existing, non-programme systems. Wherever outcomes differ significantly between programme families and comparison families we have taken this as evidence of a programme impact. Data on outcomes for both groups were collected via a telephone survey of parents.
In subsequent chapters we describe the findings from the impact study. In advance of that we summarise here the design of the impact study in terms of the sampling and
SUMMARY
The impact of the pathfinder programme on outcomes has been measured by
comparing self-reports of those outcomes for 237 pathfinder families with self-reports from a matched comparison group of 226 families. The data was collected from parents via a telephone survey.
A range of outcome measures were collected, covering
Experiences of the assessment and support planning process (reported on in Section 3)
Experience of the delivery of services (Section 4)
Self-reported change (Section 5)
Child outcomes (such as health and well-being) (Section 6)
Parental/family relationship outcomes (Section 6).
The 237 pathfinder families covered children of a wide range of ages, educational settings, and service receipt.
21
analysis methods, with the full technical details being included in the accompanying technical report.
The quasi-experimental design
The design used for the impact study was pragmatic and differed from area to area depending on what was most feasible and practical in that area. Areas contributed in one of three different ways:
1. In most non-case study areas, survey interviews were conducted, and outcome data collected, just on pathfinder families
2. In six of the ten in-depth case-study areas6 and four non-case-study areas,
comparison families were recruited in parallel with pathfinder families. In two areas this was achieved by identifying eligible families and randomly assigning the
families to the two groups. In the other areas the comparison families were identified and recruited separately, but with efforts made to ensure a degree of similarity between the two groups
3. In the other four in-depth case-study areas, a before-after approach was adopted. That is families were interviewed before starting the pathfinder to establish their outcomes under the non-pathfinder system. The same families were then
interviewed again after participating in the pathfinder to establish their ‘pathfinder-related outcomes’.
Overall 325 pathfinder and 258 comparison families were recruited and became eligible for the survey interview within the evaluation data collection period (15 May 2012 - 19 May 2013). The survey was conducted by telephone, and interviews were achieved with 237 pathfinder families (a 73 per cent unadjusted response rate7) and 226 comparison families (an 88 per cent unadjusted response rate). Of the 226 comparison interviews, 142 were ‘before’ interviews. In all instances a parent or carer was interviewed.
Pathfinder families were interviewed 9 to 17 weeks after their single plan was signed off, with the median interval between single plan and interview being 11 weeks. The timing of the interview for comparison families by necessity varied: for ‘before-after’ families, the ‘before’ interview took place just before the start of the single plan process; for parallel comparison families the interviews took place around 8 months after recruitment.
The technical details for the survey can be found in the accompanying technical report.
6
Ten pathfinder areas participated in the in-depth strand of the evaluation (see Annex A and the separate technical report for more details).
7
22
Matching to improve comparability
The pragmatic nature of the selection of comparison families does introduce some risk of bias in the impact study, in the sense that the comparison families may not, in aggregate, be as similar as is desirable to pathfinder families and, consequently, the outcomes for the comparison group may not give an unbiased estimate of the counterfactual (the ‘counterfactual’ being the outcomes that would have been achieved by the pathfinder families in the absence of the programme). We have, however, included a number of checks for bias and are reasonably sure that, if there is bias, it is low. Over and above the efforts made to recruit ‘similar’ families, the main strategy we have used for bias minimisation is propensity score matching. We have also carried out a range of sensitivity checks to ensure that the impact estimates remain broadly the same irrespective of the source of the comparison sample – these checks are described in the technical
appendix.
As noted above, the two groups for whom we have survey outcome data (pathfinder and comparison) were selected to ensure a reasonable level of similarity between them. In the case of the before-after families this ‘similarity’ is implicit, but for areas where a parallel comparison group was recruited, care was taken to ensure the comparison families had similar characteristics in terms of factors such as age of child and type of school attended. The survey interview and evaluation monitoring system also collected data on a range of parent, child and household characteristics. Responses to these questions have been used to (propensity score) match the survey respondents in the comparison group to the pathfinder group so that, across this range of characteristics at least, the two groups are demonstrably very similar. The characteristics collected cover:
Child characteristics - age and gender
Nature of condition/disability; impact of that condition/disability on day-to-day life (parental report)
School type
SEN status
Receipt of services (educational support, social care, specialist health care)
Parent characteristics: employment status, social grade, highest qualification level
23
The details of the matching are included in the accompanying technical report.
Outcome measures
The telephone survey included a wide range of outcome variables which have been used to measure the short-term impact of the pathfinders. Table 1 sets out the broad
categorisation that has been used throughout the report.
Table 1 Categorisation of the outcomes
Category Outcomes
1. Experience of the
assessment and support planning processes
Understanding of the process/decisions
Whether processes were child/young person-centred/family-centred
Whether assessment and support planning process was joined up
Perceived fairness of decisions about support
Whether processes put burden on families
Satisfaction with process 2. Experience of the delivery
of services
Choosing support services
Whether child/young person gets support needed
Satisfaction with services 3. Child/young person’s
outcomes
Parent-reported health
Quality of life
Social contact and independence
24
Category Outcomes
Experience of education
Post-16 aspirations 4. Parental/family
relationship outcomes
Self-reported health
Control over daily life
Quality of life
Family organisation/home chaos
Source: Pathfinder evaluation team
We report on the first two sets of outcomes in chapters 3 and 4. We address the question of whether, and where, the pathfinder has had an impact on families’ experience of the process of applying for and getting support. We use the family outcomes (child/young person, parent, family) in Section 6 to see whether, in the short-term, the pathfinders have had an impact on the day-to-day lives of families and their feelings of well-being.
Interpreting the impact tables of chapters 3-6
The tables in chapters 3-6 each present three columns of data: the percentage or mean responses of the pathfinder group (first column); the percentage or mean responses of the matched comparison group (second column); and the estimate of impact (that is, the difference, in percentage point terms, between the first two columns of data) (third
column). Percentages are rounded to the nearest whole per cent. Due to this, table columns do not always total 100 per cent. Also, the percentage point differences are rounded to the nearest whole per cent. However the differences between the
percentages in the first and second columns are calculated using percentages to several decimal points8. The tables provide un-weighted bases.
The p-value is the indicator of statistical significance – it represents the probability that the observed difference between the responses given by the two groups could have appeared just by chance if the impact of the programme was actually zero. In other words, the p-value tells us whether we can be confident that any differences we see in the outcomes of the pathfinder and comparison groups are likely to be attributable to the
8
25
effect of the pathfinder, rather than just differences that could have happened by chance in our two samples.
We have taken a p-value of 0.05 or less as a marker for ‘statistical significance’ – this being the default for most studies. For any impact with a p-value of 0.05 or less we can be at least 95 per cent confident that the impact is genuinely different to zero9. Put another way, if the p-value is 0.05 or less, we know that there is a very high probability that the difference observed between the samples is genuine and not ‘random noise’ in the data. Impacts with a p-value of 0.05 or less are shown in the tables with two
asterisks. However, given our relatively small sample sizes per group may depress the chances of identifying statistically significant differences, we also mark p-values of more than 0.05 but less than 0.10 with a single asterisk. For these, we can be at least 90 per cent confident that the impact is genuinely different to zero. Although differences with p-values of between 0.05 and 0.1 represent weaker evidence of impacts, we have tended to comment on them in this report as ‘significant’. This is because, where they occur, these differences tend to be consistent with the other impacts we have found for which the evidence is stronger. So the risk of our presenting an artificially positive picture by including these as ‘significant’ is relatively small. We do however, always point out in the text where the p-value is greater than 0.05.
Characteristics of the pathfinder families in the impact study
Below we present the outcomes for pathfinder and matched comparison families, together with our estimates of impact. As context for that we include here a brief
summary of the profile of the 237 pathfinder families included in the impact study across a range of the variables used in the matching exercise.
In summary:
The children and young people in the pathfinder outcome survey sample were well distributed in terms of age (17 per cent under 5; 20 per cent aged 17 and over)
70 per cent were male
43 per cent were in a mainstream school; 32 per cent were in a special school
63 per cent had a statement of special needs
27 per cent of interviewed parents described their child’s/young person’s health condition or disability as profound or complex
9
26
Just 16 per cent of the interviewed parents were in full-time work
37 per cent of the interviewed parents had level 4 qualifications or higher
30 per cent of the interviewed parents did not live with a second parent/guardian of the child.
Further details are provided in Table 2 (Similar profile statistics for the comparison families are included in the accompanying technical report.).
Comparison of the survey and population profiles (see chapter 4 of the Process and Implementation Evaluation Report10) illustrates that those aged 0-5 years were under-represented and, those in mainstream school and those with an SEN statement were over-represented in the survey sample. Therefore, the survey profile only partially reflects the profile of all pathfinder families that were recruited during the evaluation period. This is likely to be the result of only being able to include those who had a single plan signed off and the sign off date recorded on the evaluation monitoring tool before 5th March 2013 in the survey.
Sub-group analysis of the survey data (see chapter 4 for more details) illustrated that the pathfinder approach appeared to achieve similar results across the full range of families. This implies that the survey analysis largely reflects the experiences of the population.
10
27
Table 2 Profile of pathfinder families in the impact study
Pathfinder families Pathfinder families
% %
Age of child: Responding parent’s employment
status:
Under 5 17 Working full-time 16
5 to 7 19 Working part-time 33
8 to 10 15 Unemployed 5
11 to 13 14 Other not working 44
14 to 16 14 Student 1
17 and over 20 Other 2
Gender: Responding parent’s social grade:
Male 70 A 3
Female 30 B 17
C1 35
Impact of condition/disability C2 16
on day-to-day life D 10
Mild 7 E 18
Moderate 28
Severe 36 Responding parent’s highest
Profound or complex 27 qualification level:
Don’t know 1 Level 4 or above 37
Level 3 16
Educational setting: Level 2 16
Early Years 9 Below level 2 8
Special school 32 No qualifications 12
Mainstream school College
37 6
Unknown 10
Other/none 16
Number of parents in household
SEN/School Action plan: One 30
SEN 63 Two or more 70
Action plan/not SEN 33
Neither 4 Number of children under
18 in household:
Services in receipt of: 0 7
Special education 90 1 31
Social care 53 2 38
Specialist health 46 3 or more 24
Base: 237
28
The qualitative family research
A series of 46 family-based case studies were undertaken with families from a sub-set of eight pathfinder areas, following completion of the parent-carer survey. This
complementary research sought to build on the topics explored in the parent-carer survey to provide a more detailed understanding of the experiences of and outcomes achieved by families that had participated in the pathfinder. The following topics therefore formed the focus of the case studies, which were largely undertaken as face-to face in-home interviews, with a small minority (5 out of the 46) undertaken over the phone:
Learning about the family and their child or young person Assessments and plans before the new system
Getting involved in the pathfinder The assessment process
The support planning process The content of the plan
How the plan was working.
The findings of this element of the research are presented alongside the findings from the parent-carer survey as a means of fleshing out the story. Additional family case studies are presented in Annex C.
We have extracted a series of quotes from these interviews, to illustrate key points. These are presented anonymously.
Characteristics of the pathfinder families in qualitative research
The children and young people that took part in the family case studies had a wide range of additional support needs varying in severity and complexity. Many had multiple
conditions and some children/young people remained undiagnosed at the point of interview. When asked to describe their child’s additional needs and characteristics:
Approximately one third of participants described their child as having a learning disability only (14)
Just under a quarter had a learning disability and a physical disability (11)
Smaller numbers had autism only (8), a physical disability only (6), or autism and a learning disability (4)
29
The sample largely consisted of children and young people identified as White British (36) compared to 8 identified as belonging to Black and Minority Ethnic Groups including Asian, Black African, Mixed Ethnicities, White Other and two unspecified.
Summary
The impact of the pathfinder programme on parent and child outcomes has been measured using a quasi-experimental design. That is, outcomes for parents and young people going through the programme have been compared to outcomes for a matched comparison group of similar parents and young people going through existing, non-programme systems. Wherever outcomes differ significantly between non-programme
families and comparison families we have taken this as evidence of a programme impact. Data on outcomes for both groups were collected via a telephone survey of parent
carers.
Interviews were achieved with 237 pathfinder families (a 75 per cent unadjusted
response rate) and 226 comparison families (an 88 per cent unadjusted response rate). The two groups were matched using propensity score matching, and a range of
sensitivity analyses conducted to test for possible biases.
A range of outcome measures were collected via the survey, covering
Experiences of the assessment and support planning process (reported on in Section 3)
Experience of the delivery of services (Section 4) Self-reported change (Section 5)
Child/young people’s outcomes (such as health and well-being) (Section 6) Parental/family relationship outcomes (Section 6).
In addition, a series of 46 family-based case studies were undertaken with families from a sub-set of eight pathfinder areas, following completion of the parent-carer survey. This complementary research sought to build on the topics explored in the parent-carer survey to provide a more detailed understanding of the experiences of and outcomes achieved by families that had participated in the pathfinder.
3: Families’ experience of the process
Key findings
Pathfinder families were significantly more likely than comparison families (albeit at a 90 per cent confidence level) to strongly agree that they understood the assessment and support planning processes (38 per cent pathfinder families; 27 per cent comparison)
Families’ understanding of the process appeared to have been linked to the
competency, consistency and knowledge of the ‘key worker’ or ‘group of individuals’ that had provided them with support. The transparency of the process also appeared to be an important factor
Although three quarters (73 per cent) of comparison families agreed (strongly or tended to agree) that their family’s views had been taken into consideration, pathfinder families were even more likely to say this, with almost nine in ten (88 per cent) pathfinder
families agreeing strongly or tending to agree with the statement
Parents reported positive and statistically significant improvements in the extent they were encouraged to think about what they wanted and were listened to
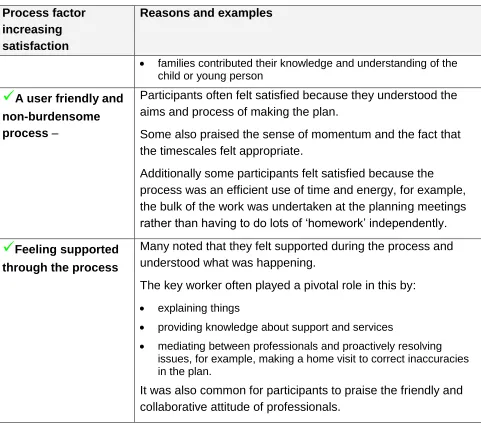
The process itself was felt to have been child/family centred in cases where
professionals had allowed time for discussions, were accessible and recognised the value of parents’ insights into their child or young person’s needs. This emphasises the importance of resourcing this process sufficiently, with well trained staff
Similarly, the outcomes of the process had an influence on how ‘at the centre’ families felt they had been
Pathfinder parents were far more likely than comparison parents to feel that the decisions made about their child’s support reflected their family’s views
Parents were not quite so positive when it came to how far their children’s views had been taken into account, suggesting an area where further workforce development may be required
Pathfinder parents were more likely to agree that the processes they had been through were straightforward compared to the comparison group
Pathfinder parents reported getting a significantly more ‘joined up’ service than those in the comparison group. However, the survey findings also highlighted there was further room for improvement in this area, perhaps reflecting cases where some services had not engaged as fully as expected
31
Parents were asked a range of questions about their experience of the assessment and support planning process. Those in the pathfinder group were asked about their
experience since they signed up for the single plan and those in the comparison group were asked about the previous 12 months.
This chapter mirrors the course of the processes that the families had been through, reporting on pathfinder families’ and comparison group families’ experiences – and on evidence of the pathfinder having had an impact on how families felt about the processes – in terms of the assessment and support planning process, namely:
Their routes into and expectations of the pathfinder
Their understanding of the process and decisions made
Whether they felt the processes were child-centred/family-centred
The role of the plan
The role of the key worker
Whether the assessment and support planning process was joined up
Their perceived fairness of decisions about support
Whether the processes placed a burden on the family
Their satisfaction with the assessment and support planning process.
Routes into and expectations of the pathfinder process
The circumstances in which parents found out about the pathfinder varied both across and within areas. This included referrals following an existing assessment, or a letter of invitation from their school or local authority and differed within and between the
pathfinder areas and age groups.
In general, across the pathfinder areas and age groups, parents understood the pathfinder to be a pilot initiative testing a new approach to planning support for their child. They hoped that participating in the pathfinder would help to:
Bring education, health and social care professionals together around their child Enable long term planning for the future. Participants who recognised this often
32
Afford parents the opportunity to have a greater say in the support planning for their child:
‘They said that my view would be taken into account, and I would know what happens step by step, that they wouldn’t do things without telling me.’ (Mum, 0-5 year old)
Few families had concerns prior to joining the pathfinder. However, a small number of parents expressed some cynicism about the process, questioning whether it would be possible to deliver such a programme, and how much of the process would need to be driven by the parent. Such comments tended to come from parents of slightly older children who were more experienced in the practical challenges present in such a process and the current squeeze on both funding and professional capacity.
‘In the group where I was one of the parents actually said, “This sounds too good to be true, what’s the catch?” And she said, “There is no catch.” Well I suppose I’m a bit more cynical because I’ve been in the system a while. But I just thought it was worth a go.' (Mum, 5-16 year old)
Nevertheless, some felt that they had nothing to lose by taking part:
‘To be honest, I didn’t know much about it but I thought, well anything that will you know, be good for [Child], then I’ll, you know I’m willing to try it’ (Parent, 0-5 year old)
Assessment and support planning process
The pathfinder process was designed and implemented differently in each pathfinder area, with differences including:
involvement of a key worker
number and type of professionals involved and the role they played whether new assessments were conducted and their format
whether existing assessments and plans were drawn on whether planning meetings took place
who wrote the plan itself
whether there was a clear distinction between assessment and support planning.
33
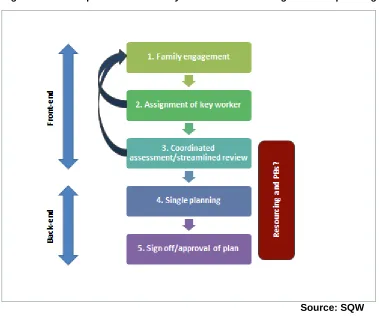
[image:33.595.105.484.157.474.2]through. However, most families had taken part in a similar set of stages, which mirrored the findings from the Process and Implementation Evaluation Report that at a high level a general model was emerging(see Figure 2).
Figure 2 The new process – summary of most common stages and sequencing
Source: SQW NOTE: The review stage does not appear in the above diagram as it had not yet been considered
Similarly, the qualitative research reinforced the Process and Implementation findings, in that:
Families rarely reported having new assessments to inform their single planning as most were in receipt of support/services prior to involvement in the pathfinder The SENStatement was commonly drawn on to inform single planning
Different models of key working were employed, where some described a single ‘key worker’ who was perceived to ‘hold’ the process and drive it forward, whilst others described being supported by a ‘group of individuals’ each of whom focussed on delivering a discrete part of the process
34
Understanding of the process/decisions
Parent carer perspective
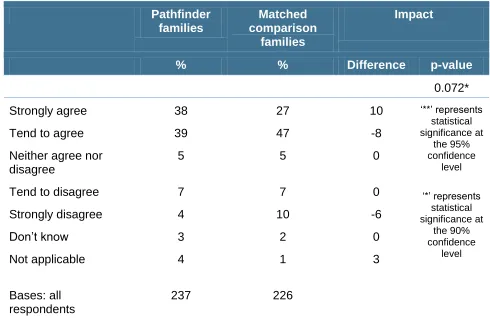
[image:34.595.48.538.233.551.2]While three quarters of families in both the pathfinder and comparison groups agreed strongly or tended to agree that they understood the processes, at a 90 per cent (rather than 95 per cent) confidence level, pathfinder families were significantly more likely to say that they agreed strongly(38 per cent compared to 27 per cent). (See Table 3.)
Table 3 Extent to which parent carers agreed they understood the processes
Pathfinder families
Matched comparison
families
Impact
% % Difference p-value
0.072*
Strongly agree 38 27 10 ‘**’ represents
statistical significance at
the 95% confidence
level
‘*’ represents statistical significance at
the 90% confidence
level
Tend to agree 39 47 -8
Neither agree nor disagree
5 5 0
Tend to disagree 7 7 0
Strongly disagree 4 10 -6
Don’t know 3 2 0
Not applicable 4 1 3
Bases: all respondents
237 226
Note: Percentage point differences are rounded to the nearest whole per cent Source: Ipsos MORI survey data
Families’ understanding of the process appeared to have been linked to the
competency, consistency and knowledge of the ‘key worker’ or ‘group of individuals’ that had provided them with support. The transparency of the process also appeared to be an important factor. For example, there were a number of parents who began the pathfinder process without a detailed understanding of its purpose, including the
35
‘It was sort of thrown at me, so I was like – she was saying all this stuff and my head was all over the place and I wasn’t like totally with it...So I was like I don’t understand any of this.’ (Mum, 5-16 year old)
Similarly, where professionals had attended meetings with the family, participants tended to have been clear about what their role was at the meeting, especially if those
professionals were already known to the family. Conversely, where professionals had not attended meetings with the family, participants were not always sure which professionals had been involved and how. Families might either have known, assumed or thought it likely that professionals had a role ‘behind the scenes’ – submitting a report to the key worker or simply having a conversation with the key worker.
Clarity of the decision making process was not found to differ significantly between the pathfinder and comparator group. That is, pathfinder parents were not statistically
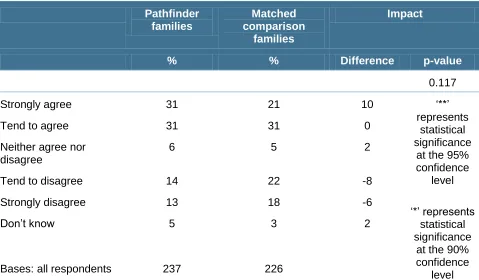
[image:35.595.57.536.383.663.2]significantly more likely to report that the decisions made about their child’s support were explained to them clearly, despite the difference appearing to be positive (62 per cent of pathfinder and 52 per cent of comparison group families agreed that the decisions were explained clearly). (See Table 4.)
Table 4 Extent to which parent carers agreed decisions were explained clearly
Pathfinder families
Matched comparison
families
Impact
% % Difference p-value
0.117
Strongly agree 31 21 10 ‘**’
represents statistical significance
at the 95% confidence
level
‘*’ represents statistical significance
at the 90% confidence
level
Tend to agree 31 31 0
Neither agree nor disagree
6 5 2
Tend to disagree 14 22 -8
Strongly disagree 13 18 -6
Don’t know 5 3 2
Bases: all respondents 237 226
36
Child/family-centred processes
Parents were asked a series of questions about (a) generally, whether their views were taken into consideration, (b) whether they were encouraged to be involved and the extent to which their views were listened to, and (c) how far their views (both parents’ and young people’s) were reflected in the support or services offered. In all but one aspect – the extent to which their child had had a say over their support and services received – pathfinder families reported significantly better experiences than the comparison families.
[image:36.595.55.537.325.650.2]Table 5 shows that although three quarters (73 per cent) of comparison families agreed that their family’s views had been taken into consideration, pathfinder families were even more likely to say this, with almost nine in ten (88 per cent) pathfinder families agreeing strongly or tending to agree with the statement. The difference is statistically significant.
Table 5 Extent to which parent carers agreed families’ views taken into consideration
Pathfinder families
Matched comparison
families
Impact
% % Difference p-value
0.003**
Strongly agree 49 32 17 ‘**’ represents
statistical significance at
the 95% confidence
level
‘*’ represents statistical significance at
the 90% confidence
level
Tend to agree 38 41 -2
Neither agree nor disagree
1 4 -3
Tend to disagree 7 14 -7
Strongly disagree 2 6 -4
Don’t know 1 2 -1
Not applicable 2 1 1
Bases: all respondents
237 226
37
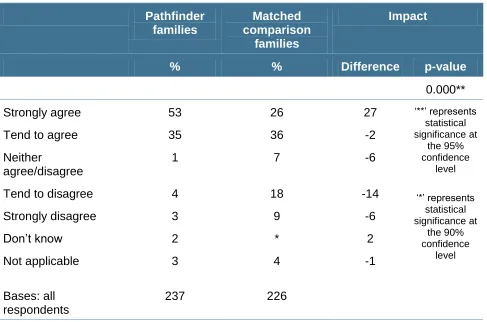
[image:37.595.54.541.181.503.2]Parents also reported positive, and statistically significant improvements in the extent that they were encouraged to think about what they wanted and were listened to (Tables 6 and 7). Half of pathfinder families agreed strongly with both of these statements, compared to a quarter of comparison group families.
Table 6 Extent to which parent carers agreed that they were encouraged to think about what wanted
Pathfinder families
Matched comparison
families
Impact
% % Difference p-value
0.000**
Strongly agree 53 26 27 ‘**’ represents
statistical significance at
the 95% confidence
level
‘*’ represents statistical significance at
the 90% confidence
level
Tend to agree 35 36 -2
Neither
agree/disagree
1 7 -6
Tend to disagree 4 18 -14
Strongly disagree 3 9 -6
Don’t know 2 * 2
Not applicable 3 4 -1
Bases: all respondents
38
Table 7 Extent to which parent carers agreed their suggestions were listened to
Pathfinder families
Matched comparison
families
Impact
% % Difference p-value
0.001**
Strongly agree 48 26 22 ‘**’ represents
statistical significance at
the 95% confidence
level
‘*’ represents statistical significance at
the 90% confidence
level
Tend to agree 37 39 -3
Neither
agree/disagree
4 7 -4
Tend to disagree 4 14 -10
Strongly disagree 3 7 -5
Don’t know 2 1 1
Not applicable 3 5 -2
Bases: all respondents
237 226
Note: Percentage point differences are rounded to the nearest whole per cent Source: Ipsos MORI survey data
In the qualitative research, the majority of parents felt that their experience had been child- or family centred and this was most commonly attributed to parents’ interactions with professionals. The process itself was felt to have been child- or family-centred in cases where professionals had allowed time for discussions, were accessible and recognised the value of parents’ insights into their child or young person’s needs. For example two parents commented as follows:
‘I feel that they all seem to be wanting to help and to make- To support us, not just with him at the school, but to support us as a family and at home with him.’ (Dad, 5-16 year old)
‘It was good because our opinion was always, you know, that was the first thing in the meetings that we had. It was how things are going, and any concerns that we had with [Child] and so on.’ (Mum, 5-16 year old)
In addition to the character and tone of the interactions between parents and
39
first person voice for the child or young person (for example, ‘My name is [Child], I like playing in my garden, I don’t like loud noises or crowded places, I need help with…’).
‘It’s quite a holistic document really, because it also incorporates - very much so - the parents’ views, what we feel about [Child] and what he needs and how we’re dealing with the situation here and now, and you’ll find that that’s in there as well, how we deal with the situation, and how does our daughter respond to [Child].’ (Mum, 5-16 year old)
Families also generally felt it was more centred around them when they could have a say on the process, for example saying which professionals should be involved, seeing a draft of the plan and commenting on it.
Further findings from the survey found that pathfinder parents were far more likely than comparison group parents to feel that the decisions made about their child’s support reflected their family’s views (Table 8). Four in ten (38 per cent) pathfinder families said ‘a great deal’, twice as many as in the comparison group (21 per cent). Conversely, comparison group families were twice as likely as pathfinder families (29 per cent compared to 14 per cent) to say that decisions did not reflect their views ‘very much’
[image:39.595.52.537.395.667.2]or ‘at all’. These differences are statistically significant.
Table 8 Extent to which parent carers felt decisions supported families’ views
Pathfinder families
Matched comparison
families
Impact
% % Difference p-value
0.002**
A great deal 38 21 17 ‘**’ represents
statistical significance at
the 95% confidence
level
‘*’ represents statistical significance at
the 90% confidence
level
A fair amount 38 47 -9
Not very much 11 22 -12
Not at all 3 7 -4
Don’t know/can’t remember
10 2 7
Bases: all respondents
237 226
40
Families added that the outcomes of the process had had an influence on their perceptions of how child or family-focused the resultant plan had been, i.e. the degree to which the plan was enabling their needs to be met. For example:
Where children or families were receiving support or services as a result of the plan, and where these were making a positive difference to their lives, then
participants saw this as evidence that the process was centred around their needs Participants also felt this way when they were not seeing outcomes as yet, but
were expecting to do so (e.g. they had been promised a referral to a service, then received the referral letter, and expected that the service would meet their needs once they started using it)
Where the plan tended to focus more on the description of the child or young person, rather than on translating this into proposed actions, parents were less likely to feel that it was centred around their needs
If actions were identified in the plan but there was no evidence that these were underway or parents were having to chase to get things done, this also made them less likely to feel they were ‘at the centre’ of the process.
The extent to which participants felt at the centre of the process did not appear to vary much by pathfinder area. Although where the process had led to few or no outcomes, there was a general consensus that participants felt that they were listened to and involved. Even where parents could detect few or no outcomes that had occurred, participants nonetheless often felt that they had been listened to and involved in the process.
In addition, how parents felt about the degree of their involvement in assessment and planning depended on what they saw as the purpose of the plan, the complexity of the child or young person’s needs and to what extent the parent was generally engaged or capable of engaging in their child or young person’s care. For example:
Parents who felt, based on their own observations or on previous advice from a professional, that their child or young person needed a particular assessment (e.g. an educational psychology assessment) or an increase in a type of service (e.g. more hours of speech and language therapy) felt happy to have the opportunity to request the inclusion of this in the plan
Parents who felt that their child or young person was not doing well but did not know what services might help them to improve felt unable to say ‘what they
needed’
41
Parents who understood it to be a ‘live’ plan obliging professionals to deliver on the actions within it felt more concerned about having proper professional assessments to underpin it.
Child and young person perspective
Parents were not quite so positive when it came to how far their children’s views had been taken into account. Only a third (34 per cent) of pathfinder and comparison group families said that their child had had a say over the support and services he or she receives, with no significant impact of the pathfinder (Table 9). Nevertheless, pathfinder parents were significantly more likely than comparison group parents to report that their child’s wishes were taken into account about the services and support they receive (Table 10).
The discrepancy between these two findings may reflect the more active involvement of children ‘having a say’ over their wishes being taken into consideration. (Note, up to a third of parents said that these questions were not applicable, either because of their child’s age or disabilities.) Findings from the qualitative research supported this as they found that the majority of children and young people had not been directly involved in the process, because they were too young or the nature of their disability meant they were not able to participate. However, for those who had, parents were generally pleased that this opportunity had been offered, and many parents whose children were not able to participate commented that they thought it would be positive to include children and young people where possible.
'That’s another thing that made me feel good as well, because they were actually directly asking [Child] questions - how she was, how she got on. I think it makes them feel
involved. It makes – you know, and actually as well to let them know what’s going on. And for them to have an understanding as well, although [she] might not have
42
Table 9 Extent to which parent carers agreed young person had a say over support
Pathfinder families Matched comparison families Impact
% % Difference p-value
0.136
Strongly agree 16 9 7 ‘**’ represents
statistical significance at the 95% confidence level ‘*’ represents statistical significance at the 90% confidence level
Tend to agree 18 23 -6
Neither
agree/disagree
5 3 2
Tend to disagree 12 15 -3
Strongly disagree 9 14 -5
Don’t know 5 1 3
Not applicable 36 34 1
Bases: all respondents
237 226
Table 10 Extent to which parent carers agreed young person’s views were taken into account
Pathfinder families Matched comparison families Impact
% % Difference p-value
0.026**
Strongly agree 24 14 10 ‘**’ represents
statistical significance at the 95% confidence level ‘*’ represents statistical significance at the 90% confidence level
Tend to agree 24 25 -1
Neither
agree/disagree
4 7 -3
Tend to disagree 6 11 -4
Strongly disagree 6 14 -8
Don’t know 4 1 2
Not applicable 32 28 4
Bases: all respondents
237 226
43
The role of the plan
There were four broad categories of content in the plan: information about the child or young person; service and support currently receiving or required; outcomes and goals; actions to achieve outcomes.
The formatting and level of detail varied. Plans used a number of approaches to structure the information e.g. key headings, photos, action plans set out in tables, and use of the first person. Most participants felt that the plan was written in plain English and easy to navigate. Not all participants were clear about the purpose of the plan but nearly all felt that it provided useful information for new professionals or carers meeting a child or young person, and that it would help professionals to understand the child’s needs, build a rapport with them and deliver services more effectively.
Some families viewed it as a ‘framework’ for delivering a more joined up and holistic package of care, which would variously: lead to more thorough assessments and support planning; help to plan for the future and articulate goals; provide a ‘reference document’ describing care and support in place, or to help track progress against goals; be an evolving and regularly updated picture of the child or young person’s development; support smooth transitions (from primary to secondary school or from children’s to adults services).
It was common for plans to be used by professionals to provide care and support which was more in line with families’ needs and development goals. Often actions had been taken around a specific development-focussed goal, such as developing skills related to independence. Less commonly, plans had been used to access new and additional services and support, sometimes focussed on the whole family e.g. increased respite hours.
There were examples where the plan had helped professionals to align their care and establish better joint working practices; where participants used the plan to monitor their child’s progress against goals; and where the plan was used to hold professionals to account to deliver services.
‘I kept quite a close tab on them and if something wasn’t happening then I would email [our key worker] and CC in whoever was necessary just to say this hasn’t happened, can we have a timeline?’ (Mum, Area K, 0-5)