1 / 29
Shakedown analysis of elastic-plastic structures considering the effect of
1temperature on yield strength: theory, method and applications
2Heng Peng
1, Yinghua Liu
1,*, Haofeng Chen
2 31Department of Engineering Mechanics, AML, Tsinghua University, Beijing 100084, People’s Republic of China
4
2Department of Mechanical and Aerospace Engineering, University of Strathclyde, Glasgow G1 1XJ, UK
5
*Corresponding author: [email protected]
6
ABSTRACT 7
According to the extended Melan’s static theorem, theoretical and numerical aspects of the stress compensation 8
method (SCM) are presented to perform shakedown analysis of elastic-plastic structures considering the effect 9
of temperature on yield strength. Instead of constructing a mathematical programming formulation, this 10
developed method consists of the two-level iterative scheme. The inner loop constructs the statically admissible 11
self-equilibrating stress field, while the outer loop evaluates a sequence of decreasing load factors to approach 12
to the shakedown limit multiplier. The yield strength considering temperature effect is updated based on the 13
current temperature at each outer iteration, and the yield conditions are checked at all Gauss points. The 14
numerical procedure is well incorporated into ABAQUS finite element code and used for calculating the 15
shakedown limits of structures considering yield strengths as different functions of temperature under complex 16
thermomechanical loading system. The method is validated by some plane stress and axisymmetric numerical 17
examples with theoretical and numerical solutions, and subsequently applied to solve the practical shakedown 18
problem of a pipe with oblique nozzle. The results demonstrate that the developed method is stable, accurate 19
and efficient, and can effectively evaluate the shakedown limit of an elastic-plastic structure where the yield 20
strength of material varies with temperature. 21
Keywords: shakedown analysis; effect of temperature; yield strength; stress compensation method; 22
thermomechanical loading 23
1. Introduction
24
In modern engineering design standards and codes, such as EN 13445-3 and ASME VIII-2, the plastic failure 25
2 / 29
made of ductile materials. More pressure vessels and pipes, equipment of nuclear reactors and economic steel 27
structures under variable thermal and mechanical loads are designed with checks against ratcheting (or 28
incremental plastic collapse) and alternating plasticity (or local low-cycle fatigue) (Staat and Heitzer, 2003). 29
Instead of limiting the behavior of structural elements or components to the elastic range, these design codes 30
allow some limited plastic deformation provided the structures shake down to the elastic behaviorafter some 31
load cycles. Therefore, for these structures under repeated variable loads, shakedown limit is a significant design 32
parameter to engineers. The shakedown analysis just aims to determine the allowable load range, within which 33
the structure will not failure due to the ratcheting or the alternating plasticity (König, 1987). 34
Shakedown problems have attracted extensive attentions of academic researchers and engineers in fields of 35
mathematics, material, mechanics, and structural engineering (Maier, 2001; Stein et al., 1993; Ponter and Carter, 36
1997a, b; Zarka, 1980; Ponter and Chen, 2001; Chinh, 2005; Liu et al., 2005; Polizzotto, 2008; Simon and 37
Weichert, 2011; Zouain et al., 2002; Casciaro and Garcea, 2002; Chen et al., 2011; Nguyen-Xuan et al., 2012; 38
Spiliopoulos and Panagiotou, 2014; Peigney, 2014; Ponter, 2016; Do and Nguyen-Xuan, 2017; Cho and Chen, 39
2018). However, it is still difficult to implement shakedown analysis well for practical complex engineering 40
structures in design process. One difficulty remains in how the shakedown theorem meets the actual engineering 41
conditions (Weichert and Ponter, 2014). The classical Melan-Koiter shakedown theorems (Melan, 1938; Koiter, 42
1960) rest on the assumption of temperature-independent material property. However, many structural elements 43
and components in nuclear and power producing plant usually work in high and variable temperature 44
environment, and thus the temperature has large effects on some material parameters, especially on the yield 45
strength. The shakedown analysis is complicated when temperature effect on material property is taken into 46
consideration. Another difficulty is the computing tool for solving large-scale complex shakedown problems. 47
One approach for determining the shakedown limit is to simulate some cyclic responses of elastoplastic 48
structures under some cyclic loading processes with different load levels via the incremental finite element (FE) 49
analysis (König, 1987). However, these step-by-step procedures cause a high calculating cost for actual 50
engineering structures, since the steady cyclic state usually achieves after many load cycles. The direct method 51
(Maier, 2001; Weichert and Ponter, 2014), as a better alternative, can be efficiently used for straightforward 52
calculation of the shakedown limit just with knowledge of the bounding box of cyclic loads rather than the 53
detailed loading history. 54
Many researchers have investigated the shakedown analysis considering the temperature-dependent material 55
3 / 29
theorem was extended to include the variation of the yield strength with respect to temperature (Prager, 1956; 57
Borino, 2000), where the constant residual stress field is required to be found. Although the static shakedown 58
theorem considering the temperature-dependent yield strength was established, allowing the elastic moduli to 59
vary with temperature has been recognized to be a difficult and challenging problem where the proof of Melan’s 60
theorem is violated (Halphen, 2005; Hasbroucq et al., 2010). Recently, Hasbroucq et al. (2012) presented a static 61
shakedown theorem with temperature-dependent elastic moduli, which enounces that the constant residual stress 62
field should be replaced by a constant plastic strain field. The residual stress field changes during the cycle due 63
to the varying elastic moduli. The proof of this shakedown theorem and some theoretical results for a simple 64
bar structure were given in Peigney (2014). In general, although some basic properties of engineering materials 65
are all temperature-dependent, the temperature has more significant effects on the yield strength than on other 66
material parameters, such as thermal expansion coefficient, Young’s modulus and Poisson’s ratio. For an 67
ordinary high-temperature steel, there exists about 35% reduction of yield strength when its temperature 68
increases from 20℃ to 350℃. Therefore, it is very significant to present some theorems and efficient direct
69
methods to solve the practical complex shakedown problem considering the temperature effect on yield strength 70
of material. 71
Since Prager (1956) extended the classical static shakedown theorem of Melan to cover thermal loads and 72
materials with the consideration of temperature effect on yield strength, some relevant studies have been 73
reported (Naghdi, 1960; Bree, 1967; Gokhfeld and Charniavsky, 1980; Borino, 2000; Yan and Hung, 2001; 74
Heitzer, 2004; Vu and Staat, 2007). Naghdi (1960) pointed out that, for the static approach to shakedown 75
problem, the yield surface can be described by some parameters depending on the actual temperature of a 76
material point, but the yield surface must be convex and the normality law should be applied. The corresponding 77
extension of the classical Koiter’s kinematic shakedown theorem was achieved by König to consider the 78
temperature-dependent yield stress, and some simple examples were given in his treatise (König, 1987). For the 79
aspect of application, Bree (1967) proposed a classical shakedown-ratcheting (Bree) diagram to investigate the 80
elastoplastic behavior of a tube under cyclic thermal load and constant pressure, and the shakedown boundary 81
was discussed with the consideration of mean temperature effect on yield strength. A systematic presentation of 82
theorems and methods about the limit-state of structures under cyclic thermal loading were given by Gokhfeld 83
and Cherniavsky in their monograph (Gokhfeld and Charniavsky, 1980). 84
It should be noted that these extensions mentioned above just consider the ideal plastic material whose yield 85
4 / 29
that the calculated shakedown limits based on the Prager’s and König’s extended theorems cannot keep duality 87
of the upper and lower bounds if the yield stress has a nonlinear relationship with the temperature. To overcome 88
these difficulties, he established a consistent shakedown theorem under the framework of thermodynamics 89
considering the yield function convex in σ θ− space. Then, using this modified theorem, Yan and Hung (2001) 90
presented the nonlinear kinematic method, by which the upper shakedown analysis considering the effect of 91
temperature on yield strength was realized using the König’s extended kinematic theorem. Furthermore, Heitzer 92
(2004) described a general static method for temperature-dependent shakedown calculation of structures using 93
nonlinear optimization, but this method was inapplicable to the problem with constant loads. By applying some 94
restrictions to the thermal loading condition, Vu and Staat (2007) established a linearized shakedown theorem 95
where the yield stress was linearized and the shakedown analysis was formulated as a convex optimization 96
problem. 97
Although these shakedown analyses above considered the evaluation of the shakedown limit of elastic-98
plastic structure with temperature-dependent yield strength, using the mathematic programming methods, they 99
appear to address academic research and just deal with some simple structures. When a real complex engineering 100
component is considered, these shakedown analyses are translated into the tremendous optimization problems 101
which are hard to solve. Besides the mathematic programming methods, there are still some other direct methods, 102
such as the elastic compensation method (ECM) (Ponter and Carter, 1997a, b; Ponter and Engelhardt, 2000), 103
the linear matching method (LMM) (Chen and Ponter, 2001; Chen, 2010; Barbera and Chen, 2015; Barbera et 104
al., 2017) and the stress compensation method (SCM) (Peng et al., 2018), which go around the difficulty of the 105
optimization problem and are more suitable for practical engineering applications. The LMM simulates the 106
plastic behavior via a series of full elastic solutions with variable moduli in time and space to evaluate 107
shakedown limit. With no need to generate the programming formulation, the SCM just performs a sequence of 108
iterative calculations, where the global stiffness matrix is required to be assembled and decomposed only once. 109
However, this work is restricted to the classical Melan’s theorem and assumes the temperature-independent 110
material property, which could be violated when the structures undergo high and variable temperature. 111
This article mainly aims to develop an effective method to carry out the shakedown calculation of elastic-112
plastic structures with temperature-dependent yield strength under complex thermomechanical loading system. 113
The theoretical foundations, numerical procedure and practical applications of the SCM are elaborated in detail 114
to consider the linear and nonlinear temperature dependence of yield strength of material. The article is outlined 115
5 / 29
temperature effect on yield strength. Sect. 3 and Sect. 4 present the theoretical and numerical aspects of the 117
developed method for complex thermomechanical loading system, respectively. Then some analytical and 118
numerical examples are considered for the validation and application of the developed method to engineering 119
structures in Sect. 5. Finally, Sect. 6 provides some conclusions. 120
2. Extended static shakedown theorem
121
2.1. Loading history and loading domain 122
A given structure (or solid body) V is composed of material points, whose coordinate vectors can be denoted 123
by x∈V. The loading history P x
( )
,t of the structure is defined as the superposition of loading sets P xi( )
,t , 124(
1, ,)
i= N . Each loading set P xi
( )
,t is decided by the time-independent load P xi( )
and thetime-125
dependent factor µi
( )
t , that is126
( )
( )
( ) ( )
1 1
, N i , N i i
i i
t t µ t
= =
=
∑
=∑
P x P x P x (1)
127
Considering that the time-dependent factor µi
( )
t varies arbitrarily within a given range of itself:128
( )
i i t i
µ− ≤µ ≤µ+ (2)
129
where µi− and µi+ are the marginal values of the factor µi
( )
t , these N loads form a N-dimensional loading130
domain Ω, i.e., a polyhedron defined by m=2N vertices in load parameter space. If we assume V
( )
iP x 131
(
1, ,)
i= m is the vector of load vertex i, the loading history P x
( )
,t can be represented as another form:132
( )
( ) ( )
1
, m V
i i
i
t γ t
=
=
∑
P x P x (3)
133
where theses coefficients γi
( )
t , i=(
1, , m)
should satisfy the following conditions:134
( )
(
)
( )
1
0, 1, , and m 1
i i
i
t i m t
γ γ
=
≥ =
∑
≤ (4)135
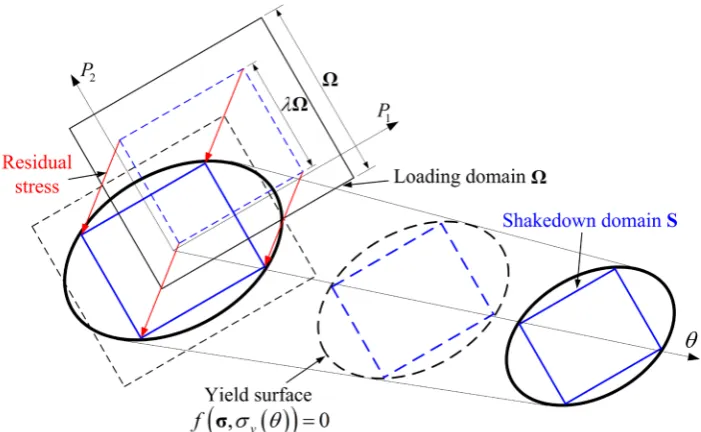
6 / 29 137
Fig. 1. Loading domain Ω and loading path. 138
Now we assume a solid body is subject to both mechanical and thermal loads as well as temperature variation 139
varying in a quasi-static process. The mechanical and thermal loads depend on a group oftime-dependent load 140
parameters
( )
,t M( ) ( )
, ,t θ ,t =
P x P x P x , where P xM
( )
,t is mechanical load set and P xθ( )
,t is thermal141
load set. P xM
( )
,t and P xθ( )
,t can vary within the given domains ΩM and Ωθ, respectively. In general, 142we assume that the given domains ΩM and Ωθ are convex polyhedrons defined by mM and mθ vertices, 143
respectively, in the load parameter space. Then P x
( )
,t will vary arbitrarily within the domain Ω, which is a 144convex hyper polyhedron containing m m= M ×mθ vertices. The time-dependent load parameters P x
( )
,t 145can also be represented as Eqs. (3) and (4). 146
Assuming that the body is fully elastic, the fictitious elastic stress σE
( )
x,t is unique to the load P x( )
,t . 147Thus, the fictitious elastic stress domain E is also a hyper polyhedron containing m vertices and can be 148
denoted as 149
( )
( ) ( )
1
, m
E V
i i
i
t γ t
=
=
∑
σ x σ x (5)
150
where V
( )
VM( )
, V( )
i = i iθ σ x σ x σ x denotes the thermoelastic stress of the body under the load sets 151
( )
( )
,( )
V VM V
i = i iθ
P x P x P x and the temperature field V
( )
iθ x . The temperature field history (or domain) 152
( )
,tθ x can be represented as 153
( )
( ) ( )
1
, m V
i i
i
t t
θ γ θ
=
=
∑
x x (6)
154
The detailed elastoplastic response of a structure under any loading history P x
( )
,t varying within the 155domain Ω can be obtained via the incremental FE analysis considering the real constitutive equations. 156
7 / 29
condition. As a better alternative, the shakedown theorem provides an effective criterion to estimate whether 158
the shakedown occurs, without the knowledge of the complete stress or strain histories (König, 1987). The 159
following section will present the static theorem of shakedown with temperature-dependent yield strength to 160
cope with the considered problem of this article. 161
2.2. Extended static theorem of shakedown with temperature-dependent yield strength 162
For an elastic-plastic body, plastic strain will occur if its equivalent stress reaches the yield strength σ θy
( )
.163
The actual stress σ
( )
x,t can be divided into fictitious elastic stress σE( )
x,t and residual stress ρ( )
x . The 164extended Melan’s theorem of shakedown for materials considering the temperature effect on yield strength states 165
as follows : a structural body shakes down to the variable repeated loading, if a constant residual stress field 166
( )
ρ x and a load multiplier λ is found, so that, for arbitrary temperature variations and loads within the 167
specified limit domains, the following relations hold: 168
( )
, E( ) ( )
, EM( )
, E( )
,( )
M
t t t θ t
θ
λ
λ λ
λ
= + = + +
σ x σ x ρ x σ x σ x ρ x (7)
169
( ) ( )
(
, , y)
(
( )
,)
y(
( )
,)
0f σ x t
σ θ
=σ
σ x t −σ λλ θ
θ xt ≤ ∀ ∈x V,∀t (8)170
where λM and λθ are the factors of mechanical stress σEM
( )
x,t and thermal stress σEθ( )
x,t , respectively;171
σ denotes equivalent stress; f
( )
⋅ denotes the yield function which is required to be convex in σ θ− space; 172and σ θy
( )
denotes the yield strength depending on the current temperature θ . The stress field ρ( )
x173
satisfies self-equilibrating condition in the body V and force boundary condition on the surface St, i.e.
174
( )
( )
in on t
V S
∇ ⋅ =
⋅ =
ρ x 0
ρ x n 0 (9)
175
where ∇ ⋅ denotes the divergence operator; and n denotes an outward normal of the surface St.
176
Fig. 2 presents a geometric illustration of static theorem of shakedown considering the temperature effect 177
on yield strength. The key idea is to place the loading domain Ω into the geometric space formed by yield 178
condition for all loads and temperatures. The loading domain can be enlarged or shrunk by multiplying a factor 179
λ. The maximum allowable value of the factor λ is shakedown multiplier. It is worth emphasizing that, both 180
fictitious elastic stress domain and yield condition consider the effect of temperature variation, thus the domain 181
8 / 29 183
Fig. 2. Geometric illustration of static shakedown theorem considering the temperature effect on yield 184
strength. 185
According to some recent studies (Borino, 2000; Yan and Hung, 2001; Heitzer, 2004; Vu and Staat, 2007) 186
on the shakedown theorems for material considering the temperature effect on yield strength, theoretically, the 187
yield function f
( )
⋅ is required to be convex in σ θ− space. In general, this is not difficult in most cases. 188For the convexity of von Mises yield function, this requirement can be easily satisfied if yield stress σ θy
( )
is189
restrict to be concave or linearized with respect to temperature θ . In fact, lots of metal alloys meet this 190
requirement of the concavity of σ θy
( )
for a wide temperature range. Besides, even if the function between191
yield stress and temperature is convex, the piecewise linearization of yield stress function versus temperature 192
turns out to be a particularly useful approach (Vu and Staat, 2007). In this work, the piecewise linearization of 193
the yield stress function versus temperature can be easily carried out by partitioning the temperature range into 194
some sub-ranges, just resulting in the increase of the number of vertices mθ. 195
3. Theoretical aspect of the SCM with temperature-dependent yield stress
196
We suppose that an elastic-perfectly plastic material obeys the von Mises yield criterion with associated 197
flow rule. To investigate the temperature effect on shakedown problem, the yield strength of material is 198
considered temperature-dependent. 199
The strain rate ε
( )
t can be divided into five parts:200
( )
EM( )
E( )
( )
e( )
p( )
M r
t t θ t t t t
θ θ θ
λ λ
λ
λ
= + + + +
ε ε ε ε ε ε (10)
9 / 29
where εEM
( )
t and εEθ( )
t are the strain rates of a body under the elastic mechanical stress rate σEM( )
t and202
thermal stress rate σEθ
( )
t , respectively;( )
t( )
t θ =αθε I is the strain rate due to thermal expansion; e
( )
r t
ε is 203
the residual elastic strain rate which is induced by the the residual stress; and εp
( )
t denotes the plastic strain204
rate. 205
According to the constitutive law, the stress and strain have the following relation expressions: 206
( )
( )
E t = ⋅ E t
σ D ε (11)
207
( )
e( )
r
t = ⋅ t
ρ D ε (12)
208
where D denotes the elastic stiffness matrix. 209
For the FE analysis, the strain rates ε
( )
t of an element are related to the nodal displacement rates u( )
t . 210( )
t = ⋅( )
tε B u (13)
211
where B denotes the strain-displacement matrix. 212
We substitute Eq. (10) into (12), then the residual stress rate is represented as 213
( )
{
( )
EM( )
E( )
( )
p( )
}
M
t t t θ t t t
θ θ
λ λ λ λ αθ
= ⋅ − + + −
ρ D ε ε ε I ε (14)
214
Substituting Eqs. (13) and (14) into the virtual work equation: 215
( ) ( )
T 0
Vδ t ⋅ t dV =
∫
ε ρ (15)216
where δε
( )
t denotes the virtual strain rate and the superscript letter T denotes transpose operation, we get217
( )
{
( )
( )
( )
( )
}
T T E p 0
V
t t t t t dV
δu ⋅
∫
B D B u⋅ ⋅ ⋅ −λε +αθ I−ε = (16) 218Considering thearbitrary of δu
( )
t , the expression in the brace must equal to 0, i.e.219
( )
T EM( )
E( )
( )
T p( )
M
V V
T V
t t t t dV t dV
dV
θ
θ θ
λ λ λ λ αθ
⋅ = ⋅ ⋅ + + + ⋅ ⋅ = ⋅ ⋅
∫
∫
∫
K u B D ε ε I B D ε
K B D B
(17) 220
where K denotes the structural global stiffness matrix. We replace D⋅εp
( )
t with the compensation stress221
( )
C t
σ and put Eqs. (11) and (13) into Eqs. (17) and (14). Then the expressions in Eqs. (17) and (14) are 222
written as, respectively 223
( )
T EM( )
E( )
( )
T T C( )
M
V V V
t t θ t dV t dV t dV
θ θ
λ λ λ λλ αθ
⋅ =
∫
⋅ + +∫
⋅ ⋅ +∫
⋅K u B σ σ B D I B σ (18)
224
( )
( )
EM( )
E( )
( )
C( )
M
t t t θ t t t
θ θ
λ λ λ λλ αθ
= ⋅ ⋅ − + − ⋅ −
ρ D B u σ σ D I σ (19)
225
10 / 29
(
) ( )
t t( )
t
t+ ∆ =t t +
∫
+∆ t dtρ ρ ρ (20)
227
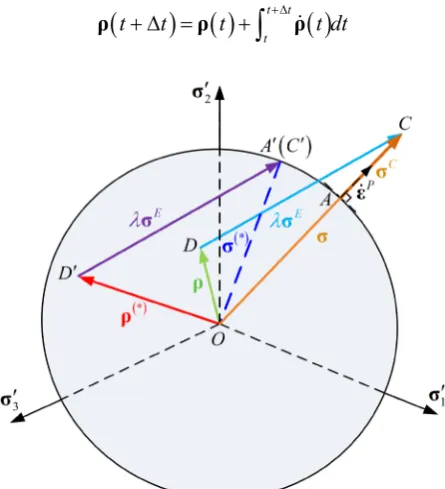
[image:10.595.186.409.76.321.2]228
Fig. 3. Stress superposition schematic in the deviatoric plane. 229
Fig. 3 gives a stress superposition schematic of the SCM in the deviatoric plane. For a load vertex i (or time 230
point ti), the total stress σ
( )
ti at each Gauss point is determined by231
( )
E( ) ( )
EM( )
E( )
( )
i i i M i i i
t t t t θ t t
θ
λ λ λ λ
= + = + +
σ σ ρ σ σ ρ (21)
232
As displayed in Fig. 3, the total stress σ
( )
ti (OC
) equals to the sum of residual stress ρ
( )
ti (OD ) and 233
fictitious elastic stress E
( )
it
λσ (DC). The compensation stress C
( )
it
σ (AC) can be evaluated by the 234
following formulae: 235
( )
( ) ( )
( )
( )
(
( )
)
( )
(
( )
(
( )
)
)
( )
(
( )
)
(
)
0
i y i
i y i
C
i
i i i i
i y i
t t
t t
t
t t t t
t t
σ σ θ
σ σ θ
σ
ξ ξ
σ σ θ
−
>
= ⋅ =
≤
σ σ , (22)
236
where σ
( )
ti is the von Mises stress at load vertex i. By substituting Eq. (22) into (18), the nodal displacement237
rate u
( )
ti is obtained via solving Eq. (18). Next the updated residual stress ρ( )
ti can be calculated by Eqs.238
(19) and (20). 239
4. Numerical implementation of the SCM
240
4.1. Initial preparation 241
11 / 29
stress fields at all the vertices of a loading domain and an initial load multiplier above shakedown limit need to 243
be given. The fictitious elastic stress field can be obtained by combining some basic stress fields from a set of 244
linear elastic solutions. For the convenience of programming, these linear elastic problems are respectively 245
solved and then these calculated stress fields are stored in terms of vector. Considering that the temperature 246
decreases the yield stress of materials, an initial load multiplier is evaluated by 247
( )
( ) ( )
0 1 ini 1 , , m y i V i m E E i i V i dVt t dV
σ ε λ = = = ⋅
∑
∫
∑
∫
xσ x ε x (23)
248
where σy0 is the yield strength with respect to the lowest temperature; εE
( )
x,ti is the stain of the body under249
the fictitious elastic stress E
( )
,i
t
σ x ; and εi
( )
x is the equivalent strain of εE( )
x,ti .250
4.2. Numerical implementation for shakedown analysis 251
For a convex yield function in σ θ− space, shakedown analysis can be simplified by checking the 252
shakedown state of structure under every load vertex vector V
( )
iP x (i=
(
1, , m)
) of the polyhedral loading253
domain in place of all loading paths. Then the static shakedown conditions presented in Eq. (8) need to be 254
examined only at these m load vertices. The following expressions are described as the incremental form. 255
Considering that Eqs. (18) and (19) are solved for every load vertex, we superpose these m expressions at 256
all the load vertices of a load cycle, then we get 257
( )
( )
( )
( )
( )
( )
1 1 1 1 1
m m m m m
EM E C
i i M i i i i
i t i t i t t i t i t
θ
θ θ
λ λ λ λλ α θ
= = = = =
∆ = ⋅ ⋅ ∆ − ∆ + ∆ − ⋅ ∆ −
∑
ρ D B∑
u∑
σ σ D∑
I∑
σ (24)258
For simplification of notation, Eq. (24) is rewritten as 259
( )
( )
( )
( )
1 1 1
0 1
m m m
EM E C
M i i i i
i i i
t t t t
m
θ
θ θ
λ λ λ λλ α θ
= = = ∆ = ⋅ ⋅ ∆ − ∆ + ∆ − ⋅ ∆ − ∆ = ∆
∑
∑
∑
ρ D B u σ σ D I σ
ρ ρ
(25) 260
where ∆ρ0 is the residual stress increment. So the equilibrium equation in Eq. (18) and residual stress
261
increment ∆ρ0 are just solved once during a load cycle.
262
The two-level iterative scheme of the SCM is summarized as follows. For iteration n in inner loop: 263
(1) For every load vertex i, ( )n
( )
it
12 / 29
( )
( )
( )( )
( )0 , 1,2, ,
n k E n
i i
t =λ t + i= m
σ σ ρ (26)
265
(2) Calculate the compensation stress C n( )
( )
it
σ via Eq. (22) for all load vertices of the cycle. 266
(3) Get the nodal displacement increment (n+1)
∆u by solving Eq. (27), and then calculate the residual stress 267
increment ( 1) 0n+
∆ρ by Eq. (28). An updated residual stress ( 1) 0n+
ρ for next iteration is obtained by Eq. (29). 268
( 1)
{
( )( )
( )
( )
( )( )
}
1
m
n k T EM E T C n
M i i i i
V V
i t t t dV t dV
θ
θ θ
λ λ λ λ α θ
+ =
⋅ ∆ =
∑
∫
⋅ ∆ + ∆ + ⋅ ∆ +∫
⋅K u B σ σ D I B σ (27)
269
( ) ( ) ( )
( )
( )
( )( )
( )( )
( ) ( )
1 1
1 1 1
1 1
0 1
m m m
n n k EM E k C n
M i i i i
i i i
n n
t t t t
m
θ
θ θ
λ λ λ λ λ α θ
+ + = = = + + ∆ = ⋅ ⋅ ∆ − ∆ + ∆ − ⋅ ∆ − ∆ = ∆
∑
∑
∑
ρ D B u σ σ D I σ
ρ ρ
(28) 270
( 1) ( ) ( 1)
0n+ = 0n + ∆ 0n+
ρ ρ ρ (29)
271
(4) Check the convergence of C n( )
( )
it
σ , and repeat the steps 1-3 till the convergence is reached. The 272
convergence criterion is defined by 273
(n1)
( )
( )n( )
1i i
t t tol
ξ + −ξ ≤
(30)
274
where tol1 is a predefined tolerance parameter. 275
The outer loop aims to calculate load multipliers. For iteration k in outer loop: 276
(1) Carry out the inner loop till the convergence is in reach. 277
(2) Record the maximum value ( 1) maxk
ξ + of the variable (n+1)
( )
i
t
ξ over a load cycle, that is 278
( 1)
(
( 1)( )
)
maxk max n ti
ξ + = ξ +
(31)
279
(3) The convergence rate is examined: 280 ( ) ( ) 1 max max
2 and 0.1
k
k tol
ξ ω
ξ +
≤ , > (32)
281
where ω is a convergence parameter. If Condition (32) is satisfied, the load multiplier λ( )k is corrected
282 by 283 ( ) ( ) ( ) ( )
(
)
1 max 1 1 max 1 2 1 k k k k ω λ ξ λ ω ξ + + + − ⋅ =− ⋅ (33)
284
and ω is reduced, i.e. ω ω= 2. Otherwise, the updated load multiplier λ(k+1)
is obtained by 285
( 1) ( )
(
( 1))
max
1
k k k
λ + =λ − ⋅ω ξ +
(34)
13 / 29 (4) Check whether the value of ( 1)
maxk
ξ + approaches to zero within a desired tolerance tol3.
287
( 1)
maxk tol3
ξ + ≤ (35)
288
(5) Repeat the steps 1~4 till the convergence condition in Eq. (35) holds. Finally, the shakedown limit 289
multiplier λsh is obtained
290
( 1)
sh k
λ =λ + (36)
291
5. Numerical applications and discussion
292
The numerical procedure is incorporated into ABAQUS software via the user subroutines UMAT and 293
URDFIL. Different FE models, including plane stress element, axisymmetric element and three-dimensional 294
solid element, are considered and analyzed to verify the availability and to demonstrate the performance of the 295
developed numerical method for shakedown analysis of structures considering the temperature effect on yield 296
strength. Both linear and nonlinear yield stress functions with respect to temperature are considered. 297
5.1. Verification of the method for plane stress element by the Bree problem 298
The Bree problem is a typical benchmark example for uniaxial shakedown and ratchet analysis of structure 299
under thermomechanical loading. Some authors (Bree, 1967; Bradford et al., 2014) have studied the shakedown 300
boundary considering the effect of mean temperature on yield strength analytically. In these analyses, the 301
elastoplastic material with different yield strengths off-load and on-load is considered, and the temperature 302
gradient across can wall is small enough thus the yield stress is uniform over the whole structure. However, for 303
actual structures, the temperature difference among different material points may be large. It is necessary to 304
determine these shakedown boundaries considering the effect of temperature gradient on yield strength. 305
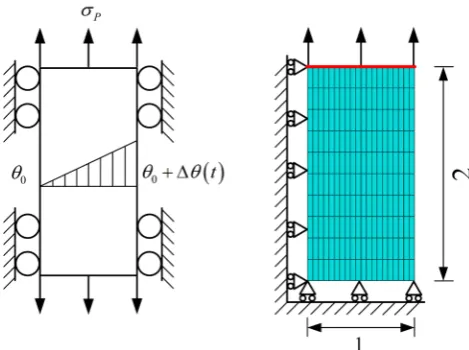
As displayed in Fig. 4, the plate is subject to the cyclic temperature difference ∆θ
( )
t linearly distributed 306along its width and the constant axial tension σP, and the thermal dilation deformation is restricted via plane
307
condition. Under this condition, the through-wall temperature gradient causes bending stress varying between 308
the maximum value σt and zero. The main material parameters of the plate at the room temperature of 20℃
309
that represents the off-load case are given in Table 1. The plate is discretized with 200 quadratic plane stress 310
elements. In the following two sub-sections, the shakedown analyses of the Bree problem considering two kinds 311
14 / 29 313
[image:14.595.146.447.527.651.2]Fig. 4. Geometry of the plate and its FE model. 314
Table 1 Main material parameters of the plate at the room temperature of 20℃.
315
Thermal expansion
coefficient α Yield stress σy0 Young’s modulus E Poisson’s ratio v
5×10⁻⁵ /℃ 360 MPa 208 GPa 0.3
5.1.1 Effect of mean temperature on yield strength
316
We assume that the plate suffers large temperature variation between on-load and off-load cases but the 317
temperature gradient across the width is small enough to be ignored. To estimate the temperature effect, we 318
assume the yield stress σy decreases to σy =0.75σy0 at high temperature, and the other material parameters
319
keep constant. 320
The analytical solution of shakedown boundary curve is as follows (Bree, 1967): 321
(
)
0 0 0 0
0 0
0 0 0 0 0 0
0 0 0 0
2
1 0
1 4
0 1
y y
t P
y y y y y
t y y y y y y
P P
y t y y y y y y
y t y
P
y y y y
σ σ
σ σ
σ σ σ σ σ
σ σ σ σ σ σ σ
σ σ
σ σ σ σ σ σ σ σ
σ σ σ
σ
σ σ σ σ
= + ≤ ≤
+
+ −
+ = ≤ ≤
+
= ≤ ≤ −
(37)
322
The SCM is utilized to evaluate these shakedown limits of the plate under different combinations of constant 323
mechanical load and varying thermal load. Both the calculated numerical shakedown domain and the analytical 324
solutions are displayed in Fig. 5. The boundary of shakedown domain considering the temperature effect is 325
15 / 29
for plastic collapse limit. The numerical results obtained via the SCM agree well with the analytical solution, 327
especially in the ratchet and plastic collapse regions. For a comparison, the shakedown domain of the plate with 328
temperature-independent yield stress is also added in Fig. 5. For CD region, the shakedown limit is 329
0
0.75σ σP y , which is in proportion to the yield strength σy =0.75σy0 corresponding to the highest
330
temperature. Significant differences of the shakedown domains explain the importance of considering the effect 331
of mean temperature on yield strength when assessing the structure undergoing a high temperature variation 332
between off-load and on-load cases. 333
[image:15.595.174.422.251.446.2]334
Fig. 5. Shakedown domain of the plate under a constant uniaxial tension and a varying thermal load 335
considering mean temperature effect on yield strength. 336
5.1.2 Effect of temperature gradient on yield strength
337
Here, the yield stress σ θy
( )
of the plate is assumed as the linear function of temperature θ:338
( )
0(
20)
y y c
σ θ =σ − ⋅ θ− ℃ (38)
339
where c is a parameter. 340
(1) Analytical solutions 341
a) Alternating plasticity mechanism 342
As given in Appendix A, the dimensionless shakedown limit σ σt y0 dominated by alternating plasticity 343
mechanism can be determined by 344
0
2 2
t
y
E c E
σ α
σ = + α (39)
16 / 29 b) Ratcheting mechanism
346
As described in Appendix B, the dimensionless shakedown limit dominated by ratcheting mechanism can 347
be determined by 348
(
)
0 0
1
4 t
P
y y
E
E c
σ
σ α
σ α σ
= − −
(40)
349
Combining Eq. (39) and Eq. (40), we can obtain the coordinate of the intersection of alternating plasticity and 350
ratchet limit boundaries: 351
( )
(
)(
)
0
2 int 1
2 2
P
y
E
E c c E
α σ
σ = − α − + α (41)
352
where σPint σy0 is the dimensionless constant mechanical load of the intersection point.
353
(2) Numerical results by the SCM 354
We adopt the SCM to perform shakedown analysis of the Bree problem considering the temperature-355
dependent yield stress with different values of c. The yield stress is updated according to the actual load factor 356
after each iteration. As some results, the shakedown domains of the plate obtained by the SCM with the values 357
of c equaling to 0, 0.5, 1.0, 1.5 MPa/℃ are presented in Fig. 6, respectively. For the purpose of comparison,
358
the analytical solutions for these cases are also added in this figure. It is obvious that the calculated results by 359
the SCM agree well with the analytical solution, and the value of c has significant influence on these shakedown 360
domains, which demonstrates the significance of considering the temperature effect on yield strength for 361
shakedown problem in practical engineering. 362
In order to explore the relationship between these shakedown limits and the values of c, the vertical and 363
horizontal coordinates of the intersection pointof alternating plasticity limit boundary and ratchet limit boundary 364
in the dimensionless coordinate system σ σ σ σt y0- P y0 are calculated for parameter c varying from 0.0 to 2.0 365
MPa/℃. Fig. 7 and Fig. 8 show the curves of the dimensionless thermal load
0
t y
σ σ and mechanical load 366
0
P y
σ σ at the intersection point versus parameter c, respectively, each of which includes the numerical results 367
17 / 29 369
Fig. 6. Analytical solutions and numerical results by the SCM for the shakedown domains of the Bree 370
problem with different values of parameter c. 371
[image:17.595.184.414.317.496.2]372
Fig. 7. Dimensionless thermal load at the intersection point versus parameter c. 373
374
[image:17.595.179.415.536.713.2]18 / 29
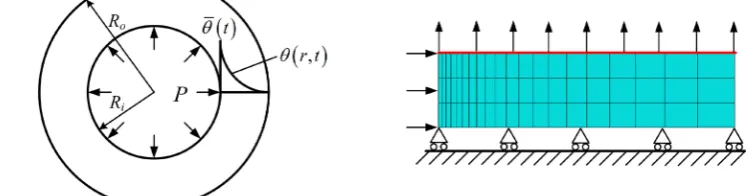
5.2. Verification of the method for axisymmetric element by a thick-walled cylinder 376
Here, we evaluate shakedown domain of a thick-walled cylinder which is displayed in Fig. 9. The outer and 377
inner radii of the cylinder are Roand Ri, respectively. The structure is under the constant internal pressure P and
378
the variable temperature field with nonlinear distribution across its thickness: 379
( )
( ) (
(
o)
)
(
( )
)
0
o i
ln ,
ln
R r
r t t t
R R
θ =θ θ ≤θ ≤θ (42)
380
Considering the axial symmetry of loading and structure, the axisymmetric model is established for FE 381
analysis (see Fig. 9). Plane condition and equivalent axial tension induced by internal pressure are applied to 382
the end face. The discretization of the cylinder consists of 60 quadratic reduced axisymmetric elements 383
(ABAQUS CAX8R) with 20 elements in the radial direction. 384
This example has been studied by some authors (Gokhfeld and Charniavsky, 1980; Vu and Staat, 2007). For 385
the purpose of comparison, we adopt the same material parameters and yield stress functions as those in Vu and 386
Staat (2007). The main material parameters of the thick-walled cylinder are listed in Table 2. The linear and 387
nonlinear yield stress functions of temperature are written, respectively as 388
( )
0(
)
linear
0
1
y y A
σ θ =σ − ⋅ θ θ− (43)
389
( )
0(
)
(
)
2 nonlinear
0 0
1
y y A B
σ θ =σ − ⋅ θ θ− − ⋅ θ θ− (44) 390
where σy0 =190 MPa is the yield stress at temperature θ0; A=8.3 10× −4℃−1 and B=7.41 10× −6℃−2.
391
The shakedown analyses for the thick-walled cylinder with three kinds of yield stress functions were 392
completed by the SCM. The numerical results obtained by the SCM and the solutions from Vu and Staat (2007) 393
are presented in Fig. 10. The good agreement between these two results demonstrates the validity of the 394
algorithm procedure. 395
[image:18.595.101.476.611.709.2]396
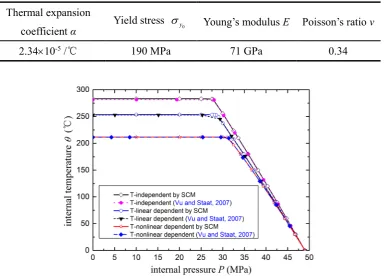
19 / 29
Table 2 Main material parameters of the thick-walled cylinder. 398
Thermal expansion
coefficient α Yield stress σy0 Young’s modulus E Poisson’s ratio v
2.34×10⁻⁵ /℃ 190 MPa 71 GPa 0.34
399
400
Fig. 10. Shakedown domains of the thick-walled cylinder with different yield stress functions. 401
5.3. Applications to engineering structure by a pipe with oblique nozzle 402
To verify the applicability of the developed SCM for complex structure considering the temperature effect 403
on yield strength, an actual pipe with oblique nozzle is analyzed. Fig. 11 shows the one-half geometric model 404
of the structure, and its main geometric parameters are given in Table 3. The hot fluid flows inside the pipe and 405
the nozzle. The structural component works under high temperature and pressure. When the equipment shuts 406
down or starts up, the pipe and the nozzle suffer from large temperature variation and varying pressure, and the 407
material property varies with the temperature. Here, we calculate the shakedown domains of the structure under 408
varying thermal and mechanical loads for two different loading cases with the consideration of the effect of 409
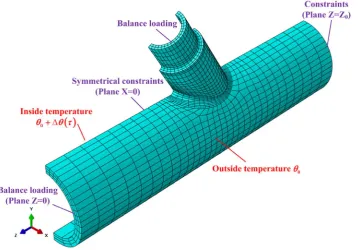
20 / 29 411
[image:20.595.132.466.329.511.2]Fig. 11. One-half geometric model of the pipe with oblique nozzle. 412
Table 3 Main geometric parameters of the pipe with oblique nozzle. 413
Component Parameters Value
Pipe Outer diameter Dp 200 mm Thickness tp 20 mm
Oblique nozzle
Outer diameter Dn 100 mm
Thickness tn 10 mm
Angle φ 60°
Reinforced oblique nozzle Outer diameter Dr 120 mm Thickness tr 20 mm
Round fillet weld Outside radius R 8 mm Inside radius r 6 mm
Fig. 12 gives the detailed information about FE model of the structure, which consists of 3170 elements and 414
16928 nodes. Thesymmetric displacement constraints are applied to the symmetry plane. Plane conditions and 415
equivalent uniform tensions induced by internal pressure are applied to ends of the pipe and the nozzle. For 416
transient heat transfer analysis, 3170 quadratic brick elements are adopted to calculate the temperature field; 417
and for structural static analysis, 3170 reduced integrated quadratic brick elements are employed to calculate 418
the stress field. 419
The temperature θ0 of the outside air keeps constant and the temperature history θ
( )
t =θ0+ ∆θ( )
t of the420
inside fluid follows the curve in Fig. 13. The initial temperature and environment temperature of the structure 421
are both θ =0 20℃. The working pressure is P0=16.5 MPa. The pipe with oblique nozzle is made of chromium
422
21 / 29
4. Here, we only consider the temperature effect on yield strength, and the relation expression is as follows: 424
( )
0 3 MPa 0.15 MPay y
σ θ =σ + − ℃×θ (45)
425
[image:21.595.123.482.144.394.2]426
Fig. 12. FE model of the pipe with oblique nozzle. 427
[image:21.595.171.417.453.612.2]428
Fig. 13. Temperature history of the inside fluid. 429
Firstly, the temperature filed history of the structure is calculated via the transient heat transfer analysis. 430
Then, by setting the obtained temperature filed history as predefined field, the thermal elastic stress field history 431
is calculated via the structural stress analysis. Node 6308 and node 5451 located respectively on the outside and 432
inside surfaces are selected as a representation to show the temperature histories of the outside and inside 433
22 / 29
Fig. 14 that the structure suffers from the maximum temperature gradient at the moment of t=12000 s. Thus the 435
maximum thermal elastic stress of the pipe occurs at this moment. The von Mises thermal and mechanical stress 436
fields of the pipe under the single thermal load and the single working pressure are shown in Fig. 15(a) and (b), 437
[image:22.595.144.452.197.392.2]respectively. 438
Table 4 Main material parameters of the pipe with oblique nozzle. 439
Parameters Value
Thermal expansion coefficient α 2.0×10⁻⁵/℃
Thermal conductivity k 20 W/(m·℃)
Specific heat capacity c 440 J/(kg·℃)
Transfer coefficient pipe-air h1 300 W/(m2·℃)
Transfer coefficient pipe-fluid h2 800 W/(m2·℃)
Density ρ 7800 kg/m3
Yield stress σy 240 MPa
Young’s modulus E 2.1×10⁵ MPa
Poisson’s ratio v 0.3
440
The total elastic stress of the structure consists of two components: σθ denotes the thermal stress
441
corresponding to the temperature load θ ; and σP denotes the mechanical stress caused by the internal
442
pressure P. As displayed in Fig. 16, two types of loading cases are considered. For loading case I, thermal load 443
and internal pressure vary independently. For loading case II, thermal load is cyclic and internal pressure keeps 444
constant. The SCM is employed to determine the shakedown limits of this pipe for two loading cases considering 445
different ratios of the two stress components. 446
The shakedown domains of the pipe with oblique nozzle considering temperature-independent and 447
temperature-dependent yield strengths for two loading cases are all displayed in Fig. 17. For the loading case I, 448
the alternating plasticity mechanism is decisive for the shakedown boundaries AD and A’D. For the loading 449
case II, the shakedown boundaries are divided into two regions i.e., AB or A’B’ for alternating plasticity limit, 450
and BC or B’C for ratchet limit. For both loading case I and loading case II, the shakedown domains are 451
narrowed a lot when the effect of temperature on yield strength is taken into consideration. It is worth noting 452
that, for the alternating plasticity regions AB and A’B’, the shakedown limit is decided by the maximum thermal 453
stress of material point that undergoes high temperature. The high temperature leads to the reduction of the yield 454
23 / 29
shakedown limit and plastic collapse limit of the structure under single pressure, and thus the temperature-456
dependent yield stress has no influence on them. These results show the significance of considering temperature 457
effect on yield strength when assessing the safety of a structure operating under high temperature variation. On 458
the other hand, if the variation range of operating temperature of the structure approaches to zero, the constant 459
[image:23.595.166.430.342.508.2]yield strength can be used to simplify the calculation. 460
Fig. 18 gives the typical convergence process of shakedown load multipliers when using the SCM to perform 461
shakedown analysis of the pipe considering the temperature-dependent yield strength. Over the whole process, 462
only one decomposition of the global stiffness matrix is carried out, which largely enhances the calculation 463
efficiency of the SCM. The CPU time for each iteration of the SCM is about one quarter of that for a complete 464
elastic FE analysis. The CPU time for completing a shakedown analysis is about 250 s using the Intel Core i7 465
processor with 3.39 GHz and 16 GB RAM. 466
467
Fig. 14. Temperature histories of node 5451 and node 6308. 468
469
[image:23.595.141.455.539.695.2]24 / 29 471
[image:24.595.142.454.75.250.2](b) Mechanical stress field 472
Fig. 15. Von Mises stress fields of the pipe with oblique nozzle. 473
[image:24.595.167.440.297.440.2]474
Fig. 16. Two loading cases for shakedown analysis. 475
476
Fig. 17. Shakedown domains of the pipe with oblique nozzle considering temperature-dependent and 477
[image:24.595.162.435.478.686.2]25 / 29 479
Fig. 18. Typical convergence process of shakedown load multipliers by the SCM. 480
6. Conclusions
481
This paper proposes theoretical and numerical aspects of the stress compensation method (SCM) to provide 482
an efficient and accurate approach for shakedown analysis of elastic-plastic structures made of materials with 483
temperature-dependent yield strength under complex thermomechanical loading system. Two-dimensional and 484
three-dimensional numerical examples considering different yield stress functions with respect to temperature 485
are solved and analyzed. The primary remarks of this paper are concluded as follows. 486
1. Based on the extended Melan’s theorem, numerical formulation and algorithm of the SCM are established 487
for shakedown analysis of elastic-plastic structures considering the effect of temperature on yield strength. 488
The yield strength is updated according to the current temperature of material point during each iteration. 489
Both the linear and nonlinear yield stress functions are considered. 490
2. Instead of solving a mathematical programming problem, the SCM for shakedown analysis just conducts 491
a sequence of iterative calculations of FE analyses, where only one decomposition of global stiffness matrix 492
is performed. The numerical procedure is incorporated into ABAQUS platform via the user subroutines 493
UMAT and URDFIL, which make it become a general utility tool for shakedown analysis of complex 494
engineering structures. 495
3. The shakedown domains of the Bree problem considering the effects of mean temperature and temperature 496
gradient on the yield stress as well as of a thick-walled cylinder considering the yield stress as the linear 497
and nonlinear functions of temperature are obtained by the numerical and analytical approaches. The 498
26 / 29
show good accuracy of the presented SCM. Moreover, the application of the SCM to a pipe with oblique 500
nozzle demonstrates that it has high calculation efficiency for large-scale engineering problems with 501
temperature-dependent yield strength. 502
4. The temperature effect on yield strength of material narrows the shakedown domain of a structure under 503
cyclic thermomechanical loading to some degree, which depends on the temperature distribution and failure 504
mechanism of the structure. For a structure with evenly distributed temperature along the thickness, the 505
shakedown limit dominated by plastic collapse mechanism is in proportion to the yield strength at the 506
highest temperature, while the shakedown limit dominated by alternating plasticity mechanism is 507
approximately equal to the average value of shakedown limits using the minimum and maximum yield 508
stresses. For a structure with gradient temperature along the thickness, the temperature-dependent yield 509
strength has greater influences on the shakedown limit dominated by alternating plasticity mechanism than 510
that dominated by ratcheting mechanism. It is very necessary to take into consideration of the temperature 511
effect on yield strength of material when assessing the shakedown behavior of a structure operating at high 512
temperature or undergoing large temperature difference. 513
Acknowledgements
514
This work is supported by theNational Natural Science Foundation of China (Grant No. 11672147) and the 515
National Science Foundation for Distinguished Young Scholars of China (Grant No. 11325211). 516
Appendix A: Alternating plasticity mechanism
517
As given in Bree (1967), the alternating plasticity limit of the Bree problem considering the yield strength 518
as linear function of temperature can be calculated by 519
( )
0
t y y
σ =σ +σ θ (A1)
520
Considering that the thermal stress is σt =Eα θ⋅ ∆ 2 and the temperature-dependent yield strength is 521
( )
0y y c
σ θ =σ − ⋅ ∆θ , Eq. (A1) can be presented as 522
0 0
2 y y
Eα θ σ σ⋅ ∆ = + − ⋅ ∆c θ
(A2)
523
Then the temperature difference ∆θ is obtained by 524
0
4 2
y
c E
σ θ
α
∆ =
+ (A3)
27 / 29
The dimensionless shakedown limit σ σt y0 dominated by alternating plasticity mechanism is determined as
526
0
2 2
t
y
E c E
σ α
σ = + α (A4)
527
Appendix B: Ratcheting mechanism
528
Let us deduce the shakedown limit dominated by ratcheting mechanism for the Bree problem considering 529
the yield strength as function of temperature. Referring to the noncyclic method used to solve the classical Bree 530
problem in Reinhardt (2008), we decompose the loading into a constant mechanical load and a cyclic thermal 531
load. Firstly, the cyclic thermal load is applied and produces a linearly distributed bending stress that changes 532
between σr−σt (or −σr) and σt (or σt−σr) at edges of the plate, as illustrated in Fig. B1. According to
533
the relationship m m1 2=n n1 2, we can calculate the height yh by
534
(
)
2h E h
y
E c
α α
=
− (B1)
535
Next, a limit analysis is performed to determine the maximal allowable constant mechanical load. The plate 536
fails if applied load exceeds the area of regions below the yield stress distribution, i.e., the shaded area shown 537
in Fig. B1. 538
(
)
0 0
0
2 2
1 1
h
h
y h
P y y t r y y y r y
h c dy dy
h h h
σ = σ − ⋅ ∆θ − σ σ− − + σ +σ −
∫
∫
(B2)539
Substituting Eq. (B1) into (B2), we can get the dimensionless shakedown limit 540
(
)
0 0
1
4 t
P
y y
E
E c
σ
σ α
σ α σ
= − −
(B3)
541
[image:27.595.160.444.526.694.2]542
Fig. B1. Stress profile of the plate under reversed thermal bending load and subsequent yield stress 543