Rochester Institute of Technology
RIT Scholar Works
Theses
Thesis/Dissertation Collections
10-14-1988
A Visual Programming Language for Data Flow
Systems
Timothy J. Wilson
Follow this and additional works at:
http://scholarworks.rit.edu/theses
Recommended Citation
Rochester Institute of Technology
School of Computer Science and Technology
A Visual Programming Language for Data Flow
Systems
by
Timothy
J.
Wilson
A thesis submitted to
The Faculty of the School of Computer Science and Technology
in partial fulfillment of the requirements for the degree of
Master of Science in Computer Science.
Approved by:
Dr. Peter Lutz
10-18-88
Dr. Andrew Kitchen
10-18-88
Dr. Peter Anderson
10-18-88
Abstract
Theconceptof visualprogramminglanguagesisdescribedand somenecessary terms
are defined. The value of visual languages ispresentedand anumber ofdifferent
visual languages are described. Various
issues,
such as userinterfacedesign,
arediscussed.
Asanexampleofavisualprogramming
language,
a graphicaldata flow programmingenvironment is developed for the Macintosh workstation which functions as a
preprocessor to a data flow simulator developed at RIT. Examples are presented
demonstrating
the use ofthe language environment. Issues related to the devel opmentofthe programmingenvironment aredescribed and conclusionsregarding thedevelopmentof visualprogramminglanguagesingeneralare presented.
CR CategoriesandSubject Descriptors:
D.l.l
[Programming
Techniques]: Applicative(Functional)Programming;
D.2.1 [Software Engineering]: Requirements/ Specifications
-Languages;
D.2.2 [Software Engineering]: ToolsandTechniques- Structured
Programming;
User
Interfaces;
D.2.6 [Software Engineering]:
Programming Environments;
D.3.2
[Programming
Languages]: LanguageClassifications- Data FlowLanguages;
1.3.6 [ComputerGraphics]:Methodology
andTechniques- InteractionTechniques;
Languages;
I.3.m [ComputerGraphics]:Miscellaneous.
General Terms: Data
Flow,
GraphicalProgramming,
VisualLanguages,
Acknowledgments
I would like to acknowledge the generosity of the Eastman Kodak
Company
forfunding
my Masters Degree program and my supervisors, Mr. JackO'Grady,
Mr. JohnStrickland,
Mr. Donald BarnesandMr. Stephen Hinman forsupportingmyefforts.
Table
ofContents
Chapter
1
-Overview.
1
1.1 Introduction 1
1.2 Definitions. 1
1.3 The ValueofVisual Languages 3
Chapter
2
-Issues in Visual
Programming
5
2.1 Introduction 5
2.2 TheApplicationofGraphics. 6
2.2.1 The UseofGraphicsvs.Text 6
2.2.2
Naming
andQualities 62.2.3 Animation 7
2.3 User InterfaceConsiderations. 7
2.4 The Problem DomainandtheCompletenessofDomainState
Presentation 8
2.5 OperationalConsiderations 8
2.6 SomeUseful
Programming
Paradigms 92.6.1 ControlFlow Programming. 9
2.6.2 Data Flow Programming. 10
2.7 A ReviewofSome
Existing
Visual LanguageSystems 112.7.1 PECAN 11
2.7.2 ThinkPad 12
2.7.3 OMEGA 13
2.7.4 GAL 13
2.7.5 PICT 14
2.7.6
Programming
by
Rehearsal. 142.7.7 PiP 15
2.7.8 FGLandGPL- Data Flow Languages 16
2.7.9 PROGRAPH 16
2.7.10
ThinkerToy
172.7.11 ARK 18
2.7.12 LabVIEW 20
2.8
Summary
21Chapter
3
-An Example
ofGraph
Creation
withFlowGraph
23
3.1 Introduction 23
3.1.1 SomeBasics 23
3.1.2
Starting
FlowGraph 243.1.3 Definitions 26
3.1.7 ConstantNodes 31
3.1.8
Changing
NodesontheGraph 333.1.9
Adding
theRestoftheNodes 363.1.10
Adding
NodesRepresenting
Procedures. 383.1.11
Adding
Arcs 403.1.12
Editing
Arcs 453.1.13 TheMainProgram Graph 46
3.1.14
Setting
Trace Options 483.1.15
Saving
aFlowGraphGraph File 483.1.16
Translating
theGraphsinto theSimulatorInput Files. 493.1.17
Printing
theGraphs 513.1.18
Running
theSimulator. 52Chapter
4
-Project Description
53
4.1 Introduction 53
4.2 Project Implementation 53
4.2.1 The User Interface DesignofFlowGraph 54
4.2.1.1 Menus 55
4.2.1.2 TheNode Palette 56
4.2.1.3 Graph Windows. 57
4.2.1.4 DialogsandAlerts 58
4.2.2 DataStructures 59
4.2.2.1 SignificantToolbox DataStructures 60
4.2.2.2 DataStructuresin FlowGraph 61
4.2.3 ProgramOrganization 66
4.2.3.1 The Event
Loop
.664.2.3.2 MouseEvents 67
4.2.3.3 Update Events 70
4.2.3.4 ActivateEvents 71
4.2.3.5 Keyboard Events 71
4.2.4 ProgramStructure 72
4.2.5 OtherIssues. 75
Chapter 5
-Conclusions
77
5.1 Introduction 77
5.2 The
Viability
ofVisualProgramming
Languages 77 5.3 The UseofVisual Languages in Data Flow Programming. 78 5.4 Issues in the General DevelopmentofVisual Languages. 785.5 ImprovementsonFlowGraph 79
5.6 Final Conclusions 80
Appendix A
-FlowGraph
Users
Manual
81
A.1 Introduction 81
A.2General Operation 81
A.2.1.ThePartsofFlowGraph 81
A.3 FlowGraphMenuCommands 82
A.3.1 The AppleMenu 83
A.3.2 The File Menu 84
A.3.3 The Edit Menu 86
A.3.4 TheProcedure Menu 88
A.3.5 The Preferences Menu 89
A.3.6 TheCompileMenu 91
A.3.7 TheWindowsMenu 92
A.4 TheNodePalette 92
A.4.1 A DescriptionofEach Node Type 93
A.5 The Graph Window 101
A.6 Mouse Operations 101
A. 7 ErrorMessages 102
Appendix
B
-Data Flow Simulator Information
103
B.l Introduction 103
B.2 InstructionSetDesign 103
B.3 Simulator InstructionSet 105
B.4 Simulator Syntax
Summary
107B.5 DetailedDescriptionoftheSimulator InstructionSet 109
B.5.1 MathOperators 109
B.5.2 Predicate Instructions. 110
B.5.3 BooleanInstructions Ill
B.5.4 BranchInstructions 112
B.5.5
Loop
Instructions 113B.5.6 Procedure Instructions 114
B.5.7 I-structure Instructions 115
B.5.8 Output Instructions 115
B.5.9 CommentandConstantInstructions 116
B.6 Debugging. 116
B.7 Other Files Required
by
theSimulator 117B.7.1 ProcessorConfigurationFile 118
B.7.2 InstructionSetConfiguration File 118
B.8
Running
theSimulator 120B.9 Simulator Errors 120
Appendix
C
-Data Flow
Graph Example
122
C.l Introduction 122
C.2 Background 122
C.3 Implementation 123
C.4 Conclusions 129
Table
ofFigures
Figure3.1- theFlowGraphProgram
andDocument Icona 23
Figure3.2- The FlowGraphScreen
24
Figure3.3- A Data FlowGraph
representing the Recursive Factorial
Algorithm 26
Figure3.4
-Creating
aNew Procedure Window 27Figure3.5
-Setting
aProcedure's Name. 28Figure3.6
-Placing
Primative OperationNodes from the Palette into theGraphWindow 29
Figure3.7
-Some Primative Operation Nodesin the GraphWindow 29
Figure3.8
-"Mini-Palette"
for
Selecting
Conditional Nodes 30Figure3.9- Grid
Dialog
Box 31Figure 3.10
-Setting
thevalue ofaConstantNode 32Figure 3.11- Various Displays
ofaConstantNode 32
Figure3.12
-Adding
aConstant 33Figure3.13 34
Figure3.14-ASelectedNode isdisplayedwith aGrayed"Body"
34
Figure 3.15- The"ChangeNode
Type..."
fromtheEdit Menuallowschanging
SelectedNodetoanother"Equivalent"Type 35
Figure3.16-TheMini-Palette
displaying
the"Equivalent"Types 35
Figure 3.17- The GraphaftertheChange
36
Figure 3.18- Node Layout for
theFactorialGraph 37
Figure 3.19- ComparisonofVirtualGraph
Space,
Allocated GraphSpaceandthe GraphWindow 38
Figure3.20
-Selecting
aProcedure Name tobe Addedto theGraphwiththeApply
Palette Operator 39Figure3.21- An Inactive
Apply
OperatorandanActiveApply
Operator 39 Figure 3.22- AProcedure Node40
Figure 3.23- A "Rubber
Band"
Arc 41
Figure 3.24- A
Final,
Connected Arc 41Figure3.25- Connected Factorial Graph 42
Figure3.26- The Standard WindowSizeExposes the Palette 44
Figure3.27- The Window Zoomed to FullSizeCovers the Palette
.44
Figure 3.28- Thearcbetween the
"True"
output portoftheSwitch Node
shouldnot goto the Multiplicationnode 45
Figure3.29- Select AnArc
By Clicking
ontheInput Port it isConnectedto 45 Figure3.30- DeleteaSelected Arc(orNode)
by
usingthe Clearmenuitem 46Figure3.31-TheMain Program Graph 47
Figure3.33- The Standard OutputFile
Dialog
for theSaving
the Graph 49Figure3.34- The
Assembly
Langauge File 50Figure3.35- Output File
for Simulator Data Input 51
Figure3.36- The Page
Setup
Dialog
- Use TallAdjustedforallFlowGraphgraphs 51
Figure3.37- The Print
Dialog
- FasterQuality
isUsually
Sufficient 52Figure4.1 - Partsof
theFlowGraph
Display
55Figure4.2- The Menusin FlowGraph
56
Figure4.3- The Node Palette
57 Figure 4.4- PartsoftheGraph Window
58 Figure 4.5- A Typical FlowGraph
Dialog
Box 59Figure4.6- FlowGraph DataStructure Inter-Relationships 62 FigureCl- Graphofthe Trapezoidal Rule Example
124
Figure C2- Data Flow Graphof
the TrapezoidalRule Made
by
FlowGraph-Main Program 125
FigureC3- Data Flow GraphoftheTrapezoidal Rule Made
by
FlowGraph-Subprogramfor
Calculating
x2 126Figure C3- FlowGraphOutputFile for Simulator 128
Figure C4- Test Data File for Simulator. 129
Chapter
1
Overview
1.1
Introduction
Ascomputer workstationshave becomemorepowerful and morewidely available, as
well as less expensive, there has been a proliferation ofapplicationsthatallow the endusermore"programmability"in theapplication. Ratherthan
developing
specificapplications through the use of expensive resources such as professional
programmers,powerful applications allowthe specification of a probleminadomain understood
by
theuser.Conventional programming techniques involvespecifying theproblem anditsmethod
of solution asacollection ofprimitiveoperationsappliedin asequential,linear fash
ion. The translationoftheproblemdomain tothecomputer'sexecution domain has
beentherole oftheprogrammer.
Toprovide aprogrammable environmentthat iseasilyunderstood
by
the user, manytechniqueshave beendeveloped to provide amethod ofpresenting the problemand its method of solution to the computer system (i.e. programming). One class of
methodsisvisualprogramming.
1.2 Definitions
For thepurposes ofthisthesis,visual programmingisdefinedas theapplicationofa
systemor environmentthat allowsthatuserto specify aprogram in a multidimen
sional
fashion,
utilizingaspatial arraignment of programprimitives and constructstextual
languages
isa one-dimensional, linearprocessthatmimicstheclassical sequentialexecution modelofcomputers.
Anumber of other termsare relatedto (orconfusedwith)visualprogramming. The terms graphical language andgraphical programming are used to designate lan
guages orparadigmsthat usegraphicsto asignificantdegree. Allofthe languages
discussedin this thesisare examplesof graphicallanguages.
Programvisualizationis theuse of graphicaltechniquestoillustrate somefeaturesof
a computer programor systembutnotitsspecification.
They
areappliedafter a program has been specified or in conjunction with the programming specification.
Programvisualizationtechniquescanbepresentedin a
taxonomy
thatisdivided intocode representation versusdatarepresentationand staticillustrationversusdynamic
illustration. [Myers 1986] Staticillustrationpresents a"snapshot"of some aspect of theexecution environmentwhiledynamicillustrationprovides a real-timeanimation oftheexecutionenvironment.
Anothertermusedinconjunctionwith visual programming is
Programming
bvExample. Some systems ofthis typerequire that theuser demonstrate an algorithm
through anumber of examples and thenthe systeminfersa general program struc ture. ThishasbeenanareaofArtificial Intelligenceresearch. Othersystemsrequire theuserto completely specify the approach without any inferenceonthepartofthe
system,althoughtheusersupplies aspecifyexample. Thisapproachhas beencalled
as
Programming
with Examples.Programming
with Examplescanbe describedas"DoWhat I Did"
while the inferential
Programming by
Example systems should"DoWhat I Mean". As with program visualization systems, graphical techniques are
sometimes utilizedin
Programming
by
Examplesystemsbutthey
are notintrinsictothespecification oftheprogramasis thecasewith visualprogramming.
keyboard
entry inresponsetoaspecific prompt orthey
maybemorecomplex,suchaspickingon objectfromapalettedisplayedinone window ofanoutputdeviceusinga
mouseand then"placing"theobjectinanother windowor area. The userinterface
design encompasses the application ofinput / output
(I/O)
devices such as mice,tactileresponse
devices,
lightpens,graphicstabletsandbit-mappedgraphics screens as well as many different methods ofinformation presentation, such as scrolling windows,menus,palettes anddialog
boxes.In the design of any programming
language,
it is the application of a specificgrammartoa setofsymbolsthatdefinesthelanguage anditsproblemdomain.
Avisuallanguage has itsgrammardefined
by
the spatial orientationofthe graphicelementsthat form thelanguagesymbols. Auserinterfacedefinesthe setofopera
tionson thesymbolsfortheirmanipulation and management. Inthedevelopmentof avisual
language,
the languageimplementor isnowfacedwiththe the definitionof allthree elements(grammar,
symbols,andinterface),
ratherthanjust thegrammar and symbolsof aconventionaltextuallanguage.1.3 The Value
ofVisual Languages
Thisthesisreviews theissues in thedevelopmentandimplementationof visualpro
gramminglanguages. Thebasic issues oftextversus graphics are discussedin the context ofprogramminglanguages and the power of visual language systems are shown. Important considerations in visual languages are shown to be the user
interface,
therepresentationoftheproblemdomain,
andtheoperationalfeaturesandcharacteristics oftheprogrammingsystem.
Programming
paradigmsare also describedwithrespecttovisualprogramming languages. Theseparadigmsinclude classicalcontrolflow programmingand data flow
programming. The advantages ofthe data flow paradigmfor visualprogramming
Forabackgroundinthedevelopmentof visualprogramming
languages,
anumber ofdifferent
systems are described.They
are presented in an order thatroughly represents theimportantdevelopments of visual programminglanguages andsystems.
Somerelevantissuesarediscussed withrespectto eachlanguage. It is shownthat
visual programming languages started as a method to visualize control flow
programmingandthen evolvedinto systemsthatmove to specific problemdomains
that takeadvantage ofthe users
familiarity
withthe abstract objectsoftheproblemdomain.
Thevisualprogramminglanguage developed forthis
thesis,
FlowGraph,
isthenpresented through the developmentofa simple example program. The specific issues
thatwereencounteredin thedevelopmentofFlowGrapharethendescribed.
Basedonthe background discussionandtheissuesencounteredin the development
Chapter
2
Issues in
Visual
Programming
2.1
Introduction
With the advent of
fast,
inexpensive bit-mapped graphics workstations and the in crease in so-called "non-technical" computer users, research is proceeding in the development of systemsthatpresent a computersystem paradigm which iseasierforthe enduser to understand and control. Much ofthis work is in the field ofUser Interface Management
Systems,
which are usually used to enhance the operating system software. These systemsuse graphical representationsof objectsto presentthemachine stateinformationorprovidetools forapplicationstogenerate consistent,
easy-to-use user interfaces. As the user interface research matures and the
workstationsbecomemoreavailable, theresearchismoving towardapplicationsthat providepowerfulmethodsforthe userto utilizethe computerto solve problemsina
fashionmorecloselyrelatedto theproblemdomain.
This section describes approaches used to
develop
computer programming environmentsusinggraphical objectstorepresentthe abstract entitiesthatare manipu
latedinacomputerprogram. Therange ofapproachesto thisproblemis
fairly broad,
with the utilization of graphics
being
used in different degrees and for different reasons.[Halbert1984] hasshownthatnon-programmers can create
fairly
complexprogramswith visual languages. Visual languagesprovidethe tools to express aproblem in
2J.,,,TheJ^plicaiiQn^
Historically,
visualprogramming languages canbe tracedback to two early devel opments:SKETCHPAD [Sutherland1963],
an earlyinteractivegraphicsworkstationdevelopedatMITand a projecton
drawing
flowchartsusingacomputer[Knuth1963] to assistinprogramdevelopment. Bothofthese types ofsystems representthetwoearly developments that have paved the way for modern graphical programming
languages,
with SKETCHPAD providing the interactive graphics and the Knuth system usingthe computertodevelop
some graphical outputforprovidingprogramvisualization.
2,2.1
The
Use
ofGraphics
vs.Text
The stress on graphics versus text is derived from the manner in which humans
assimilateinformation. Ithasbeen shownthatinformationrepresentedinpictures
canbe more rapidly and completelyunderstood. The human eye rapidly scans an
entire scenebefore it focuses onthe area ofinterest. Asthe brainattemptstopick
out those areas ofthe scene which are
important,
the whole scene is repeatedlyrescanned andthe
key
pointsofinterestare registered. When thisprocessis applied totext,
the brain tends to scan forillustrations,
headings andhighlights before itbeginstheprocess ofrigorously
following
the linear flowofthetext.By
allowingtheeye/brainsystemto functionon graphical
data,
the brainspreferredpattern of scenescanningcanbeusedtogatherandassimilatethe informationquite rapidly.
2.2.2
Naming
andQualities
Another attribute of graphical informationis its abilityto portray information and
2.2.3
Animation
Graphical programs and representations can also be used to present an execution
modelthrough theuseofanimation. Animationtechniquescanbeusedtoshowmuch
oftheinformationabouttheprogram's execution state(s).
2.3,
Interface
Considerations
One of the major concerns in software development is programmer productivity.
Many
people are studying the methodsby
which user and programmerproductivitycanbe increased. The designanddevelopmentof userinterface systemshasthegoal
ofprovidinga more complete pictureofthecurrent state of acomputingsystemto the
user,beyondthatwhichisprovided
by
manycurrentoperatingsystems, such astheclassic
fromtheUNLXc-shelloperatingsystem.
Therehas beenalargenumber ofstudiesontheappropriatedesignof userinterfaces
for computing. Theserangefrom theergonomicsof computerhardwaredesignto the
appearance andinteractiveapproaches of system software. Themajor consideration
is thatuserinteraction techniques mustbe designedto supportthree types ofbasic
humanprocesses: cognition,perceptionandmotoractivity.Acomprehensivestudyin
this area is provided
by
[Foley,
Wallace and Chan 1984] and[Foley
and Wallace1974].
These considerationsare alsoimportant in the areaof programmersupport. Thatis
the fundamentalreasonbehindgraphicalprogrammingandvisuallanguagesystems.
Some ofthe systems describedabove were developedsolelytoincreaseprogrammer
program(seeespecially the PECANsystem[Reiss 1984b]). Othersattempttoprovide
a better fundamental model for programming, using a model with an interactive
visual representation(i.e. PROGRAPH [MatwinandPietrzkowski
1985],
PiP [Raeder1985 and Raeder
1984],
Programming by
Rehearsal [Finzer and Gould1984]),
ThinkerToy
[Gutfreund 1987]andARK [Smith 1986]. Thegoal ofprovidingavisual,graphical environment that betterrepresents the problem domain or model to the
userisa commongoalofthesesystems andofthesystemthatwasdevelopedforthis
thesis. (Additionalreferencestouserinterfacedesignconsiderations areincluded in
the
Bibliography
andthe FurtherReading
section).2.4
The
Problem Domain
andthe:..Completeness
ofDomain
State Presentation
Visuallanguagesprovide a methodofpresentingalargeamountofinformationat one
time.
By
keying
graphicsto the users problemdomain,
information ismorerapidlycommunicatedtotheuser.
Tying
thegraphicstotheproblemdomain isbothabenefitand a limitation invisuallanguages. The benefit is the amount ofinformationthat
can bepresented to the user. The user is expected tounderstand thisinformation
because ofthe users knowledge ofthe properties ofthe objects that the graphics
represent. The limitation is that if the userdoesnothaveaknowledgeoftheobjects
represented in the program, the information presented is not as useful. The
concentration ontheproblemdomain mayalsolimitthe applicabilityofthe language.
A tradeoffin visual languages is the level ofcomplexity ofthe properties that the
objects in the language represent. As the problem domain of the language is
narrowed,theamount ofpropertyinformationthatan object canconveycanincrease.
The programeditor
(
graphicortext)
issyntax-directedtoeliminate syntax errorsin thecode whileitis
being
entered;Theusermanipulatesthegraphics whiletheprogramis
being
createdoredited andthen thesystemanimatesthegraphics
during
execution. Thisshouldleadtoabetterunderstanding
by
theprogrammerofhis algorithm;Inmanycasestheprograms are
incrementally
compiledorinterpretedsothatthey
couldbe executed atany time in thedevelopment[Reiss
1984a,
Schwartz,
DelisleandBegwani 1984].
Many
systems allowed the execution of unfinished orincompleteprograms, so that
debugging
the algorithm could begin before the program wascomplete.
Allofthesepoints are aimed atthegoal ofmaking the systemresponsiveto theuser
andgiving the userthe maximum
flexibility
in the approaches to solving his problems.
2.6
Some
Useful.ProgrammingParadigms
It is important to
briefly
discuss some ofthe differentprogrammingparadigms thatare
being
studied. Control flow programming and data flow programming arediscussed below. It is importantto note which programming paradigms are more
applicabletovisuallanguagessystems.
2.6.1 Control Flow
Programming
Control flow systems represent the conventional computer processors of today.
Control flow programs are stored and executed in a sequential manner. No in
struction can execute until all previousinstructions haveexecuted.Regardlessofthe
The principles behind todays computersgenerally reflectthose ideas developed
by
vonNeuman. Von Neuman systems are sequentialinnature, with separatecentral
processingunitsand memory. Thesecomponents are connected
by
a singlechannel, in which only one word or address maypass at one time. This system provides aseriouslimitto theexpansion ofcomputingpower[Backus 1978].
Programming
languages have been developed around these machine architectureconcepts and so providelittle
help
in theadvancementofcomputingcapability.2,6.2
Data
Flow
Programming
Inresponseto this
dilemma,
anumber ofdifferentcomputerarchitectureshave beenproposed. Onearea ofresearch,pioneered
by
Jack DennisatMIT [Dennis1975],
is the development ofdata flow systems. These data flow(
or data driven)
systemsprovide an architecture that supports parallel processing quite naturally. It also
eliminatessequentialprocessing,
by
allowinganyoperationsto occur whenevertheirrequired operands are available. Theseoperandsare passed as
tokens,
ratherthanbeing
maintainedinstaticmemorylocations,
sothe processor/memory"bottleneck"
iseliminated[Backus 1978].
Asan example ofthe difference between data flow andcontrol flow programs, con
siderthe
following
sequence ofinstructions,
as representedinacontrolflowsystem:P = X + Y
Q
= P/
YR = X * P
S = R
-Q
T = R * PRESULT = S/T
In parallelprocessing data flow systems, these instructions canbeprocessed more
P = X + Y
Q
= P/Y & R = X * PS=R-Q
& T = R*PRESULT - S/T
Theparallel natureofthealgorithmisutilized
by
thedata flowsystem.The principles are
being
applied in hardware througha numberofdifferentmultiprocessor,data flowcomputerdesigns. Someofthemajor systemsinclude the M.I.T. Data Flow
Computer,
theManchester Data FlowComputer,
the Irvine Data FlowMachine,
the Texas InstrumentsDistributed DataProcessor,
the Utah Data-DrivenMachine,
the LAU system andthe Newcastle Data-Control Flow Computer. Thesedataflowarchitectures aredescribedinmoredetail in
[Treleaven,
Brownbridge and Hopkins1982],
[Torsone1985],
[Lawson 1986]and [Benjamin 1988].Data flow languagesprovidethe tools to
directly
supportthesesystemarchitectures. The most naturalrepresentationis thatofthe directedgraph. Thismakesdata flowlanguages attractive to implement with visual programming systems, such as the
systemdeveloped here.
2.7
A Review
ofSome
Existing
Language
Systems
Differentvisuallanguage systemshavebereviewedto
identify
thecriticalissuesandinsights that
they
provide.They
represent a cross section of implementationtechniques,
from the utilization of some visual or graphicaltechniquesto languagesthatare
highly
visualtosupporttheirproblemdomain.2.7.1 PECAN
The PECAN system [Reiss
1984a,
1984b] essentially provides different views ofaprogram
being
developedinaconventional,controlflowstyle. Theseviewsinclude aview oftheprogramdeclarations. Theseprovide viewsoftheprogram syntax. Views ofthe symbol table
being
generated, the program's defined datatypes,
expression trees andflowofcontrol charts provide semantic viewsoftheprogram. The PECANsystemdevelopersare
integrating
a systemofexecution viewsbasedontheirBALSA algorithmanimation system[Brown,
Meyrowitz andvan Dam 1983]. Thisprogram visualization system wasdevelopedatBrownUniversity.PECAN is utilizes the techniques described above to support conventional pro
gramming techniques. Its use ofmultipleviews ofcode and
data,
syntax directededitingandincrementalcompilation arethehighlightsofthe system.
However,
it is not abletoutilize more advanced graphicalor visualtechniquesbecauseit issoheavy
tied to conventional,controlflowprogramminglanguages.2.7.2
ThinkPad
The Think Pad system
[Rubin,
Collin andReiss 1985] uses aprogramming-by-ex-ample system which allows the user to create graphical representations of data structures. Thesegraphicaldatastructure representations canthenbecombinedto form
functions,
which are then combined to form programs. Although the user ismanipulating graphics, he must also provide some textual information about the graphic object. As the programmer manipulates the various data structures that
werecreated, thefunctionsemantics aredefined. Aseach objectiscreated,ThinkPad
creates a
Prolog
program. This is the finaloutput oftheThink Padsystem. Current workbeing
done includes the inverse mapping ofProlog
programs to Think Pad graphics representations. This would also allow the trace function inProlog
to provideinput foraformof algorithm animationin Think Pad. Itwasalso developed atBrown University.structures. The graphicalinterface merelyprovidesabetter userinterface forma nipulating the text thatrepresentsthedatastructures.
2,7.3
OMEGA
TheOMEGA System at
Berkeley
[Powelland Linton 1984] isa systemthat allows usersto manipulate graphical objects and structures.They
useicons torepresent a abstractprogramming concept (such as sorting adatabase, defining
a variable, a variableitself,
acontrolstructure,adatatype). Thegraphicalicons simplyrepresent objectswhose complete specification isstillgiveninatextualform. OMEGAallows manipulation ofthe definedicons,
but at alowerlevel,
itstill requires textfor thedetailedspecificationsoftheprogram which makesitusefulforprogram visualization ratherthanvisualprogramming.
OMEGA actually is iconic innature,with abstract representations of objectsthatcan
be picked
by
the user in a syntax-freemanner.However,
OMEGA is stillheavily
dependant on text andessentially uses the icons to represent complex objects. It mixestextandicons inamanner suchthat theiconsbecome"words"
thatextendthe
vocabularyofthelanguage. Once again, thegraphics areusedto enhance the user interfaceof atextual system,ratherthanavisualsystem.
2,7.4 GAL
The GALsystem[Albizuri- Romero
1984a,
1984b]wasdevelopedattheUniversity
of Sussexanduses graphicsinamanner similartoPECAN,
althoughnot asextensivelyas PECAN.
Basically,
it provides a method to imbed textual code into Nassi-Shneidermancharts. This isreallynotvisual programmingbutadvanced graphical2.7.5 PICT
ThePICTsystemisa graphical approachto traditionalvonNeuman languages. The
PICTsystemwas developedasavisuallanguageatthe
University
ofWashington inSeattle,
WA. [Glinert and Tanimoto 1984]. The PICT system uses no textin thedevelopment ofprograms. The program's flow of control and its data are
totally
represented
by
graphical objects. The user interacts with the system through ajoystickwhich controls a cursor on a color graphics CRT. Theusercreates colored
icons that represent operations, data structures and variables.
Directed,
coloredpaths representcontrolstructureswhichdirecttheprogramflow. Theuser'sactions
are managed
by
a syntax-directed editor,which eliminates syntacticinconsistenciesduring
program developmentand editing. Atruntime,
theprogram's graphics areanimatedto showitsoperation,whichgivesitthe ability to support program visual
ization. Thus the program is representedboth in development andexecution
by
aconsistent graphical structuretotheuser.
The PICTsystemisusefulfor
doing
some simple computer programming.However,
it has some drawbacks. Eachmodule (program or subprogram) hasavailable only
fourvariables (represented
by
four colors: red, green, blue and orange) which arerestrictedin type to
being
six-digit,non-negativeintegers. Thesystemalsohasonly16 primitive operations, of which two are for system control, five are boolean
operations andthe remainingnine are primitiveoperations on variables.
2.7.6
Programming
by
Rehearsal
Programming
by
Rehearsal [Finzerand Gould 1984] was developed to aidnonpro-grammersin creatingeducational software. Thissystemdefinesatheatermetaphor
whereadirectorcan audition performers with variousattributes,place required per
attributes into
"troupes",
i.e. basic data types(text,
integers)
are theBasicTroupe,
pictures are the
GraphicsTroupe,
clockformsaretheTimeTroupe,
etc. The directoruses a mousetomove the performersto the appropriate positionson the stage orin
the wings,where
they
arehiddenfrom theprograms end user. The director definesthe interaction ofthe performers
by
the way thatthey
respondto cuesfrom otherperformers,
on-and off-stage. In this system, textualcommands define boththeac
tions andinteractionsofthevarious objectswhiletheirgraphicalrepresentation can
be manipulated to provide the appropriate "view" of the objects, that
is,
theirpresentationto the user.
Programming By
Rehearsalwasdeveloped atthe Xerox-PaloAltoResearchCenter (PARC).
Theuse ofthe theatermetaphor andthe objectoriented,message passingnatureof
theprogramarethe
key
elementsofProgramming by
Rehearsal.2.7.7 PiP
An importantvisual programming language is the
Programming
in Pictures(PiP)
system, developed at the
University
ofSouthern California in 1984 [Raeder1984,
Raeder 1985]. In this system,pictures areusedtorepresenttheoperations oninput
data. Theusercreatesthesepicturesinafreehandmannerthat thenrepresent the
operations. Thedatapictures arethencombined
by
pointingatthemandthen usingoperators to combinetheminto functions. Control structures are available to com
bine small functions into larger ones. The system also uses Backus's functional
programmingmodel.
Becausethe PiPsystem allows users to createtheirown pictures, thegraphics may
moreadequatelyrepresenttotheuserhisproblemdomain.
However,
themetaphorssuggested
by
the pictures can be misleading, since the level of completeness of2,.?.,.S..FGL
andGPL^Data-FlQW
Languages
Two graphicalprogramminglanguages that were designed inconjunction the Uni
versity ofUtah data flowmachine project, DDM
1,
are FGL (Function Graph Language)[Keller andYen 1981] and GPL (Graphical
Programming
Language)
[DavisandLowder 1981]. Thesesystems aretwo approachesto the developmentofavisual
programming language are based on the data flow model. Each system takes a
slightlydifferentapproachto thedata flowimplementation [DavisandKeller 1982].
FGLandGPLaregraphicallanguagesverysimilarto thesystemproposedhere. The
papersdon'tpresent sufficientinformationaboutthe programmingenvironment and
implementation to contrast it with this system. Both allow the creation and
manipulation of adata flowgraph asthe primarymeans of programming. (Seealso
[Maguire 1983]).
2.7.9
PROGRAPHOneofthemost
interesting
visualprogramminglanguages isPROGRAPH,
developedatthe
University
ofOttawa [Matwin andPietrzkowski 1985]. The language modelfor PROGRAPH isacombinationofanumberoffunctional programming
languages;
namely, LISP
[McCarthy
1965],
APL [Iverson1962],
FP [Backus1978],
and GPL (GPL isdescribedabove).PROGRAPHcontainsmanyimportant features:
It isessentiallyfunctional innature.
Itoperates ondataofarbitrarycomplexity.
Itdoesnotrequirethe declarationof variables.
Itprovidesadatabasestructurethatiscompatible with PROLOG.
Thegraphicalrepresentationisalsothebasisof runtimeanimationforprogram
visualization.
With respectto itsgraphicalprogrammingaspects, PROGRAPHallowsthe userto
manipulateasetofprimitive operationsthatare assembledintoadefinition. Eachof theuser's definitions can then bemanipulatedjustlike aprimitive operation, tobe combinedinto furtherdefinitions.
PROGRAPH's importance stems notonly from its use ofa graphical programming
and execution environment, but also from its ability to support and encourage
parallelism,itslistmanipulationfacilities(similarto
LISP)
andits ability to interactwithPROLOGandPROLOGdatabases. These featuresall combinetomakeitone of themostpowerful,state-of-the-artsystems. Intermsof visualprogramming,much of thegraphicalelementsrelyontext to
identify
the functionandthe control structures rather than utilizing some unique graphic portrayal of these characteristics.However,
this is appropriate since the problem domain ofPROGRAPH is generalprogramming and the terms and text identifiers are appropriate for the targeted users,who wouldbefamiliarwithgeneral,controlflow-styleprogramming.
2.7.10
ThinkerToy
ThinkerToy
is a visuallanguage environmentdeveloped attheUniversity
ofMas sachusetts at Amherst thatwas developed for modelingdecision support systems [Gutfreund 1987]. Decisionsupportsystemsarethoseputinplace toanalyzesemi-structured decision tasks such asbond
trading,
settingbudgets,
capital acquisition analysisandtimestudy.ThinkerToy
isan object-oriented systemthatsuppliesanumber ofdifferent"toolkits"
withdifferentdimensionalcharacteristics:
Id:
Array
Operations
for manipulatingtabulardata.2d:Chart Operationsforcurve
fitting
andextraction nets.3d:Terrain
Map
Operationsfor managingterrainmaps andthematicmaps.These operations are applied through the use ofPanelswhich allow access to the
various primitivefunctions. The panels are manipulatedwith a mouse to
directly
apply the tools to data.
ThinkerToy
actually supportstwo types oftoolapplication:directvisualanalysis and scripting. Anexampleofdirectvisualanalysisistheaction
ofplacinga rulertoolover amapor acurvefittertooloveradatachart.
Scripting
isa collection ofgenerictool
handling instructions,
thatcorrespond to complex mouseoperationsonatoolorset oftools.
ThinkerToy
seems quite similar toProgramming By Rehearsal,
with a Panel inThinkerToy
being
equivalent to a Troupe inProgramming
By
Rehearsal. Thisdemonstratesone ofthe attributesof visual
languages,
whichistheirfocus ona specificproblemdomain.
2.7.11 ARK
The Alternate
Reality
Kit(ARK)
was developed at the Xerox Palo Alto ResearchCenter
(PARC)
by
Randell Smith [Smith 1986]. ARK is an animated simulationenvironmentthatwasdesigned toenablethedevelopmentofintuitiveunderstanding
of abstract physicallaws.
ARKisanobject oriented systemimplemented inSmallTalk-80. Itconsistsof seven
major objects which arethe fundamental tools and
building
blocksofthe language.Buttonsthatare moved and placed
by
thehadover objectsthatthey
can then sendmessagesto. The buttonsnamedescribesthemessageitsends.
The warehouseis thestore of all oftheprototype objects availableto analternate
reality.
They
are extractedfromthewarehouseforuse.Representatives are objects that
display
a picture or some textdescribing
the SmallTalkobjectthey
representin thealternate reality.Message Boxes allowthe developmentof userdefinedmessages which canbe sent
toobjectsthataredefinedtorespondto theparticularmessage. Messageboxes em
ploy visual "plugs" to specify the message receiverand the message arguments (if any). To eliminate syntax errors, plugs willnot"stick" to any objectthatdoes not recognizeorrespondto the typeofmessage
being
sent. Messageboxes,
oncedefinedby
theuser,canbechangedtobuttonsforrepeateduse."Sliderswitches"
area graphicalmethodofspecifyingnumeric valuesto theobjects
thatrequire numbers.
Interactorsarethefundamental methodof
defining
anon-going "physicalprocess"
thatoccursin theAlternateReality. Anexampleofthisisagravity
interactor,
which isconstantly effecting theforces on otherobjectsintheAlternateReality
thathavea defined property ofMass.Any
number ofinteractors can be be specified in an AlternateReality
and thenthe properties thatthey
represent are availablefor inspection and manipulation. Thehandcanbeusedtopickup and"throw" objects,for example, to study theeffects oftheirdirectmanipulation. Thepropertiesdefined
by
theinteractors in the Alternate
Reality
canbe adjustedto see how theseproperties effecttheobjectsthatcanbemanipulatedby
the hand.ARKuses graphicalimages andthe ability tomanipulate themin atangibleway to
2.7.12 LabVIEW
LabVIEWisacommercialsoftware packagedesignedtosupportdataacquisition and dataprocessingontheMacintosh
[Kodosky
andDye 1987]. Itcombinesmanyofthe features of visual programming with data flow programming to provide anenvironmentdescribedas avirtualinstrument.
LabVIEWhasbeendesigned tohandle the tasksofdataacquisitioninstrumentcon
trol,
data acquisition, and data processing. It uses a data flow-like paradigm ofwiringacircuit, providinggraphical componentsthatrepresent
logical,
mathematical, statistical, stringandI/O functions. Theseare assembledin an"Diagram"win
dowthatrepresents a singlefunctionoroperation. The I/Ofunctionsprovidecontrol
ofinstrumentsthatare connectedtotheMacintoshviaaGPIB bus. Otheravailable
functionsprovide data flow extensionsthatprovide intuitivemethodsfor specifying
conditionaloperations,iterative operations and
"apply
toall"procedures.
Once functions havebeen
defined,
the"Panel"windowcarriesthethemetaphorofthevirtual instrument
by
placing graphic switches,knobs,
and meters which canrepresentone source ofI/O to thefunctions. Oncesimplevirtualinstruments have been
defined, they
canbe readily combinedtocreate morecomplex dataprocessingsystems.
LabVIEW demonstrates themajor contribution of visuallanguages. It is intuitiveto
personnelthatareused toworkingwithinstrumentsanditmatches well with their
problemdomain. Itprovidesa"rear
view"
of an
instrument,
complete withitswiredinteriorcircuits and a"front
view"
M^Sjjmmary
The major problems to be solved at this stage in the development of visual pro
gramming languages have to deal with the development of the appropriate
paradigms. Pure visualprogrammingsystems seem toindicate thatstandard pro
gramminglanguage paradigms
(
i.e.imperative,
procedural languages)
cannotbetransformed intogoodvisuallanguages. Becausetheuserinteractstoahigh degree
in the designand specification ofthegraphicalobjects,declarativeor object-oriented
approaches may be better suited to visual languages. The PICT system seems to
sufferbecauseit tries toholdtoaprocedurallanguageapproach.
Graphical programminglanguagetechniqueshaveevolvedintwodifferent branches.
One
branch,
that ofthe programming visualization systems, exemplifiedby
thePECANsystemandtheOMEGAsystem,will
develop
systems withmany"views"
of a
program
(
some graphical and some textual)
so that the appropriate information aboutthe program's performance willbe available to the programmer, along withsystems that
help
enforce rules of good structuring, high reliability and goodmaintainability.
Theotherbranchwillbethatof"pure"visualprogramming environments,wherethe
programmer will manipulate graphical objects. One ofthedifficultiestobeovercome
is the contextof graphical objects, thefactthat
they
conveyinformation abstractly(
through theirappearance
)
andmaybe misunderstood or misinterpreted. The needexiststo
develop
a symbol system or rulesandconstraintsfordesigning
symbolsthatare clearandunambiguous. Also themanagement ofthe graphical databasesthat
are generatedwillhavetobeoptimized.
Visual programminglanguages can provide programmingsystems thatwill solve a
wide range of problems.
They
will allow programsto bewrittenby
personswith anunderstanding ofthe problem's domain
by
allowing symbols to be developed thatrepresentexactlytheproblem ratherthanfirst
having
toredefinetheproblem withaChapter
3
An
Example
ofGraph Creation
With FlowGraph
3,1
Introduction
This chapter gives a demonstration ofFlowGraph as it used to create a data flow
program ofthe classicalfactorialalgorithm. Itdemonstratesmanyofthefeaturesof
FlowGraphandmanyofthe techniquesusedtocreatedata flowgraphs and programs
thatwillexecuteonthe data flowsimulator atRIT [Benjamin 1988].
3.1.1
Some Basics
FlowGraph operates on aMacintosh computer as a preprocessorfor the data flow
simulator atRIT. Itspurposeistoallowtheusertodrawadataflowgraphinavery
intuitive mannerandthen translatethe graphinto atextual assemblylanguagefor
processingwiththedataflowsimulator.
FlowGraphoperatesthroughthe frameworkofmany ofthe standarduserinterface
paradigms ofthe Macintosh [Rose 1985]. The terms used in thischapter arethose
foundinthe standardMacintoshvernacular. For theuser unfamiliar with theMac
intosh,
theprincipletermsaredefinedin the Glossary. [image:32.540.184.357.539.614.2]FlowGraph Fact-Test
Figure 3.1 - theFlowGraph Program
3.,.L2
Starting,
Flowgraph
FlowGraphcanbe launched
by
selecting its icon(Figure3.1)in the Macintosh Finderand selecting Open from the File menu.
Alternately,
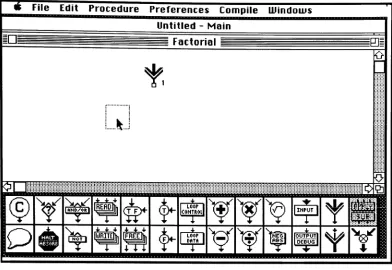
double clicking on the [image:33.540.74.468.213.481.2]FlowGraph iconwilllaunch theprogram. TheFlowGraph screen
display
isshowninFigure 3.2.
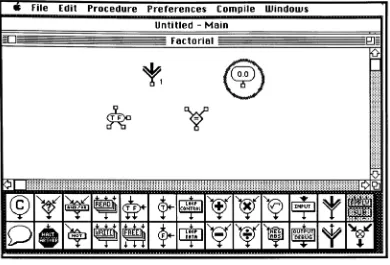
File Edit Procedure Preferences Compile Windows Untitled - Main
a
<E)
o
_____
Y
^
|flND/C>:|^
#*
f>
f
LOOM CONTtOlLOOP DOTH "T~
;:;:::|:!i:i|:-:; iiiiiiiiiiiiii
'
"tfflff^
BID
INPUT "T"OUTPUTI DEBUG _!f_j
Figure3.2-TheFlowGraph Screen
The FlowGraphscreen
display
consists offourmajor objects:themenubaratthetop
ofthescreen,agraphwindow,a nodepaletteandthecursor. Themenusinthemenu barperformfunctions of global nature such asopening
files,
translatinggraphsintotextual simulatorcommands,andsettinguser preferences. Agraph windowiswhere
It is the first window listed in the window menu. The graphs in the remaining
windowsrepresentprocedures.
Asademonstration of
FlowGraph,
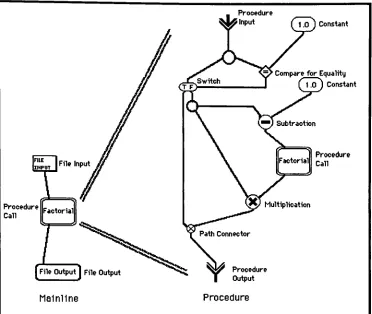
agraph programrepresentingthe calculation of afactorialwillbe drawn. Therecursivealgorithmforafactorial is:
mainline
input
(n)
factorial
(n)
output ("factorial =
",n)
end mainlinefactorial
(n)
if (n =
1)
thenreturn
(n)
else
return (n * factorial (n
-1))
end ifend factorial
FileInput
Procedure
Call Factorial
r
[File
Output]
FileOutputMainline
Procedure Input f 1
.0 ]Constant
/Compare forEquality 1.0 1 Constant
Procedure Call
[image:35.540.85.457.64.378.2]Multiplication
Figure 3.3- A DataFlow
Graph representingtheRecursiveFactorial Algorithm
3.1.3
Definitions
The definitionofsomefundimental terms isappropriate atthispoint. Anodeis the
pictorialrepresentaion of an operatorthat
typically
modifiesdataortheflowofdata. Anarc connects nodestogether,
describing
thepath ofdata betweennodes. Aportisthepointof connection ofaarctoanode. The typeandsemanticmeaningofthedata
are defined
by
the portthataccepts oremits the data tokento /from the node. Agraph isa collection of nodesand arcsthat describe the flow ofdata
during
the ex3,1,4
Creating
aProcedure
It ismostconvenienttocreateall oftheprocedure graphspriortocreating themain
programgraph. Itisnotabsolutelynecessaryto createthe entire procedure
graph,
however.
It is only necessary to specifyhowmanyinput and output ports are re
quiredofeachprocedure. Then the appropriatenumberofportswillberepresented
ontheprocedurenodewhenit isspecifiedina graph.
* File Edi t
bjiJinMnnTB
Preferences CompileID m New Procedure... K n ^^=
!.hanj;e Procedure
$ann>...
Os>isfc? Procedure.,.
Figure 3.4
-Creating
aNew Procedure WindowTo create a procedure graph, create a new procedurewindow with the "New Proce
dure"
commandin the "Procedure"
menu. (Figure 3.4). This creates a new window
with thename "Procedure #1". As new procedures are created
they
are identifiedwith sequentially higher numbers. To change the name ofa procedure, use the
"Change ProcedureName..."
commandin the"Procedure"menu. A
dialog
box isusedto type in thenew namefor theprocedurethatis the currentlyactivewindow(Figure
3.5). Press the OK button toacceptthenewnameorpressthecancelbuttontocancel
* File Edit Procedure Preferences Compile Windows
Entera new name for the current Procedure:
Factorial
Lsul
[
Cancel]
Figure3.5
-Setting
aProcedure'sNameIn the
dialog
boxespresentedtothe userby
FlowGraph,
there isusually onebuttonthatisoutlined. That indicates the buttonthatis"pressed"
when thereturn
key
ortheenter
key
is typedonthekeyboard. This isausefulshortcutin textentrydialog
boxes.
3.1.5
Working
withtheNode Palette
The actual creation ofthe graph isaccomplished
by
moving the appropriate nodesfrom the node palette into the graph window. To pull a copy of a node offofthe
palette, move the cursor overthe desired node in the palette,hold down the mouse
button, drag
the node to its desired location on the palette, and then release themousebutton. Whileyouare
dragging
anode, thenode will appear as a square outline (Figure 3.6). When the mouse button is released, the node will appear in the
File Edit Procedure Preferences Compile Windows
a
o
I__Q
.
[image:38.540.75.467.68.338.2]: ... .
...
!:!:':'::!::!:::>:' :. ..::.. . :: .::..:
(E)
Y
^
f
LOOMtOHTMU
Y
Tr^
injur^
O
^
MRJTfll ITJf
Loor l
p___ I
isa
OUTPUTI
W
V
*
Figure 3.6
-Placing
Primative Operation NodesfromthePaletteintotheGraphWindowTo createthe Factorial procedure, place an inputport connectornode and a switch nodein the Factorialgraph window as shown in Figure 3.7.
Factorial
&
f,
*
-0
.'_:':
mm
.
0
QAllofthe possiblenodes are not shownin thepalette. Nodes tend tobegroupedinto
"equivalent
groups", which are groups ofnodes with very similar characteristics.Examples ofequivalent groups include the mathematic operators, the conditional
operators andthebooleanoperators
(and,
or).Membersof an equivalentgroupcanbesubstitutedforeach otherinthegraph.
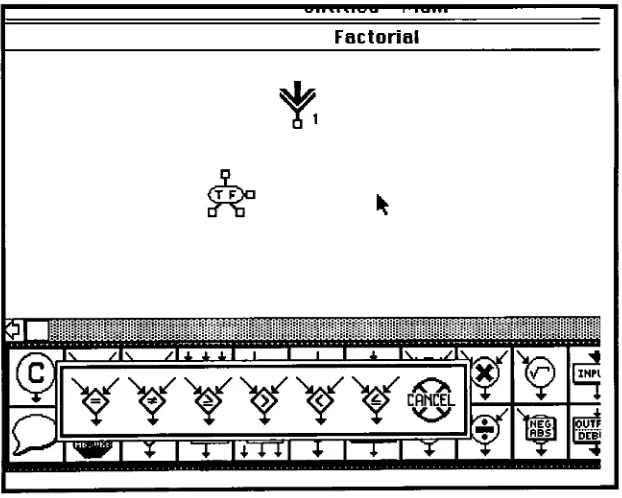
Toplace a noderepresentingaconditionaltestforequivalenceonthe graph,acopyof
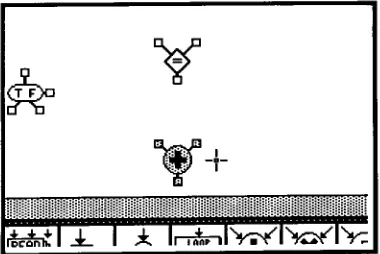
thegeneral conditionalispulledoffofthepalette anditsoutlineisusedtopositionit
in thegraph. When themousebutton isreleased,a"mini-palette"appears overthe
left side ofthenode palette (Figure3.8). Thismini-palette containsthemembers of
the equivalent group for the conditional node.
By
clicking on the appropriateconditional,thatconditionalisplacedin thegraph.
-e-i---j-r-^----T-Factorial
t
__ paaaat Li/iJCLLL'imil'I'll'L-LYL-jY^LiriV'.'l-iyi.LlLl.j.LLI.L'-L'.LL'.
@
P
I I i Li. jOx
w ^> <>? <X> <f> .
Wl
rI
T
U
IIII
[image:39.540.116.427.324.573.2]HT~ |~T
Figure 3.8
-"Mini-Palette"
MS
User
Preference^
Anumber ofuserpreferencefeaturesexistin FlowGraph. Oneoftheseistheability
tomakeaninvisiblegridin thegraph windowthatthe
nodeswill"snap"towhen
they
are placed or moved on the graph. This allows a cleaner, more organized graph.
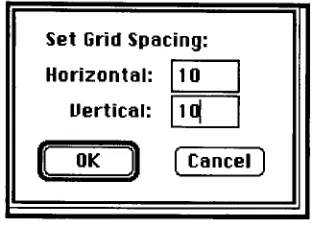
Selectthe"GridMode..."
commandfrom the "Preferences"
menu. A
dialog
box willappear as shownin Figure3.9. The spacing is thenumberof screen pixelsbetween
grid points. Ascreen pixelis 1/72of aninch. Thusa quarterinchsquare gridcanbe
specified with a settingof 18 pixels in both horizontaland vertical. Click the OK
buttonorpress returntoaccepttheentered value.
Set Grid Spacing:
Horizontal:
Vertical:
10
1<
[image:40.540.192.348.288.407.2]|
OK"~|
[
Cancel)
Figure 3.9- Grid
Dialog
Box3?1-?
Constant
:Nodes
Whena constant nodeisplacedin thegraph,it hasadefaultvalue of zero. To setthe
value ofa constantnode, double click onthe node. The
dialog
box shownin Figure3.10isusedto setboth thevalueandthe typeoftheconstant.
Typing
a number setsthe constant to have a
floating
point value.By
clicking on the True or the Falsebuttons,
abooleanconstantisdefined.Constant nodes are displayedin the graph with an attemptto
display
itsvalue aswell. Figure 3.11 showsthevaluedisplays foranumberof constant nodeswithdif
ferentvalues. Ifareal value cannotbe displayed in thenode because ofits
length,
Information fora Constant Node Ualue: 1.000000
OTrue
O
FalseI
OK)|
CancelFigure3.10
-Setting
thevalue ofaConstantNodeValue=10.000 Value=FALSE
zp
Gp
GD
Gp
p
After Value=TRUE Value-1 986 .75 Creation
Figure 3.1 1- Various Displaysof aConstantNode
Figure 3.12
-Adding
aConstant3.1.8
Changing
Nodes
onthe
Graph
Figure3.13
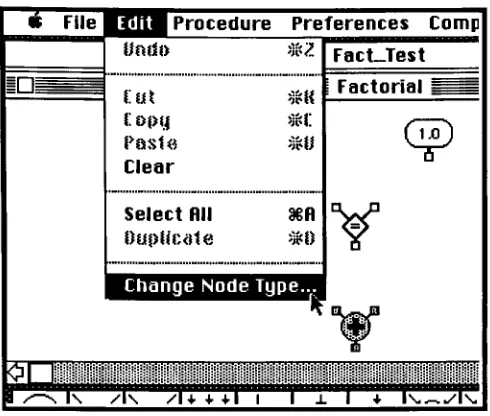
Actually,
asubtraction operatorisappropriatefortheFactorialalgorithm. Tochangeanode onthegraphto adifferent"equivalent"
type,
selectthenodeby
clickingoncein it. The node will indicate that ithas been selected
by being
displayed with agrayed"body"as shownin Figure 3.14. Inthe
"Edit"
menu,selectthe "Change Node
Type..."
item. (Figure 3.15). Amini-palette will appearshowing the equivalenttypes
forthe additionoperator. (Figure 3.16). Clickonthesubtractionnodetosubstituteit
for theaddition operator(Figure 3.17).
[image:43.540.156.385.65.290.2] [image:43.540.177.367.469.596.2]* File-IJ1MProcedure Preferences Comp
iimit) X-Z Fact_Test
in^nn
mi -mi
s: opy m:
Pasta Kit
Clear
! Factorial
Y
select mi senftepiicdle m)
Change Node Type...
t
or
.:i:;.;.:-.;.. :- . .: :;: : :i;!-:;:-:-:i:t::-i::-::i-ir::;;::::i;
f..m.
slN /l\ /I+++I i lxl + l\.m./l\,
Figure 3.15- The"ChangeNode
Type..."
fromtheEditMenuallowschangingSelectedNodeto another
"Equivalent"
Type.
Y
<H
O
Y^#
l^jrtjKll)iy-LOOP I
INTROI
LOOP DATA
i
i
i -nmi
i
it
[image:44.540.147.392.66.274.2]Figure 3.17- The GraphaftertheChange.
3.1.9
Adding
the Rest
oftheNodes
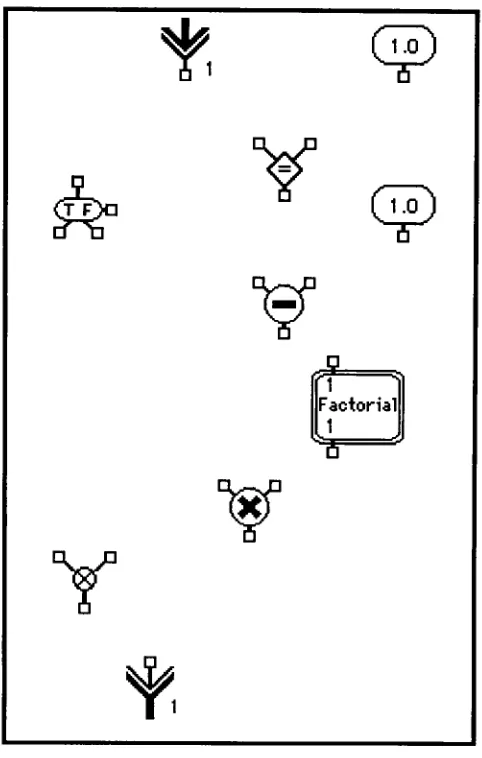
To finish adding therest ofthe elementaryoperatornodes, refer to Figure 3.18 for
their typeandlocation. Tomoveabout onthe graph, usethehorizontaland vertical
Figure3.18-NodeLayout fortheFactorialGraph
The scrollbars allowsthe user toplacethegraph window overanyposition onthe
large virtual graph plane.
Moving
the slider in a scroll bar moves a proportionalamount of distance in the "allocated graph
plane"
while pressing the arrowheads
moves the window overthevirtual graph planein smallincrements. The allocated
graph space is the theportion ofthevirtual graphplanethathasbeen allocatedto
theparticular graph. To increase theallocated planedimensions ofthegraph,press
the arrowheads ateitherend ofthe graph. This willallocate small amounts ofthe
virtual graph planeto thegraph and scrolloverthatareaoftheplane. Figure3. 19
showsthereleationshipoftheconceptsofthevirtualgraphspace,theallocated graph
[image:46.540.151.392.65.444.2]Virtual Graph Space
Window
Allocated Graph Space
Figure3.19- ComparisonofVirtual GraphSpace,Allocated Graph SpaceandtheGraphWindow
To add aproceduretothe graph,use the
Apply
operator. Aseach procedureiscreated,its nameisaddedto the"Procedure"menu.
By
selectingthename ofthepro cedureyou wanttoaddfrom the proceduremenu,anoderepresentingtheprocedure [image:47.540.62.479.80.406.2]File Edit -OTTCTW^IPreferences Co
NewProcedure...
Change Procedure Name...
in m
Delete Procedure...
Factorial
K
[image:48.540.176.364.355.444.2]\*r*r/
Figure 3.20
-Selecting
aProcedure Nametobe Addedto theGraphwiththeApply
Palette Operator
When there isnoprocedureisselectedinthe"Procedure"
menu, the
Apply
operatorisgrayed on the palette,
indicating
that it cannotbe selected. When a procedureisselected, a check mark appears
by
it inthe menu andtheApply
operatorbecomesavailableforuse (Figure3.21).
rv |\7
PQ JOQ
]
<f
in
u
^
IflPPLVlE1 SUBIBv
*
I
s&
vl
+
1
Figure 3.21- An Inactive
Apply
OperatorandanActiveApply
OperatorWhen the
Apply
operatoris draggedoff ofthepaletteandreleasedin thegraphwindow,
a node representingthe selected procedure iscreated. It is represented with adouble,
round cornerbox containing thename oftheprocedure and numberedinputand output port connections.PlaceaFactorialprocedure node onthegraph asshown
in Figure 3.22 to allow the use ofthe procedure recursively.
Any
number ofnodesrepresenting a selected procedure maybe added to the graph this way. To add a
differentprocedure, select anew namefrom the
"Procedure"
use the
Apply
operatorfrom thepalette. To deactivatetheApply
operator,selectthecurrent procedurefrom themenu again.
TaTTTTTfin"
[image:49.540.191.350.136.316.2]Y
|Factorial||
\Figure 3.22- AProcedure Node
3.1.11
Adding
Arcs
Arcs are drawn in the graph
by
moving the cursorinto a node port, pressing andholding
the mousebutton,
anddragging
thecursortoanappropriate portonanothernode. While the cursoris
being
dragged,
the arc isrepresentedby
a "rubberband"line (Figure 3.23). If the mouse button isreleased while the cursor is over an ac
ceptable port, the programredraws the arc as ajaggedline with darkenedports at
t,
[image:50.540.192.379.70.253.2]iRFnhitl^k.l
A.
ln^|>^|>M>:
Figure 3.23
-A"RubberBand" Arc
yii.i... ...>t...pr__.
Figure 3.24- A
Final,
Connected ArcFlowGraphusesa simple setofrulesfor addingarcstoa graph:
Aarc must connectanoutput portofone nodetoaninputport of another node.
Multiplearcs can eminatefrom anyoutput port(except from aconstant node).
Only
one arccanbeconnectedto any inputport.Theports
being
connectedmusthavethesamedatatype (booleanorreal). [image:50.540.199.368.299.476.2]windowarea, theportstobeconnected mustboth bevisiblein thegraph window at
thesametime.
Figure3.25-ConnectedFactorialGraph
In the Factorialexample,connectthenodesas shownin Figure 3.25.
Basedon the rules for connectingarcs,there are anumber ofapproaches thatgive
theuser afairamount offlexibility. Forexample, ifaSwitch operatorisused asa
deciderfor twodifferent datapaths, andthe results of either one orthe other data
pathneedstobeconnectedto theinputportofanode,thereisnowayto
directly
connectthe twoarcsto thesingleinputport.
However,
aconnectionnode existsthathastwoinputports andone output portwhich canbeusedto channelthe two alternate
[image:51.540.192.351.133.428.2]Somenodescanprocess eitherboolean or realdata. Ifanarc isdrawn between two
portsthatare notdefinedtohave aspecificdata
type,
adialog
boxwillbe presentedtopickthe typefor thearc. Thisdatatypewillthenbeassignedto theother relevant
ports onthenode as well. Forexample,the Switch operator nodecan switchthe in
putdata basedonthevalueofaboolean input. The inputdatacanbe eitherboolean
or real. Once an arc isconnected to either the inputportor one ofthe two output
ports, thedatatype for thatarcdetermines thedatatype thatmustbe connectedto
theotherportsonthenode. Ifan arcrepresentinga realdatatypeisconnectedto the
inputportofthe Switchoperatornode,theoutput portsofthe Switch willthencheck
forconnectionstoportsof anothernodethatacceptreal values. It ispossibleto turn
offthe type checkingwith the "Preferences"menu in FlowGraph. Inthe data flow
simulator,alldataobjects are processed as
floating
pointnumbers, whereavalue ofzeroisreturned
by
abooleanexpression thatevaluatedtofalse and anon-zero valueisconsideredtobetrue.
Circumventing
type checkingisnotrecommended,however.To
help
connect portsina largegraph, thegraph windows can be zoomedouttofilltheentire screen spaceusingthezoombox intheupperrighthandcorner ofagraph
windowstitle bar. Figure 3.26 showsthe standard window which exposesthenode
# File Edit Procedure Preferences Compile LUindoms
Fact_Test
Factorial IHI
O
l__s
O
YY^
|lHPUT|^
flPPLVI SUB I
+ . OUTPUT
^
3.1.12
Editing
Arcs
Figure 3.28showsan arcthathasbeen
incorrectly
connectedfrom the true sideofaSwitch operatorto the multiplication operator. To selectan arc, click on the input
portthatitconnectsto. Aselected arcis displayedas a grayedline (Figure3.29). To
remove the arc, select the "Clear" menu item from the "Edit"
menu or press the
backspace key. This approachofselectan objectand
deleting
itworksfornodesaswell. If the shift
key
is held down while selectingobjects, multiple objects maybeselected at onetime.
Figure3.28- Thearcbetweenthe 'True"
outputportoftheSwitch Nodeshouldnot goto the Multiplicationnode.
* File Procedure Preferences Comp
Undo s3i2! Fact_Test
Select Rll sen
Change Node Type
Figure3.30- Delete
aSelected Arc (or
Node)
by
usingtheClearmenuitem.3.1.13
The
Main Program Graph
Figure 3.31 shows the main program in itsgraphwindow. After creatingthe Fac
torial procedure graph, activate the main window
by
clicking somewhere on thewindow or
by
selecting themain graph windowfromthe"Windows"menu. Themain [image:55.540.146.394.101.308.2]y~ File Edit Procedure Preferences Compile Windows
Fact-Test
|FILE
1|
1
Factorial1
o
[File
Output]
a
a
(E)
Y
w
#*
f
I LOOP iCOHTKOtl
UJJLJ
Y^^>
P
BRnTl[*TT
f
I LOOP I
I MTU I OUTPUT]DEBUGI
Figure3.31-The Main Program Graph
AsFigure 3.31 shows, theprocedureinput/output connectorsinthenode palette are
grayedbecause
they
are not availableinthemain program graph.Themain program shouldhaveafile inputnode which willbeused asthetriggerfor
thegraph execution
by
thesimulator.When the output nodeiscreated, theuser will beaskedto supply thenumber ofI/O
ports required. For thisexample, one port was specified.
By
double clickingonthefile output node,a window will open to enter the textofanymessagetobe printed
[image:56.540.73.466.71.335.2]-JUAJSetting
Trace Options
Before generatin