Abstract: In present decade, identification of abnormalities in brain gains significant attention for medical diagnosis. Though numerous existing models are available, only a few methods have been proposed which classifies a set of different kinds of brain defects. This paper introduces an efficient hybridization model for classifying the provided MR brain image as normal or abnormal. The presented model initially makes use of digital wavelet transform (DWT) for extracting features and utilizes principal component analysis (PCA) for feature space reduction. Next, a kernel support vector machine (KSVM) with radial basis function (RBF) kernel is built by artificial bee colony (ABC) for optimizing the parameters namely C and σ. For experimentation, 5-fold cross validation procedure is involved and a detailed investigation of the results takes place by comparing it with the existing models. To select the parameters, ABC algorithm has undergone a comparison with the random selection approach. The presented model is tested using a benchmark MR brain dataset. The experimental values indicated that the ABC is highly efficient for constructing optimal KSVM.
Keywords: Brain stroke; Artificial Bee Colony; Support Vector Machine; MRI; Classifier.
I. INTRODUCTION
Basically, health is treated as a significant part in day to day life, and there is a requirement to develop a recording model to track data on diseases and their relationship among them. Many of the information related to the diseases can be identified from the patient case history, medicinal reports and laboratory test results. The information hidden in the details can be revealed by the use of different text mining and machine learning (ML) techniques. To extract the features and classify the medical data, numerous ML algorithms have been presented and available in the literature [1]. Stroke is a common term among the physicians to explain the brain and spinal cord resulting to abnormal blood circulation. Human brain maintains all the activities of the human from breathing, walking, sensing, and so on. In the last five decades, it is reported that the death rate is increased to ten times higher in developing countries because of stroke and also predicted that it will increase drastically by the year of 2030. In generally,
Revised Manuscript Received on September 03, 2019
*S. Manikandan, Assistant Professor, Department of CSE, D.D.E, Annamalai University, Annamalai nagar, Tamilnadu, India. Email: [email protected]
P. Dhanalakshmi, Professor, Department of CSE, Annamalai
the stroke can be divided into three kinds namely ischemic stroke (IS), hemorrhagic stroke (HE), and transient ischemic attack (TIA).
IS is the basic kind of stroke occurs commonly in real time. The study reported that 87% of stroke is IS that happens in case of the presence of coagulate or any obstruction in a blood vessels of brain. IS is again divided into two types namely embolic and thrombotic stroke [2]. The former one happens when a clot is created in any parts of the body and it shifts in the direction of the brain and block the blood flow. The latter one occurs because of a clot which reduces the flow of blood flow in an artery that takes the blood to the brain. HE happens in case of the splitting or bursting of weak blood vessels. A lower percentage of 10–15% HE happens compared to other kinds. However, the death rate is higher compared to IS. HS can also be divided into two kinds namely subarachnoid hemorrhage and intracerebral hemorrhage. TIA can be defined as a ‘‘mini-stroke,’’ that happens because of a clot. TIA is an impermanent obstruction related to diverse kinds of stroke which last only for a short duration of <1 minute and the symptoms vanish in the next 24 hours. It does not create any everlasting damage to the brain or tissues; but, TIA is treated as a caution for existence of a further stroke in the upcoming days. Stroke can be treated as a main fatal disease. This paper focuses to develop techniques for extracting the features and also classify the kinds of stoke.
Magnetic resonance imaging (MRI) generates high quality images of the anatomical structure of the human body, particularly brain, and offers detailed medical data for medical analysis and biomedical study. The analytical values of MRI are significantly exaggerated by the automatic and precise categorization of MRI images. Wavelet transform is the efficient method to extract features from MR brain images due to the fact that it enables investigation of images at different levels of resolution because of its multi-resolution analytical features. But, this method needs massive memory and high computation complexity. For reducing the feature vector dimensions and enhance the discriminative power, the principal component analysis (PCA) method is employed as it efficiently minimizes the data dimensionality and hence decreases the computation cost of investigating new data. Next, the issue is to determine the method to perform data classification. Recently, two
types of methods namely
An Efficient Brain Stroke Image Classification
Model Based on Artificial Bee Colony
Optimization with Kernel Support Vector
Machine
presented. The former model includes support vector machine (SVM) and -nearest neighbors ( -NN). The latter model include self organization feature map (SOFM) and fuzzy -means. Though these approaches attain better performance, the supervised classification model leads to higher classifier results over the unsupervised model. From the numerous supervised classifier approaches, SVM is very popular and effective model. On comparing with other ML based classifiers, SVM offers more benefits include more precise, simple mathematical tractability, and direct geometric understanding. In addition, there is no requirement of any training samples to eliminate overfitting [3].
This study introduces an efficient hybridization model called ABC-KSVM for classifying the provided MR brain image as normal or abnormal. The presented model initially makes use of digital wavelet transform (DWT) for extracting features and utilizes principal component analysis (PCA) for reducing the feature space. Next, this study introduces a modified version of SVM called kernel SVMs (KSVMs), converting the linear SVM into nonlinear one by employing the kernel function for replacing the dot product form in the traditional SVM [4]. Here, KSVM is built utilizing artificial bee colony (ABC) for optimizing the parameters namely C and σ. For experimentation, 5-fold cross validation procedure is involved and a detailed investigation of the results takes place by comparing it with the existing models. To select the parameters, ABC algorithm has undergone a comparison with the random selection approach. The presented model is tested using a benchmark MR brain dataset. The experimental values indicated that the ABC is highly efficient for constructing optimal KSVM.
The remaining portions are structured here. Section 3 gives discusses the presented ABC-KSVM. Section 4 discusses the experimentation analysis and Section 5 draws the conclusion.
II. RELATEDWORKS
In literature, numerous ML based prediction models for stroke are available and some of the related works are discussed here. An earlier work employed artificial neural networks (ANN) method which undergone training by the use of six various multilayer perceptron (MLP) models for predicting the death rate of stokes patients produced a classifier rate of 80.7% [5]. [6] make use of SVM, kNN and ANN for automating the identification process of IS that recommended that SVM attained better classifier results. [7] presented a prediction model for stroke utilizing KNN and C4.5 DT model and revealed that C4.5 DT yields better detection rate of 95.42%.
[8] applied ML models and SVM for predicting the results of thrombolysis that exhibited the betterment of SVM. [9] projected an IS prediction model utilizing two ANN techniques which offers the detection rate of 79.2% and
95.1% respectively. Another study makes use of ANN and SVM for forecasting the occurrence of stroke. The outcome recommended that ANN shows higher predictive results compared to other models. [10] employed a set of nine classifier models for classifying IS.
[11] applied DT, naive Bayes, and ANN for predicting stroke and identified the higher classifier results of DT over the compared models. [12] employed regression tree, multiple linear regression (MLR) and kNN for predicting stroke and ensured that the kNN offers better classifier results over the compared methods. [13] also projected a prediction technique using ANN, SVM, ensemble approach generalized boosted model (GBM), DT, logistic regression (LR), for predicting the ICU relocation of stroke patients. This study suggested that the applied GBM model offers better classification.
[14] classified the kinds of stroke by the use of ML algorithms using DT and KNN. They studied that the DT offers higher classifier performance over the KNN model. Another work stated that the etiology of the stroke patients are still not clear even in the presence of different diagnostic methods for IS detection [15]. The study reported the significance of the phenotypic form of classifying stroke and it explains the absence of trustworthiness in results. [16] introduced a stroke prediction model by the use of deep learning. The facts related to the issues in healthcare sector cannot be identified properly using the conventional prediction techniques. This work reported that precise results are attained compared to a scoring system in the healthcare sector for stroke prediction. A survey is done under various aspects stated that in Asian countries, more number of people is vulnerable to the occurrence of IS. The study also reported that the demand of neurologists will be increased to three times [17].
III. THEPROPOSEDMETHOD
Fig. 1 Overall Process of the Proposed Work
A. Pre-processing 1) Feature Extraction
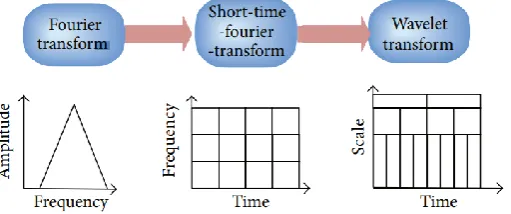
Fourier transform (FT)is the traditional method for signal analysis that divides the signal from time domain to constituent sine waves of diverse frequencies, therefore the signal will be converted to frequency from time domain. But, FT faces a main limitation of eliminating the time information of the signal. Here, the classifier results get reduced by the loss of time information. Gabor applied the FT to investigate a small section of the signal at a time. This method is termed as windowing or short-time Fourier transform (STFT) which
appends a window of specific shape to the signal. SIFT can be treated as a compromise among the time as well as frequency details. It offers few details about the time as well as frequency domain. But, the correctness of the details is constrained by the window size. Wavelet transform (WT) is represented as a windowing technique with dynamic size. Hence, it holds time as well as frequency details of the signal. The process involved in the design of signal analysis is depicted in Fig. 2.
Fig. 2. Design of signal analysis 2) DWT
An important implementation of WT is DWT by the use of dyadic positions as well as scales. It is fundamentally defined as: Let us consider x(t) is a square integrable function, then continuous WT of x(t) relative to a certain wavelet ψ(t) can be represented as given in Eq.
(1):
Where
At this point, the wavelet ψ_(a,b) (t) is determined from the parent wavelet ψ(t) by translation and dilation: a is the dilation factor, and b is the translation parameter. Numerous types of wavelets have acquired familiarity by the design of wavelet analysis. An essential wavelet type is Harr wavelet, an easier and mostly used wavelet type. Eq. (1) can be represented in discrete form as given in Eq. (3):
[image:3.595.174.430.434.541.2]Where ca_(j,k) and cd_(j,k) indicates the coefficients of the approximation and detail components, correspondingly. And, g(n) and h(n) indicates the low-pass as well as highpass filter, jand k indicates the wavelet scale and translation factors, correspondingly. The entire procedure of decomposition can
[image:4.595.215.418.132.318.2]be repeated with successive approximations so that an individual signal can be partitioned into different resolution levels. This procedure is known as wavelet decomposition tree as depicted in Fig. 3.
Fig. 3. 3-level wavelet decomposition tree
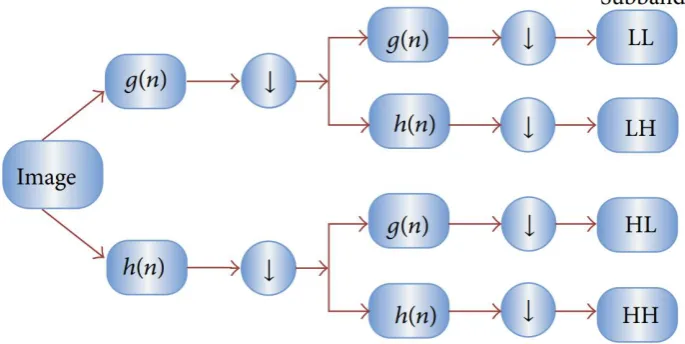
3) 2D-DWT
DWT is employed to every dimension in an individual way in case of 2D images as shown in Fig. 4. Consequently, collection 4 sub-bands (LL,LH,HH,and HL) will be generated for every scale and sub-band LL is employed for the subsequent 2D-DWT. The LL subband is treated as an approximation component of the image, where the LH, HL and HH subbands are assumed as the comprehensive image components. When the decomposition level is raised, coarser approximation component will be attained. Hence, the wavelet offered an easier hierarchical model to interpret the
details of the image. In this study, a 3-level decomposition using Harr wavelet is applied for feature extraction.
4) Feature Reduction
The unnecessary features can lead to increased computation complexity and more memory. In addition, the classification process becomes difficult termed as curse of dimensionality. Hence, it is needed to minimize the number of features. PCA is an effectual way for reducing the data dimensionality containing many correlated variables. It is attained by converting the dataset to a novel collection of ordered variables based on the variance or significance.\
Fig. 4. Graphical representation of 2D-DWT
B. SVM Classifier
Presently, many enhanced versions of SVM (KSVM) have been developed and the kernel SVM is one of them which are famous and efficient. The KSVM offers many benefits:
performs well in different application domains of natural
language processing,
[image:4.595.132.475.523.695.2]and (3) training mostly applies convex quadratic optimization. Therefore, global solutions are obtained, hence, eliminating the convergence to local minimum shown by other statistical learning methods like NN.
1) Principles of Linear SVMs
Let -dimensional training dataset of size is defined in the form
where y_n is either -1 or 1 indicating the class 1 or 2. Every x_n is a p-dimensional vector. The maximum-margin hyperplane partitions the class 1 from class 2 is the function of
SVM. Generally, the hyperplane can be defined as given in Eq. (5):
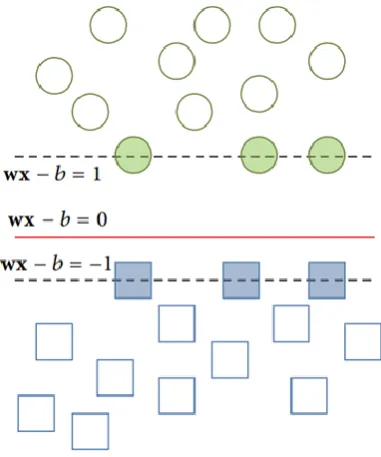
[image:5.595.200.391.198.427.2]where ⋅ indicates the dot product and w represents the normal vector to the hyperplane. It is needed to select w and b for maximizing the margin among two parallel hyperplanes (as shown in Fig. 5). Thus, two hyperplanes can be written as follows:
Fig. 5. Parallel hyperplanes
So, the process can be considered as an optimization problem, i.e. intention is the maximization of the distance among the two parallel hyperplanes, subjecting to avoid the data falling into the margin. By the use of simple mathematical knowledge, the problem can be defined as
Practically, the undergone a replacement with
2) Soft Margin
But, in real time, there might be no existence of hyperplanes which could divide the samples effectively. At that point, soft margin technique can be applied which selects a hyperplane for splitting the provided samples with a constraint of the maximization of the distance to the closest cleanly split samples. Positive slack variable ξ_n is employed to determine the degree of misclassification for the sample x_n. Next, the optimum hyperplane untying the data can be attained using Eq. (9):
where C is the error penalty. So, the optimization becomes compromise a tradeoff among a large margin and small error penalty. The constraint optimization problem can be resolved by the use of “Lagrange multiplier” as given below.
The min-max issue is hard to resolve; hence, a dual form approach is applied to resolve it.
3) Dual Form
The dual form of Eq. (9) can be formulated as follows.
C.PSO-KSVM 1) Kernel SVM
For generalizing to nonlinear hyperplane, the kernel trick is employed to SVM. The resultant technique is identical, apart from that each dot product undergo a replacement with a nonlinear kernel function. The KSVM enables the fitting the maximum-margin hyperplane in a transformed feature space. The conversion might be nonlinear, and the transformed space may be higher dimensional. For every kernel, there should be minimum one adjusting parameter for providing flexibility and adapting itself to practical data. Here, RBF kernel is selected because of its better results. The kernel can be represented in Eq. (12).
It is still required to choose the parameter values for C and σ in (12).
2) ABC algorithm
ABC algorithm follows the intelligent foraging nature of honey bees. A swarm of honey bees has the ability to complete task via social cooperation. Generally, three kinds of bees are present in ABC algorithm namely employee bees, onlooker bees, and scout bees. The employee bee searches food around the food source in their memory and transmit the details of the food sources to the onlooker bees which has the ability to choose better one identified from the employee bees. The food source which holds maximum quality (fitness) has a higher probability of being chosen by the onlooker bees. The scout bees are converted from a smaller number of employees that throw out the food sources and look for fresh ones.
Around half of the group comprises of employee bees and other half holds onlooker bees. The number of employee or onlooker bees is almost identical to number of solutions in the swarm. ABC produces a set of arbitrarily distributed initial population of SN solutions where SN indicates the swarm size.
Let X_i = {x_(i,1), x_(i,2),...,x_i,D} represents the th solution in the swarm, where is the dimension size. Every employee bee X_i creates a new candidate solution V_i in the nearby area of current position as given below.
where X_k is a arbitrarily chosen candidate solution (i≠
k),j is a arbitrary dimension index chosen from set {1,2,...,D}, and ϕ_(i,j)is a arbitrary number lies in the range of −1 to 1. When the new candidate solution V_i is produced, a greedy selection technique is applied. When the fitness value of V_i is found to be better than that of its parent X_i, then X_i gets updated with V_i; else X_iremains same.
Once the employed bees performing the searching procedure, information sharing will takes place about the food sources with the onlooker bees utilizing a kind of waggle dance. The onlooker bee determines the nectar details from every employee bees and selects a food source with a probability relevant to its nectar quantity. This probabilistic selection is generally takes place by the use of roulette wheel selection strategy as equated below:
When a position could not be enhanced over a fixed number of cycles, then the food source is discarded. Consider that the discarded source is X_i, then the scout bee explores a new food source to be replaced with X_i as given below.
where rand (0, 1) is a random number lies in the range of 0 and 1 depending upon a normal distribution, lb and ub are lower and upper boundaries of the th dimension, correspondingly.
3) Cross-Validation (CV)
This study makes use of 5-fold CV to split the dataset for training and testing purposes. It is used to maintain a tradeoff between computation cost and reliable estimation. In 5 fold CV, the dataset is arbitrarily partitioned into 5 exclusive subset of around equivalent sizes where the first 4 subsets are employed as training set and final one is applied for validation purposes. This process is repeated over five times so as every subset can be employed for validation. The fitness function of ABC algorithm under 5-fold CV is represented as
Where y_s and y_m indicates the number of successful classification and misclassification, correspondingly. ABC algorithm is executed for the maximization of the fitness function (classifier results).
IV. PERFORMANCEANALYSIS A. Dataset used
Table 1 Dataset Description
Categories of MR Images Dimensions No. of Images
Category 1: Normal Category 2: Abnormal
[image:7.595.85.521.179.510.2]256*256 450
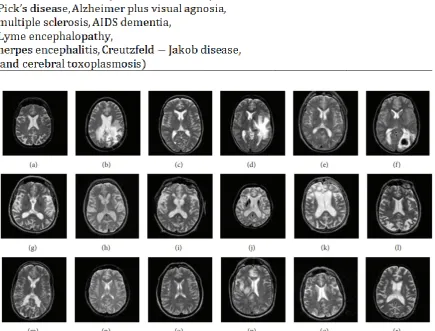
Fig. 6. Sample test brain MRIs B. Results analysis
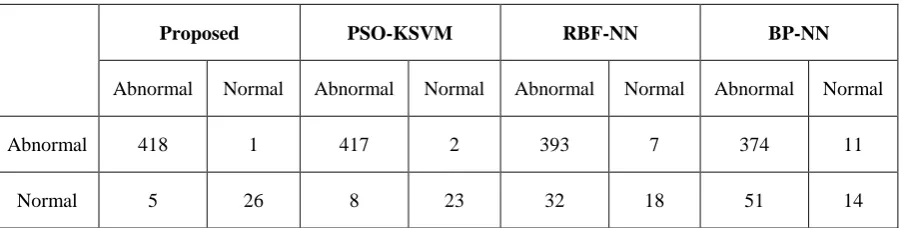
Basically, the classifier performance can be determined by the use of confusion matrix. The confusion matrix is derived for proposed model, existing methods such as PSO-KSVM, RBF-NN and BP-NN as shown in Table 2. From this table, it is obviously clear that the ABC-KSVM model accurately predicts 418 and 26 instances as abnormal and normal
Table 2 Confusion Matrix
Proposed PSO-KSVM RBF-NN BP-NN
Abnormal Normal Abnormal Normal Abnormal Normal Abnormal Normal
Abnormal 418 1 417 2 393 7 374 11
Normal 5 26 8 23 32 18 51 14
Next, the number of success cases, i.e. number of instances which are predicted correctly by diverse models are presented in Table 3. From the table, it is evident that the presented ABC-KSVM mode shows maximum number of success cases whereas the BP-NN shows minimum number of success cases. The PSO-KSVM shows competitive performance with the presented model and achieves somewhat higher number of success cases. However, the presented ABC-KSVM shows better results with the maximum of 444 success cases on the applied test images.
Table 3 Comparison of Success Cases
S. No Methods Success Cases
1 Proposed 444
2 PSO-KSVM 440
3 RBF-NN 411
[image:8.595.183.413.256.372.2]4 BP-NN 388
Table 4 Comparison of various measures with on existing and proposed method
Methods Sens. Spec. Accu. F-Score AUC MCC Kappa
Proposed 98.79 96.29 98.65 99.27 97.54 0.89 88.93
PSO-KSVM 98.11 92.00 97.78 98.81 95.05 0.81 80.97
RBF-NN 92.47 72.00 91.33 95.27 82.33 0.46 48.83
BP-NN 88.00 56.00 86.22 92.34 72.00 0.28 25.10
Next, Table 4 provides a comprehensive comparative study of different prediction models on the applied dataset. As shown in table, a set of measures namely sensitivity, specificity, accuracy, F-score, Area under curve (AUC), Mathew Correlation Coefficient (MCC) and kappa value are used for analysis. The values of these measures should be as high as possible for effective classifier results.
Fig. 7 investigates the results obtained by diverse models interms of sensitivity and specificity. As shown in figure, it is evident that the existing BP-NN model shows worse results by attaining the sensitivity and specificity of 88.00 and 56.00 respectively. At the same time, the RBF-NN manages to perform well compared to BP-NN with the sensitivity and specificity of 92.47 and 72.00 respectively. Though these values found to be higher than BP-NN, the PSO-KSVM and proposed model attains higher values of sensitivity and specificity. In line with, the PSO-KSVM model exhibits better classification with sensitivity and specificity of 98.11 and 92.00 respectively. But, it is interesting that the presented ABC-KSVM model attained maximum performance with the sensitivity and specificity values of 98.79 and 96.29 respectively.
[image:8.595.72.535.396.514.2]Fig. 7. Result analysis of diverse classifier with respect to sensitivity and specificity
Fig. 8. Results analysis of different classifier interms of accuracy and F-score
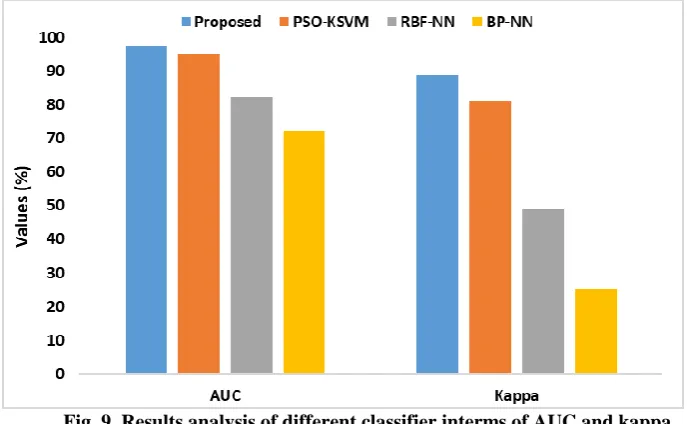
Fig. 9. Results analysis of different classifier interms of AUC and kappa Though these values found to be higher than BP-NN, the
PSO-KSVM and proposed model attains higher values of accuracy and F-score. In line with, the PSO-KSVM model exhibits better classification with accuracy and F-score of 97.78 and 98.81 respectively. However, it is fascinating that
performance with the accuracy and F-score values of 98.95 and 99.27 respectively.
[image:9.595.126.470.495.707.2]Fig. 9 illustrates the comparative study of various methods with respect to AUC and kappa. As shown in figure, it is evident that the existing BP-NN model shows poor performance by obtaining the AUC and kappa of 72.00 and 25.10 respectively. At the same time, the RBF-NN manages to perform well compared to BP-NN with the AUC and kappa of 82.33 and 48.83 respectively. Though these values found to be higher than BP-NN, the PSO-KSVM and proposed model attains higher values of AUC and kappa. In line with, the PSO-KSVM model exhibits better classification with AUC and kappa of 95.05 and 80.97 respectively. However, it is fascinating that the presented ABC-KSVM model attained maximum performance with the AUC and kappa values of 97.54 and 88.93 respectively.
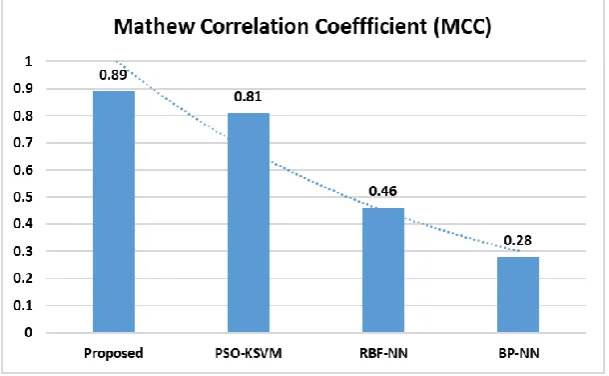
[image:10.595.146.451.231.419.2]Finally, a detailed analysis of various classification models interms of MCC is provided in Fig. 10. As shown in figure, it is evident that worse results are attained by BP-NN which is verified from the lowest value of 0.28 MCC. Next to that, the RBF-NN model exhibits somewhat better results compared to BP-NN with the MCC value of 0.46. But, the PSO-KSVM shows higher value of 0.81MCC over RBF-NN and BP-NN models. At the same time, the presented ABC-KSVM model exhibits maximum classification performance over the compared methods with the highest MCC of 0.89. The experimental values obtained by the extensive simulation confirmed the superiority of the presented model over the compared method under several aspects on all the applied MR brain images.
Fig. 10. Results analysis of different classifier interms of MCC
V.CONCLUSION
This paper has introduced an efficient an efficient hybridization model named as ABC-KSVM model for classifying the provided MR brain image as normal or abnormal. The presented model initially makes use of DWT for extracting features and utilizes principal PCA to reduce feature space. Then, a KSVM with RBF kernel is developed using the ABC algorithm for parameter optimization. The tested benchmark dataset from Harvard Medical School comprises a collection of 450 MR brain images. The presented ABC-KSVM shows better results with the maximum of 444 success cases on the applied test images. The experimental outcome confirmed that maximum classification performance is attained with the sensitivity value of 98.79, specificity value of 96.29, accuracy of 98.65, F-score of 99.27, AUC of 97.54, MCC of 0.89 and 88.93 respectively. In future, the efficiency of the presented model can be enhanced by the use of image segmentation process.
REFERENCES
1. Pahus SH, Hansen AT, Hvas AM (2016) Thrombophilia testing in young patients with Ischemic stroke. Thromb Res 137:108–112 2. Dupont SA, Wijdicks EF, Lanzino G, Rabinstein AA (2010)
Aneurysmal subarachnoid hemorrhage: an overview for the practicing neurologist. Semin Neurol 30(5):45–54
3. D. Li, W. Yang, and S. Wang, “Classification of foreign fibers in cotton lint using machine vision and multi-class support vector
machine,” Computers and Electronics in Agriculture, vol. 74, no. 2, pp. 274–279, 2010.
4. R. Hable, “Asymptotic normality of support vector machine variants and other regularized kernel methods,” Journal of Multivariate Analysis, vol. 106, pp. 92–117, 2012.
5. Su¨t N, C¸ elik Y (2012) Prediction of mortality in stroke patients using multilayer perceptron neural networks. Turk J Med Sci 42(5):886–893 6. Rajini NH, Bhavani R (2013) Computer aided detection of ischemic
stroke using segmentation and texture features. Measurement 46(6):1865–1874
7. Amini L, Azarpazhouh R, Farzadfar MT, Mousavi SA, Jazaieri F, Khorvash F, Norouzi R, Toghianfar N (2013) Prediction and control of stroke by data mining. Int J Prev Med 4(2):S245
8. Bentley P, Ganesalingam J, Jones AL, Mahady K, Epton S, Rinne P, Sharma P, Halse O, Mehta A, Rueckert D (2014) Prediction of stroke thrombolysis outcome using CT brain machine learning. NeuroImage Clin 4:635–640
9. Cheng CA, Lin YC, Chiu HW (2014) Prediction of the prognosis of ischemic stroke patients after intravenous thrombolysis using artificial neural networks. Stud Health Technol Inform 202:115–118 10. Maier O, Schro¨der C, Forkert ND, Martinetz T, Handels H (2015)
Classifiers for ischemic stroke lesion segmentation: a comparison study. PLoS ONE 10(12):e0145118
11. Kansadub T, Thammaboosadee S, Kiattisin S, Jalayondeja C (2015) Stroke risk prediction model based on demographic data. In: Biomedical engineering international conference (BMEiCON), pp 1–3 12. Sung SF, Hsieh CY, Yang YH, Lin HJ, Chen CH, Chen YW, Hu YH
(2015) Developing a stroke severity index based on administrative data was feasible using data mining techniques. J Clin Epidemiol 68(11):1292–1300
13. Alotaibi NN, Sasi S (2016) Stroke in-patients’ transfer to the ICU using ensemble based model.
techniques (ICEEOT), pp 2004–2010
14. Adam SY, Yousif A, Bashir MB (2016) Classification of ischemic stroke using machine learning algorithms. Int J Comput Appl 149(10):26–31
15. Radu RA, Terecoasa˘ EO, Ba˘jenaru OA, Tiu C (2017) Etiologic classification of ischemic stroke: where do we stand. Clin Neurol Neurosurg 159:93–106
16. Chantamit-O-Pas P, Goyal M (2017) Prediction of stroke using deep learning model. In: Liu D., Xie S, Li Y, Zhao D, El-Alfy ES (eds) Neural information processing ICONIP, Lecture notes in computer science 10638
17. Suwanwela NC, Poungvarin N, The Asian Stroke Advisory Panel (2016) Stroke burden and stroke care system in Asia. Neurol India 64:46–51
![Poly[tetrakis(μ cyclohexane 1,4 dicarboxylato)di μ hydroxido pentazinc(II)]](data:image/gif;base64,R0lGODlhAQABAIAAAP///wAAACH5BAEAAAAALAAAAAABAAEAAAICRAEAOw==)