The Relation between Urban and Building Form,
Microclimate, and the Energy Consumption of
Buildings: A Structural Equation Modeling (SEM)
Analysis
Gunwon Lee, Yunnam Jeong
Abstract This study investigates urban design elements such as urban and building form and microclimate, which have been establish in previous research as well-known factors affecting the energy consumption of buildings, and structuralizes the relation-ship between these variables. In particular, it focuses on the me-diating relationship between urban and building form and envi-ronmental variables and microclimate. To this end, the energy consumption of selected buildings within a radius of 500 meters of 23 Automated Weather Stations (AWS), measurement points selected by the Meteorological Office of the City of Seoul, in Au-gust of 2017 was analyzed. The study employed structural equa-tion modelling (SEM), a method that structuralizes the relaequa-tion- relation-ships of different variables. The results show that there is a po-tential correlation among urban elements, vegetation and shade elements, and public space elements; the same is true for the relation between public space and façade elements. It was also found that microclimate plays a mediating role when urban ele-ments, public space eleele-ments, and vegetation and shade elements affect the energy consumption of buildings. This study is mean-ingful in that it contributes to the establishment of a foundation for a realistic and comprehensive plan to manage the energy consumption of buildings by summarizing and structuralizing the results of previous research.
Keywords: Urban design, SEM (Structural equation modeling), Buildings energy consumption, Urban form and tissue, Building form and character.
I. INTRODUCTION
Since the publication of Silent Spring by Rachel Carson in 1962, environmental movements and policies have been continuously pursued. This trend has impacted various fields, including urban architecture, which addresses spaces of daily life. Recognizing the limits of the natural environment, which had once been taken for granted, the urban architecture field has been seeking ways to pro-mote the coexistence of the natural environment with the built environment. As part of this endeavor, research has been conducted on the destruction and disturbances in the natural environment resulting from excessive development of the built environment, such as energy issues, pollution, sprawling development, and urban heat islands. Related rules and regulations have been implemented as well.
Still, in-depth research on the complex patterns and forms of the built environment has not yet been performed. In other words, specific research that is dedicated to the effects that global ele-ments such as urban form, envelope, and spatial structure and building form character have on the energy consumption of build-ings does not exist. Most of the studies performed have been con-ceptual research that merely reveals a correlation among these elements. Quantitative analysis on their comprehensive relations has not been sufficiently conducted.
In this light, this study aims at investigating the influential relations between global elements and regional elements that affect the en-ergy consumption of buildings and thereby reveal comprehensive methods to reduce the energy consumption of urban buildings.
II. LITERATURE REVIEW
2.1. Literature review
As factors affecting the energy consumption of buildings, this study focuses on global elements such as urban elements, public space, and vegetation and shade, along with regional elements including mass and façade elements and microclimate.
Various research has been published indicating that these elements have an impact on microclimate and the energy consumption of buildings.
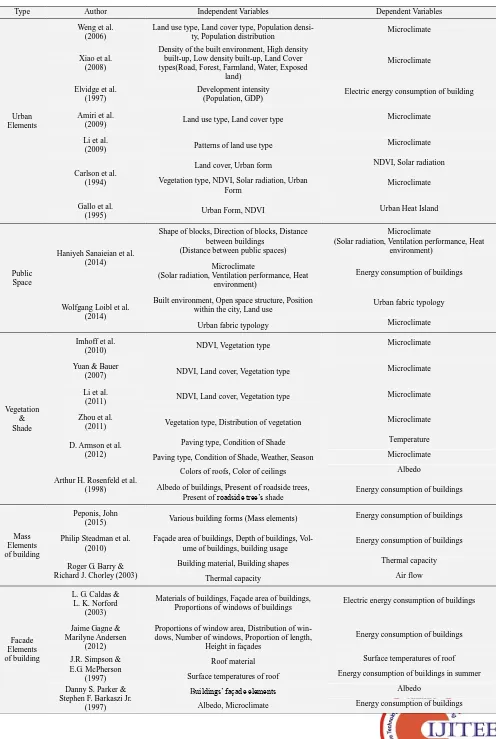
First, research has been reported that focused on the effect of urban elements and microclimate on the energy consumption of buildings. Weng et al. (2006) investigated data on the city of Indianapolis to observe the impact of land use and land cover on microclimate. He further discovered that variables such as population density and distribution influence one another. Xiao et al. (2008) analyzed the effect of the density of the built environment on microclimate by adding variables such as high and low density built-up in addition to road, forest, farmland, water, and exposed land. Elvidge et al. (1997) analyzed the relations between variables representing de-velopment intensity, such as population and GDP,
Table 1: Literature review
Type Author Independent Variables Dependent Variables
Urban Elements
Weng et al. (2006)
Land use type, Land cover type, Population
densi-ty, Population distribution Microclimate
Xiao et al. (2008)
Density of the built environment, High density built-up, Low density built-up, Land Cover types(Road, Forest, Farmland, Water, Exposed
land)
Microclimate
Elvidge et al. (1997)
Development intensity
(Population, GDP) Electric energy consumption of building
Amiri et al.
(2009) Land use type, Land cover type Microclimate
Li et al.
(2009) Patterns of land use type Microclimate
Carlson et al. (1994)
Land cover, Urban form NDVI, Solar radiation
Vegetation type, NDVI, Solar radiation, Urban
Form Microclimate
Gallo et al.
(1995) Urban Form, NDVI Urban Heat Island
Public Space
Haniyeh Sanaieian et al. (2014)
Shape of blocks, Direction of blocks, Distance between buildings
(Distance between public spaces)
Microclimate
(Solar radiation, Ventilation performance, Heat environment)
Microclimate
(Solar radiation, Ventilation performance, Heat environment)
Energy consumption of buildings
Wolfgang Loibl et al. (2014)
Built environment, Open space structure, Position
within the city, Land use Urban fabric typology
Urban fabric typology Microclimate
Vegetation & Shade
Imhoff et al.
(2010) NDVI, Vegetation type Microclimate
Yuan & Bauer
(2007) NDVI, Land cover, Vegetation type Microclimate
Li et al.
(2011) NDVI, Land cover, Vegetation type Microclimate
Zhou et al.
(2011) Vegetation type, Distribution of vegetation Microclimate
D. Armson et al. (2012)
Paving type, Condition of Shade Temperature
Paving type, Condition of Shade, Weather, Season Microclimate
Arthur H. Rosenfeld et al. (1998)
Colors of roofs, Color of ceilings Albedo
Albedo of buildings, Present of roadside trees, Present of roadside tree’s shade
Energy consumption of buildings
Mass Elements of building
Peponis, John
(2015) Various building forms (Mass elements) Energy consumption of buildings
Philip Steadman et al. (2010)
Façade area of buildings, Depth of buildings,
Vol-ume of buildings, building usage Energy consumption of buildings
Roger G. Barry & Richard J. Chorley (2003)
Building material, Building shapes Thermal capacity
Thermal capacity Air flow
Facade Elements of building
L. G. Caldas & L. K. Norford
(2003)
Materials of buildings, Façade area of buildings,
Proportions of windows of buildings Electric energy consumption of buildings
Jaime Gagne & Marilyne Andersen
(2012)
Proportions of window area, Distribution of win-dows, Number of winwin-dows, Proportion of length,
Height in façades
Energy consumption of buildings
J.R. Simpson & E.G. McPherson
(1997)
Roof material Surface temperatures of roof
Surface temperatures of roof Energy consumption of buildings in summer Danny S. Parker &
Stephen F. Barkaszi Jr. (1997)
Buildings’ façade elements Albedo
(2009) tracked changes in land use and land cover by type and analyzed their impact on microclimate in the city of Tabriz, the capital of East Azerbaijan. Li et al. (2009) ana-lyzed the influence of change in the patterns of land use on microclimate in Shanghai. Carlson et al. (1994) investigated the change in NDVI and solar radiation in relation to land cover and urban form and then analyzed the effect of vege-tation and urban form on microclimate in east-central Penn-sylvania. Gallo et al. (1995) analyzed the impact of urban form and NDVI on heat islands in 28 major cities in the USA.
Second, research has been published that investigated public space within cities. Haniyeh Sanaieian et al. (2014) analyzed the impact of the shape and direction of blocks within the city on microclimate. He also investigated the impact on microclimate of the distance between buildings, that is, the distance between public spaces, such as through solar radia-tion, ventilation performance, and heat environment in the city, as well as the impact on the energy consumption of buildings. Wolfgang Loibl et al. (2014) integrated various variables, such as the built environment, open space struc-ture, position within the city, and land use. They divided urban areas into various types under the category of urban fabric typology and analyzed the influence of these types on microclimate.
Third, research has been published that focused on the con-tribution of vegetation and shade to microclimate and the resulting effect on the energy consumption of buildings. Imhoff et al. (2010) verified differences in microclimate in accordance with NDVI and vegetation in three American cities, including Los Angeles. Yuan & Bauer (2007) investi-gated the change in microclimate in relation to NDVI, land cover, and type of vegetation from 2000 to 2002 in the seven-county Twin Cities Metropolitan Area (TCMA) of Minnesota. Li et al. (2011) analyzed the impact of specific types of vegetation, NDVI, and land use on microclimate in Shanghai. Zhou et al. (2011) analyzed in a study on the Gwynns Falls watershed in Baltimore City and Baltimore County, Maryland the changes in microclimate resulting from the type and distribution of vegetation. D. Armson et al. (2012) created a plot (1.8m x 1.8m) on the outskirts of a university campus within three kilometers of the central area of Manchester, UK. They covered the area with concrete and grass and carried out a comparative analysis of the change in microclimate when fully exposed to the sun ver-sus when shadowed by vegetation. He also selected areas with different shadow and cover conditions within an urban park and performed a comparative analysis of the change in microclimate on July 4, 2009, June 17, 2010, and July 3, 2010. Arthur H. Rosenfeld et al. (1998) analyzed in their study on the Los Angeles basin the relation between change in the colors of roofs and colors of ceilings and an increase in building’s albedo, and investigated the awning effect of present of roadside trees and present of roadside trees’ shade. Fourth, research has been reported that focused on the rela-tion among the mass elements of buildings, microclimate, and the energy consumption of buildings. Peponis, John (2015) analyzed the relations between the energy consump-tion of buildings and various built forms. Philip Steadman et al. (2010) analyzed data on non-residential buildings in Eng-land to reveal the effect of built forms, such as the façade area, depth, and volume of buildings, on their energy con-sumption. Roger G. Barry and Richard J.Chorley (2003) proposed that high thermal capacity in urban street and
cer-tain materials of buildings and building shapes within cites alter the flow of air, thereby creating a urban canyon effect for its passage.
Last, research has been published that focused on the effect of the façade elements of buildings. L. G. Caldas and L. K. Norford (2003) investigated the impact of the materials, façade area, and proportions of windows of buildings in Phoenix, Arizona on their electric energy consumption through a numerical simulation. Jaime Gagne and Marilyne Andersen (2012) also used a simulation to analyze the effect of different specific façade elements, such as the proportions of window area, distribution of windows, number of win-dows, and proportion of length and height in fa çades on the energy consumption of buildings. J.R. Simpson and E.G. McPherson (1997) analyzed the effect of the types of roof materials and surface temperatures of roof on the cooling energy of buildings in a study on data from the summer of 1990. Danny S. Parker and Stephen F. Barkaszi Jr. (1997) examined the impact of a change in buildings’ albedo on the conservation of cooling energy in nine residential buildings in Florida between 1991 and 1994. They found that albedo and microclimate did indeed affect the reduction of the en-ergy consumption of buildings.
The various aforementioned elements, including urban ele-ments, public space, vegetation and shade, mass eleele-ments, façade elements, and microclimate compose a particular urban form or spatial structure within the city or space. In turn, these unique urban forms or spatial structures affect the distinctive microclimate within the city or space. Alongside mass elements and façade elements, this microclimate is expected to influence the energy consumption of buildings. Their relation can be drawn from the results of previous research.
2.2. Hypothesis
Based on the literature review, this study proposes the fol-lowing hypotheses regarding the diverse complex effects that urban elements and building elements have on the en-ergy consumption of buildings.
1. Various existing variables can be latent variables, such as urban elements, public space, vegetation and shade, micro-climate, mass elements, and façade elements.
2. Urban elements have a direct effect on vegetation and shade, public space, and microclimate, and an indirect im-pact on the energy consumption of buildings through these elements.
3. Public space, vegetation and shade, façade elements, and mass elements have an indirect influence on the energy con-sumption of buildings via microclimate.
4. Some mass elements and façade elements have a direct impact on the energy consumption of buildings.
III. ANALYSIS STRUCTURE
3.1. Analysis model: SEM
This study employed structural equation modeling (SEM) to verify the above hypotheses. The most widely used method in psychology, education, sociology and business in recent years, SEM is one of the
statis-tical methods, such as regression analysis, factor analysis, multi regression analysis, and multivariate analysis to meas-ure not only the causal relation of variables but also the rela-tions of multiple variables, unlike other analysis methods that merely show fragmentary relations among variables (Tabachnick and Fidell, 2001).
3.2. Variables analyzed
The following variables were applied for the verification of the above hypotheses.
First, for variables related to global space, urban elements, public space elements, and vegetation and shade were ap-plied. These elements related to urban form and structure were found to affect microclimate in previous research. This study selected these variables since they are expected to have a direct or indirect influence on the energy consump-tion of buildings. Populaconsump-tion density, density of streets, presence of houses, existence of factories, diversity of land use, normalized difference built-up index (NDBI), and nor-malized difference vegetation index (NDVI) are some ex-amples of variables related to urban elements. As for vari-ables related to public space, average width of front of buildings and average width of side of buildings were
cho-sen. Presence of shade from roadside trees and distance be-tween roadside trees are examples of variables related to vegetation and shade.
Second, variables related to building shape, such as mass elements and façade elements, which have been established in existing research to affect the energy consumption of buildings, were employed. Average volume and height of buildings, existence of a setback on the upper levels, and existence of a setback on the ground floor are examples of mass elements, while façade area, and proportion of window area in major orientation and side orientation are some ex-amples of façade elements.
Lastly, for variables related to microclimate, wind speed, temperature, humidity, amount of radiation, and ground sur-face temperature were employed. Gradient, a natural ele-ment, alongside the ambient temperature of buildings, was applied as a control variable in order to control the relations among variables. As for building-related elements, total floor area, average projected lifespan of buildings, and building area, all of which are known to affect the energy consumption of buildings, were also used as a control vari-able.
3.3. Analysis target and data
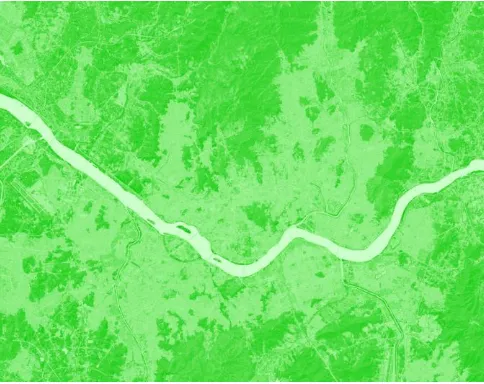
[image:5.595.46.548.76.671.2]This study utilizes data collected within a radius of 500 me-ters (0.79km²) of 23 AWS measurement points selected by the Meteorological Office of the Seoul Metropolitan Gov-ernment. It applied this radius of 500 meters because studies by Wilmers (1991) and Yunnam et al. (2015) have demon-strated that microclimates remain similar within such a boundary. The target areas are shown in Figure 1 below.
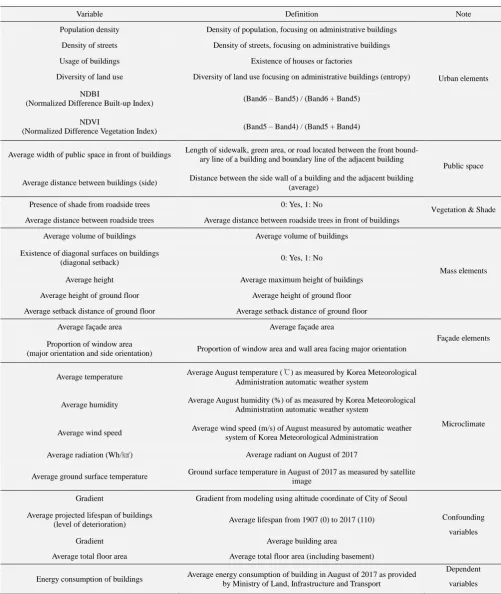
Table 2: Operational definition of variables
Variable Definition Note
Population density Density of population, focusing on administrative buildings
Urban elements Density of streets Density of streets, focusing on administrative buildings
Usage of buildings Existence of houses or factories
Diversity of land use Diversity of land use focusing on administrative buildings (entropy)
NDBI
(Normalized Difference Built-up Index) (Band6 – Band5) / (Band6 + Band5)
NDVI
(Normalized Difference Vegetation Index) (Band5 – Band4) / (Band5 + Band4)
Average width of public space in front of buildings Length of sidewalk, green area, or road located between the front bound-ary line of a building and boundbound-ary line of the adjacent building
Public space
Average distance between buildings (side) Distance between the side wall of a building and the adjacent building (average)
Presence of shade from roadside trees 0: Yes, 1: No
Vegetation & Shade Average distance between roadside trees Average distance between roadside trees in front of buildings
Average volume of buildings Average volume of buildings
Mass elements Existence of diagonal surfaces on buildings
(diagonal setback) 0: Yes, 1: No
Average height Average maximum height of buildings
Average height of ground floor Average height of ground floor
Average setback distance of ground floor Average setback distance of ground floor
Average façade area Average façade area
Façade elements Proportion of window area
(major orientation and side orientation) Proportion of window area and wall area facing major orientation
Average temperature Average August temperature (℃) as measured by Korea Meteorological Administration automatic weather system
Microclimate Average humidity Average August humidity (%) of as measured by Korea Meteorological
Administration automatic weather system
Average wind speed Average wind speed (m/s) of August measured by automatic weather system of Korea Meteorological Administration
Average radiation (Wh/㎢) Average radiant on August of 2017
Average ground surface temperature Ground surface temperature in August of 2017 as measured by satellite image
Gradient Gradient from modeling using altitude coordinate of City of Seoul
Confounding variables Average projected lifespan of buildings
(level of deterioration) Average lifespan from 1907 (0) to 2017 (110)
Gradient Average building area
Average total floor area Average total floor area (including basement)
Energy consumption of buildings Average energy consumption of building in August of 2017 as provided by Ministry of Land, Infrastructure and Transport
Dependent
Fig. 1: Target areas within a 500-meter radius of (0.79km²) of 23 AWS measurement points
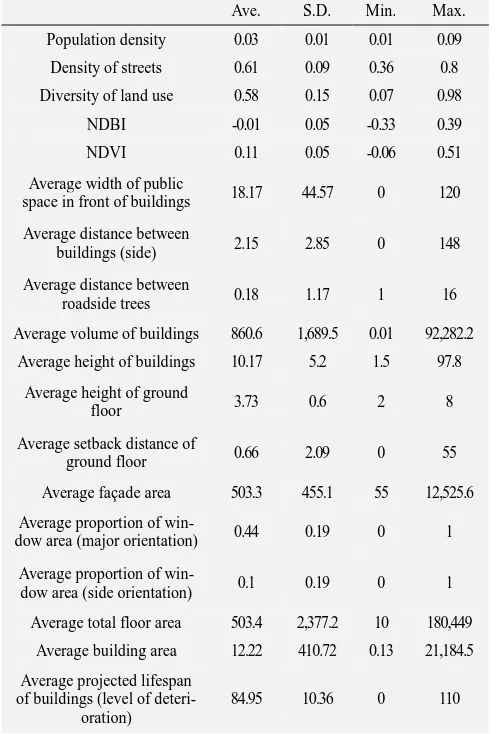
[image:6.595.306.550.218.303.2]The data for the descriptive statistics of each variable are shown in Tables 2 and 3 below.
Table 3: Descriptive statistics for continuous variables
Ave. S.D. Min. Max. Population density 0.03 0.01 0.01 0.09
Density of streets 0.61 0.09 0.36 0.8 Diversity of land use 0.58 0.15 0.07 0.98
NDBI -0.01 0.05 -0.33 0.39
NDVI 0.11 0.05 -0.06 0.51
Average width of public
space in front of buildings 18.17 44.57 0 120
Average distance between
buildings (side) 2.15 2.85 0 148
Average distance between
roadside trees 0.18 1.17 1 16
Average volume of buildings 860.6 1,689.5 0.01 92,282.2 Average height of buildings 10.17 5.2 1.5 97.8
Average height of ground
floor 3.73 0.6 2 8
Average setback distance of
ground floor 0.66 2.09 0 55
Average façade area 503.3 455.1 55 12,525.6
Average proportion of
win-dow area (major orientation) 0.44 0.19 0 1
Average proportion of
win-dow area (side orientation) 0.1 0.19 0 1
Average total floor area 503.4 2,377.2 10 180,449 Average building area 12.22 410.72 0.13 21,184.5 Average projected lifespan
of buildings (level of deteri-oration)
84.95 10.36 0 110
Gradient 2.07 2.05 0.08 19.79
Average temperature 29.81 0.38 29.04 30.71 Average humidity 67.7 2.78 61.35 73.22 Average wind speed 2.24 0.42 0.8 3.39 Average solar radiation
(Wh/㎢) 0.498 0.002 0.480 0.508
Average ground surface
temperature 27.67 1.43 20.16 37.35
Energy consumption of
[image:6.595.46.294.357.724.2]buildings 7,077.3 28,749 50 1,363,994
Table 4: Descriptive statistics for dummy variables
Variable Proportion
Existence of house No: 34.62%, Yes: 65.38% Existence of factory No: 90.44%. Yes: 9.56% Presence of shade from roadside trees No: 61.26%, Yes: 38.74%
Existence of diagonal surfaces on buildings
(Diagonal setback) No: 74.94%, Yes: 25.06%
Data on 22,439 buildings and their surrounding areas within the aforementioned range was obtained.
Official data related to the variables in the target areas was obtained from the Seoul Metropolitan Government, while data on the energy consumption of buildings, a dependent variable, was obtained from data collected and published by the Ministry of Land, Infrastructure and Transport since 2014.
Administrative information on buildings managed by the Ministry of Land, Infrastructure, and Transport, and micro-climate data from AWS measurement points provided by the Korean Meteorological Administration were utilized. For the ambient temperature of buildings, NDBI, and NDVI, band values from Landsat 8 satellite image data for the cen-tral portion of the Korean Peninsula provided by the USGS (United States Geological Survey) were used. Bands 4 and 5 were used to extract NDVI, Bands 5 and 6 were utilized to extract NDBI, and Bands 10 and 11 were converted into thermal imagery to extract the ground surface temperature.
[image:6.595.307.545.519.695.2]Fig. 4: Extracting NDVI from Landsat8 Image
ENVI 5.3 was employed in the process, and the tempera-tures of target buildings were extracted from the data using GIS. Data on the gradient of buildings and distance between roadside trees were created by analyzing the data provided by the Seoul Metropolitan Government with ArcGIS. Ar-cGIS 10.3 was utilized in all the analyses using GIS. 3.4. Establishment of an initial model
For the verification of the hypotheses, an initial model was established based on previous research.
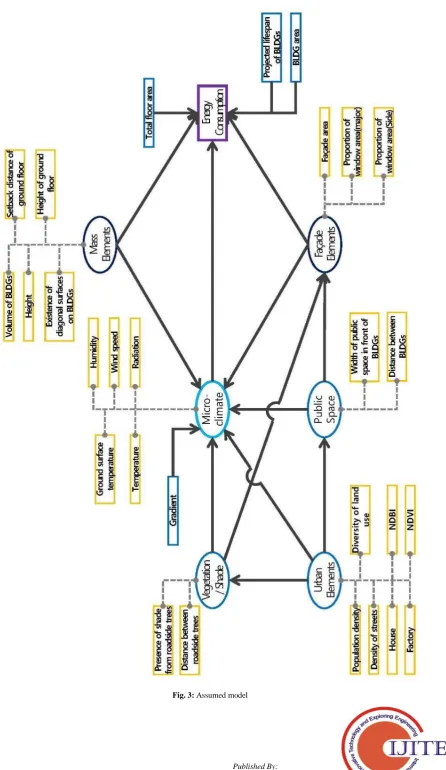
As suggested when the variables were established, urban elements include population density and density of streets, presence of houses and factories, diversity of land use, NDBI, and NDVI. Public space includes the width of public spaces in front of buildings and average distance between them. Vegetation and shade elements include the presence of shade from roadside trees and average distance between them. Mass elements include the average volume and height of buildings, average existence of diagonal surfaces in build-ings (existence of setback in upper levels), average setback distance of the ground floor, and average height of the ground floor. Façade elements include average façade area, average proportion of window area facing the major orienta-tion, and average proportion of window area facing the ma-jor side orientation.
Microclimate includes average ground surface temperature, average temperature, average humidity, average wind speed, and average amount of radiation. Confounding variables comprise basic conditions of buildings, such as average total floor area, average building area, and average projected life-span of buildings (level of deterioration). Finally, gradient was applied as a natural element affecting microclimate for the establishment of an initial theoretical model.
It is presumed that urban (space) elements and natural ele-ments of global space affect surface temperatures, while urban and building form elements of regional space, such as public space elements, vegetation and shade elements, mass elements, plan elements, and façade elements, as well as confounding variables, such as average total floor area, av-erage building area, and avav-erage projected lifespan of ings, all have an impact on the energy consumption of build-ings alongside microclimate.
However, it is assumed that urban (space) elements of global space and public space elements, vegetation and shade elements of regional space have an indirect impact on the energy consumption of buildings through microclimate. It is also presumed that, given the relations among building form elements found in previous research, public space ele-ments of regional spaces influence not only microclimate,
but also façade elements. A diagram of an initial model tak-ing into account the direct effect and mediator effect of vari-ables and potential varivari-ables based on the assumptions is shown in Figure 3.
IV. ANALYSIS RESULTS
4.1. Selection of a model through an examination of suit-ability
Conventionally, a theoretical model is examined for the verification and analysis of SEM. However, this study, in which a comprehensive model was not verified and ana-lyzed, employs an exploratory method. Out of concern for overfitness of the model, it used data on 350 randomly se-lected buildings from among the 22,439 buildings to estab-lish models, and then selected the model with the greatest suitability.
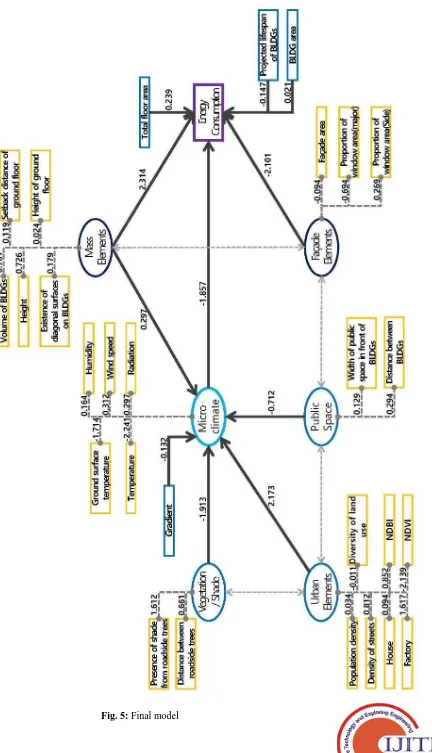
The final model was drawn by modifying and supplement-ing an earlier model ussupplement-ing a suitability index, and data on the 22,439 buildings was applied to the final model and ana-lyzed to draw the suitability index for the final model, which is shown in Figure 5.
As for the suitability of the final model utilizing 350 build-ings, the normed fit index (NFI) is 0.925, relative fit index (RFI) is 0.895, incremental fit index (IFI) is 0.931, Tucker-Lewis index (TLI) is 0.901, comparative fit index (CFI) is 0.930, root mean square error of approximation (RMSEA) is 0.052, and standardized root mean square residual (SRMR) is 0.056. These results demonstrate that this model is ade-quate for this study.
4.2. Verification of generality
The suitability of the model was verified by applying data on the 22,439 buildings to the final model. The results show that the NFI is 0.936, RFI is 0.901, IFI is 0.939, TLI is 0.906, CFI is 0.939, RMSEA is 0.049, and SRMR is 0.051. These results present greater suitability compared to those applying to this model data on the 350 buildings, which means it is reasonable for this model to be the final analysis model for this study (Figure 5).
4.3. Analysis of results
The results of the analysis of Model 4, which was proven to be the best method through the comparison of the analysis models, are as follows.
First, urban elements have a correlation to vegetation and shade and to public space elements. This relation was con-firmed by the fact that the explanatory power of a model which has error covariance among latent variables is greater than those without error covariance.
urban elements have the greatest influence at 2.173. The influences of vegetation and shade and of public space were -1.913 and -0.712, respectively. These three elements also have an indirect impact on the energy consumption of build-ings via microclimate. They do not have a direct effect on the energy consumption of buildings, which indicates that they have an intermediary relation with the energy con-sumption of buildings.
Third, building elements, such as mass elements and façade elements, have a correlation with each other, while façade elements present a correlation with public space elements as well. This relation can be explained by the fact that the ex-planatory power of a model which has error covariance among latent variables is greater than one without error co-variance.
Table 5: Relationship between latent variables and independent vari-ables
Latent
Variables Independent variables Coef.
Urban elements
Population density 0.034** Density of streets 0.812** Existence of house 0.094** Existence of factory 1.617** Diversity of land use -0.011*
NDBI 0.852**
NDVI -2.139**
Public space
Average width of public space in front of
buildings 0.129**
Average distance between buildings (side) 0.294*
Vegeta-tion & Shade
Presence of shade from roadside trees 1.612** Average distance between roadside trees 0.661
Mass elements
Average volume of buildings 0.761** Existence of diagonal surfaces on buildings
(Diagonal setback) 0.726**
Average height of buildings 0.179** Average height of ground floor 0.119** Average setback distance of ground floor 0.024*
Façade elements
Average façade area -0.094†
Average proportion of window area
(major orientation) -0.694**
Average proportion of window area
(side orientation) 0.269
Micro-climate
Average ground surface temperature -1.714** Average temperature 2.241**
Average humidity 0.164**
Average wind speed 0.201** Average solar radiation (Wh/㎢) 0.312* < 0.1: †, < 0.05: *, < 0.01: **
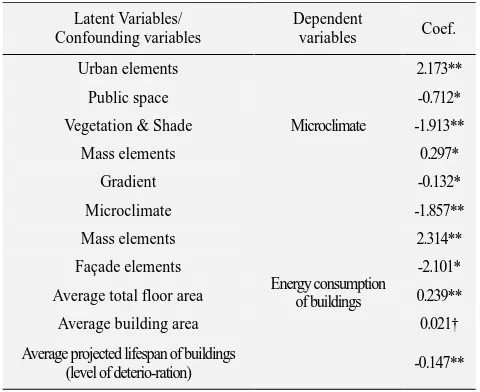
Table 6: Relationship between latent/Confounding variables and dependent variables
Latent Variables/ Confounding variables
Dependent
variables Coef.
Urban elements
Microclimate
2.173**
Public space -0.712*
Vegetation & Shade -1.913**
Mass elements 0.297*
Gradient -0.132*
Microclimate
Energy consumption of buildings
-1.857**
Mass elements 2.314**
Façade elements -2.101*
Average total floor area 0.239**
Average building area 0.021†
Average projected lifespan of buildings
(level of deterio-ration) -0.147**
< 0.1: †, < 0.05: *, < 0.01: **
Fifth, mass elements and façade elements have a direct in-fluence on the energy consumption of buildings. In particu-lar, mass elements have both a direct and an indirect impact
on the energy consumption of buildings, which indicates that there is an incomplete mediatory relation among mass elements, microclimate, and the energy consumption of buildings. However, the influence of mass elements on the energy consumption of buildings (2.314) was greater than their influence on microclimate (0.297).
Sixth, among the elements that have an indirect effect on the energy consumption of buildings through microclimate, ur-ban elements show the greatest indirect effect at -4.035 (2.173×-1.857), followed by vegetation and shade at 3.552 (-1.913×-1.857), public space at 1.322 (-0.712×-1.857), and mass elements at 0.551 (0.297×-1.857).
4.4. Verification of hypotheses
Based on the results of the analysis, verification of the hy-potheses established in Section 2 was performed.
First, a range of variables from previous research can be potential variables, such as urban elements, public space, vegetation and shade, microclimate, mass elements, and façade elements. Except for average distance between road-side trees and average proportion of window area (road-side ori-entation), they qualified as latent variables.
Second, urban elements have a direct impact on microcli-mate. However, they do not have a direct influence on vege-tation and shade, and public space. It turns out that there is merely a correlation between them. It is also found that ur-ban elements have an indirect impact on the energy con-sumption of buildings through microclimate.
Third, public space, vegetation and shade, and mass ele-ments have an indirect effect on the energy consumption of buildings by means of microclimate, while façade elements do not influence microclimate.
Fourth, some mass elements and façade elements have a direct impact on the energy consumption of buildings. In particular, mass elements have both a direct and an indirect influence on the energy consumption of buildings.
The verification of the hypotheses shows that portions of the final three hypotheses are right.
V. CONCLUSION AND DISCUSSION
As a result of this study, the following implications can be drawn.
First, the feasibility of SEM as a research method for the urban design and building field was verified. This study utilized SEM to establish a theoretical model applying vari-ables comprising urban and building forms, as well as po-tential variables such as urban space elements, public space elements, and vegetation and shade elements. This study is meaningful since the establishment and verification of this theoretical model has not been actively carried out for the urban design and building field. This model is expected to explain not only microclimate, but also the energy consump-tion of buildings. Interpretaconsump-tion of the dependent variables through the establishment of a theoretical model utilizing SEM has been applied in psychology, education, and man-agement.
This method is useful for embedding a potential ability or psychological state that is difficult to observe or quantify into a statistical model for
de-sign and building areas also must address elements that are challenging to observe or measure, such as publicness, aes-thetics, perception of space, and spatial structure, or that are difficult to provide with an operational definition using only a single variable. Therefore, SEM can be widely applied in this field. In this light, this study established a complex rela-tion between global elements, including urban elements, public space, and vegetation and shade, and the mass ele-ments and façade eleele-ments of buildings, revealed their rela-tions with microclimate, and explained the energy consump-tion of buildings. Though this process, it contributed to a deeper understanding of the intricate relations among urban space elements.
Second, regional elements, including urban elements, do not have a direct impact on the energy consumption of buildings. They only present an indirect influence on the energy con-sumption of buildings by means of microclimate.
This result indicates that a study focusing on the impact of regional urban form and public space on microclimate is needed for the management of microclimate as part of the formation of more sustainable urban architecture.
Third, mass elements of buildings have a close relation to microclimate, while façade elements have less influence. A similar issue has been pointed out in previous research. It cannot be said that façade elements have no effect on micro-climate, since the reflection and radiation effects of building materials have a considerable impact on microclimate. However, in this study, which includes this kind of surface temperature in microclimate, façade elements show rela-tively less influence.
Fourth, microclimate is an external condition to decide an energy consumption of buildings. It is influenced by its sur-roundings, urban form and tissue, building form and natural environment, but it also has an influence on the behaviors of people living in the settlement. The influence is centered on 'thermal comfort', which is comprehensively formed based on several elements of microclimate such as solar radiation, temperature, moisture and wind speed etc. This 'thermal comfort' is what makes us feel comfortable or discomfort-able. That is, 'thermal comfort' by microclimate leads us to turn up or down the heat indoors, and eventually to consume energy.
This study has the following limitations and significance. First, it applied comprehensive and varied models utilizing large volumes of diverse official data. However, it is limited in that various elements could have been considered and other potential variables could be applied in the formation of the model. SEM entails this significance and limitation as well. Further research focusing on the formation of various models needs to be pursued. It is also limited in that it only investigated cooling energy in August, the hottest month of the year in Korea, and did not consider wintertime heating energy requirements. Further study on the energy consump-tion of buildings during February, the coldest month of the year in Korea, is needed.
In spite of the above limitations, this study is meaningful in that it provides a complex model for the management of both the energy consumption of buildings and urban micro-climate. In particular, it is expected that the expansion and sophisticated development of the research performed in this study through follow-up research will contribute to the de-velopment of software for the management of the urban en-vironment or guideline for urban planning, which will help to enhance the sustainability of cities.
Acknowledgement
This research was supported by a grant (code 17CTAP-C133102-01) from Land, Infrastructure and Transport Tech-nologies Promotion Program funded by Ministry of Land, Infrastructure and Transport of Korean government
REFERENCES
1. Arthur, H. R., Hashem, A., & Joseph, J. R. et al. (1998), Cool commu-nities: strategies for heat island mitigation and smog reduction, Energy and buildings, 28(1), pp.51-62.
2. Jichuan, W., & Xiaoqian, W. (2012), Introduction, Structural equation modeling: applications using Mplus, John Wiley & Sons Ltd.: Chiches-ter, UK, pp.1-28.
3. Baruch, G. (1998), Urban design effects on the urban climate. In cli-mate considerations in building and urban design, John Wiley & Sons, Inc.: Denver, USA, pp.32-58.
4. Danny, S. P., & Stephen, F. B. Jr. (1997), Roof solar reflectance and cooling energy use: field research results from Florida, Energy and buildings, 25(2), pp.105-115.
5. Eric, W. H., & Misha, S. (1998), Assessing the cost-effectiveness of SMUD’s shade tree program, Atmospheric environment, 32(1), pp.85-94.
6. Fritz, W. (1990-1991), Effects of vegetation on urban climate and buildings, Energy and buildings, 15(3-4), pp.507-514.
7. Gerald, M. (1997), The radiative effects of building groups on single structures, Energy and buildings, 25(1), pp.51-61.
8. Gideon, S. Golany. (1996), Urban design morphology and thermal performance, Atmospheric environment, 30(3), pp.455-465.
9. Ingegard, E. (1994), Urban-suburban-rural air temperature differences related to street geometry, Physical geography, 15(1), pp.1-20. 10. J. R., Simpson, & E. G., McPherson. (1997), The effects of roof albedo
modification on cooling loads of scale model residence in Tuscon, Ari-zona, Energy and buildings, 25(2), pp.127-137.
11. Jeong, Y.N., Lee, G.W.., & Kim, S.Y. (2015), Analysis of the relation of local temperature to the natural environment, land use and land cov-erage of neighborhoods, Journal of asian architecture and building en-gineering, 14(1), pp.33-40.
12. Lee, G. W. & Jeong, Y. N. (2018), Analysis of the relationship between urban and building form, microclimate, and energy consumption of buildings utilizing structural equation modelling (SEM), International Journal of ICT-aided Architecture and Civil Engineering, 5(1), pp.43-48.
13. M., Santamouris. (2011), Heat-island effect, Energy and climate in the urban built environment, M., Santamouris., Routledge: New York, USA, pp.48-68.
14. P.J., Littlefair, M., Santamouris, & S., Alvarez et al. (2000), Urban climate, Environmental site layout planning: solar access, microcli-mate and passive cooling in urban areas, BRE: London, UK, pp.4-6. 15. R., Harrison, B., McGoldrick, & C.G.B., Williams. (1984), Artificial
heat release from greater London, 1971-1976, Atmospheric Environ-ment, 18(11), pp.2291-2304.
16. Roger, G. B., & Richard, J. C. (2003), Boundary layer climates, Atmos-phere, weather and climate, eighth Edition, Routledge: New York, USA, pp.321-352.
17. Yasushi, S. (1996), A numerical study of the effect of urban geometry upon the surface energy budget, Atmospheric environment, 30(3), pp.487-496.