https://doi.org/10.5194/bg-15-507-2018
© Author(s) 2018. This work is distributed under the Creative Commons Attribution 4.0 License.
Glacial–interglacial changes and Holocene variations in
Arabian Sea denitrification
Birgit Gaye1, Anna Böll1, Joachim Segschneider2, Nicole Burdanowitz1, Kay-Christian Emeis1,3, Venkitasubramani Ramaswamy4, Niko Lahajnar1, Andreas Lückge5, and Tim Rixen1,6
1Institute for Geology, Universität Hamburg, Bundesstraße 55, 20146 Hamburg, Germany 2Institute for Geosciences, Universität Kiel, Ludewig-Meyn-Straße 10, 24118 Kiel, Germany
3Institute of Coastal Research, Helmholtz Center Geesthacht, Max-Planck-Straße 1, 21502 Geesthacht, Germany 4National Institute of Oceanography, Dona Paula, Goa, 403004, India
5Bundesanstalt für Geowissenschaften und Rohstoffe, Stilleweg 2, 30655 Hannover, Germany
6Leibniz-Zentrum für Marine Tropenforschung (ZMT) GmbH, Fahrenheitstraße 6, 28359 Bremen, Germany
Correspondence:Birgit Gaye ([email protected]) Received: 21 June 2017 – Discussion started: 27 June 2017
Revised: 29 November 2017 – Accepted: 7 December 2017 – Published: 26 January 2018
Abstract.At present, the Arabian Sea has a permanent oxy-gen minimum zone (OMZ) at water depths between about 100 and 1200 m. Active denitrification in the upper part of the OMZ is recorded by enhancedδ15N values in the sedi-ments. Sediment cores show aδ15N increase during the mid-dle and late Holocene, which is contrary to the trend in the other two regions of water column denitrification in the east-ern tropical North and South Pacific. We calculated compos-ite sea surface temperature (SST) and δ15N ratios in time slices of 1000 years of the last 25 kyr to better understand the reasons for the establishment of the Arabian Sea OMZ and its response to changes in the Asian monsoon system. Lowδ15N values of 4–7 ‰ during the last glacial maximum (LGM) and stadials (Younger Dryas and Heinrich events) suggest that denitrification was inactive or weak during Pleis-tocene cold phases, while warm interstadials (ISs) had ele-vatedδ15N. Fast changes in upwelling intensities and OMZ ventilation from the Antarctic were responsible for these strong millennial-scale variations during the glacial. During the entire Holoceneδ15N values>6 ‰ indicate a relatively stable OMZ with enhanced denitrification. The OMZ devel-ops parallel to the strengthening of the SW monsoon and monsoonal upwelling after the LGM. Despite the relatively stable climatic conditions of the Holocene, theδ15N records show regionally different trends in the Arabian Sea. In the upwelling areas in the western part of the basin, δ15N val-ues are lower during the mid-Holocene (4.2–8.2 ka BP)
com-pared to the late Holocene (<4.2 ka BP) due to stronger ven-tilation of the OMZ during the period of the most intense southwest monsoonal upwelling. In contrast,δ15N values in the northern and eastern Arabian Sea rose during the last 8 kyr. The displacement of the core of the OMZ from the region of maximum productivity in the western Arabian Sea to its present position in the northeast was established during the middle and late Holocene. This was probably caused by (i) reduced ventilation due to a longer residence time of OMZ waters and (ii) augmented by rising oxygen consumption due to enhanced northeast-monsoon-driven biological productiv-ity. This concurs with the results of the Kiel Climate Model, which show an increase in OMZ volume during the last 9 kyr related to the increasing age of the OMZ water mass.
1 Introduction
es-timates of total N sources and sinks vary by factors of up to 4 and it has been debated whether the recent marine N cycle is in balance (Brandes and Devol, 2002; Codis-poti, 2007; Codispoti et al., 2001; Gruber, 2008; Gruber and Sarmiento, 1997). Models have constrained the major oceanic N sinks (total water column and benthic denitrifi-cation) to 120–240 Tg N year−1 and brought them close to equilibrium with estimates of diazotrophic dinitrogen (N2)
fixation, the main oceanic N source (Deutsch et al., 2004; DeVries et al., 2013). New measurements have at the same time led to higher global estimates of N2fixation (Grosskopf
et al., 2012).
A period of fundamental change in oceanic N cycling (among other element cycles) occurred during the transition from the last glacial to the Holocene due to adjustment to changes in wind forcing, ocean circulation, sea level, and nu-trient and trace metal supply from land (Deutsch et al., 2004; Eugster et al., 2013). The present equilibrium was probably attained only a few thousand years ago (Deutsch et al., 2004; Eugster et al., 2013). Understanding the response of the N cycle to this complex reorganization is important to facili-tate our present understanding of N cycling on global and regional scales (Gruber and Galloway, 2008).
Sedimentaryδ15N values integrate signals derived from N sources and the fractionation processes occurring during N cycling so thatδ15N records have to be carefully deciphered (Altabet, 2006; Brahney et al., 2014; Nagel et al., 2013). Lo-cally, eolian and riverine N supply can impactδ15N values in sediments (Kendall et al., 2007; Voss et al., 2006), but generally sedimentary δ15N values reflect the role of deni-trification vs. N2fixation in ocean basins. Denitrification in
the water column OMZ reduces nitrate in several steps to N2.
These reactions strongly discriminate against the heavy15N isotopes so that the residual nitrate is isotopically enriched to δ15N values above the oceanic average of 5 ‰ (Brandes et al., 1998; Cline and Kaplan, 1975). Convective mixing and especially upwelling force nitrate-deficient water masses to the surface so that the enrichedδ15N signal of nitrate is ef-fectively transported into the euphotic zone. After assimila-tion into biomass by phytoplankton, 15N-enriched particu-late matter sinks through the water column to the seafloor where the signal of denitrification and OMZ intensity is pre-served in the sediments (Altabet et al., 1995; Gaye-Haake et al., 2005; Naqvi et al., 1998; Suthhof et al., 2001). The nitrogen deficit produced by denitrification can be counter-acted by N2fixation from the atmosphere, which introduces
nitrogen with aδ15N only slightly lower than the atmospheric value of 0 ‰, as the process is associated with little isotopic fractionation (Carpenter et al., 1997).
Sedimentary δ15N records show that during the glacial denitrification was less intense than today (Galbraith et al., 2013). Models suggest – albeit with many uncertainties and unknowns – that both denitrification and N2 fixation were
lower during the glacial (Deutsch et al., 2004; Eugster et al., 2013; Galbraith et al., 2013; Schmittner and Somes, 2016;
Somes et al., 2017). However, due to a stronger reduction of denitrification than of N2fixation, total export production
was higher and increased the glacial oceanic N inventory by 10–50 % over that of the Holocene, also enhancing the car-bon storage in the ocean (Deutsch et al., 2004; Eugster et al., 2013; Schmittner and Somes, 2016; Somes et al., 2017). Dis-tinct changes in sedimentaryδ15N values during deglaciation are interpreted to reflect the major changes in the N inventory (e.g., Galbraith et al., 2013). The decreasing iron supply af-ter the LGM (19–26.5 ka BP; Clark et al., 2009) may have significantly reduced N2 fixation, leading to a rise ofδ15N
(Eugster et al., 2013). Enhanced upwelling at about 15 ka BP led to abrupt onsets or increases in denitrification in the east-ern tropical North and South Pacific as well as in the Arabian Sea (Altabet et al., 1995; Ganeshram et al., 2002, 2000, 1995; Suthhof et al., 2001). The corresponding signal of enhanced δ15N values was dispersed and registered in many parts of the global ocean from the glacial to early Holocene and was followed by a smooth decrease inδ15N from enhanced N2
fixation stimulated by the delayed increase in benthic deni-trification caused by sea level rise (Deutsch et al., 2004; Gal-braith et al., 2013; Ren et al., 2012). This sequence of events is very well recorded in cores from the east Pacific upwelling areas, but differs from the temporal pattern seen in sedimen-tary records from the Arabian Sea that show stable or in-creasingδ15N values in the Holocene (e.g., Galbraith et al., 2013).
In order to (i) discern why N cycling in the Arabian Sea differs from the global trend and to (ii) better understand the response of the OMZ to changes in the monsoon sys-tem we present a summary ofδ15N records from the Arabian Sea including two new records from the Oman upwelling area (Table 1; Fig. 1a; Sect. S1 in the Supplement). The records are from different areas and trace the regional history of mid-water oxygenation over the last 25 kyr. To relate the records of mid-water oxygenation to the history of southwest (SW) monsoon upwelling and northeast (NE) monsoon win-ter cooling, we compiled SST records from the liwin-terature and generated a new temperature reconstruction for the Oman up-welling area (Table 1; Fig. 1b, Sect. S2). Based on these inte-gratedδ15N and SST records for different regions of the Ara-bian Sea we examine contrasts between glacial and Holocene conditions over the entire basin and contrasting regional evo-lution within the basin during the Holocene. Finally, we dis-cuss our conclusions with the results of the global climate and ocean biogeochemistry model (KCM–PISCES) for the Holocene Arabian Sea.
2 Study area
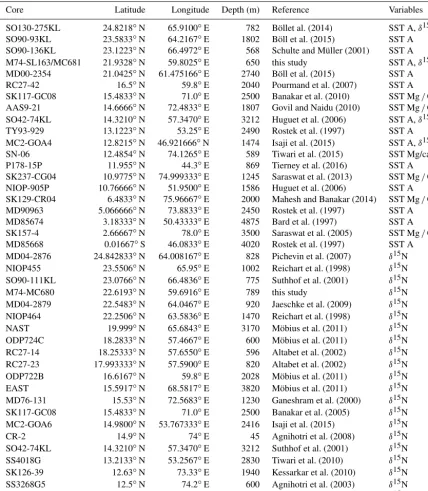
Table 1.Station number, locations, water depth (m), data sources (references), and variables used: SST A (alkenone sea surface temperatures), δ15N ratios of total N, and SST Mg/Ca (Mg/Ca sea surface temperatures).
Core Latitude Longitude Depth (m) Reference Variables
SO130-275KL 24.8218◦N 65.9100◦E 782 Böllet al. (2014) SST A,δ15N
SO90-93KL 23.5833◦N 64.2167◦E 1802 Böll et al. (2015) SST A
SO90-136KL 23.1223◦N 66.4972◦E 568 Schulte and Müller (2001) SST A
M74-SL163/MC681 21.9328◦N 59.8025◦E 650 this study SST A,δ15N
MD00-2354 21.0425◦N 61.475166◦E 2740 Böll et al. (2015) SST A
RC27-42 16.5◦N 59.8◦E 2040 Pourmand et al. (2007) SST A
SK117-GC08 15.4833◦N 71.0◦E 2500 Banakar et al. (2010) SST Mg/Ca
AAS9-21 14.6666◦N 72.4833◦E 1807 Govil and Naidu (2010) SST Mg/Ca
SO42-74KL 14.3210◦N 57.3470◦E 3212 Huguet et al. (2006) SST A,δ15N
TY93-929 13.1223◦N 53.25◦E 2490 Rostek et al. (1997) SST A
MC2-GOA4 12.8215◦N 46.921666◦N 1474 Isaji et al. (2015) SST A,δ15N
SN-06 12.4854◦N 74.1265◦E 589 Tiwari et al. (2015) SST Mg/ca
P178-15P 11.955◦N 44.3◦E 869 Tierney et al. (2016) SST A
SK237-CG04 10.9775◦N 74.999333◦E 1245 Saraswat et al. (2013) SST Mg/Ca
NIOP-905P 10.76666◦N 51.9500◦E 1586 Huguet et al. (2006) SST A
SK129-CR04 6.4833◦N 75.96667◦E 2000 Mahesh and Banakar (2014) SST Mg/Ca
MD90963 5.066666◦N 73.8833◦E 2450 Rostek et al. (1997) SST A
MD85674 3.18333◦N 50.43333◦E 4875 Bard et al. (1997) SST A
SK157-4 2.66667◦N 78.0◦E 3500 Saraswat et al. (2005) SST Mg/Ca
MD85668 0.01667◦S 46.0833◦E 4020 Rostek et al. (1997) SST A
MD04-2876 24.842833◦N 64.008167◦E 828 Pichevin et al. (2007) δ15N
NIOP455 23.5506◦N 65.95◦E 1002 Reichart et al. (1998) δ15N
SO90-111KL 23.0766◦N 66.4836◦E 775 Suthhof et al. (2001) δ15N
M74-MC680 22.6193◦N 59.6916◦E 789 this study δ15N
MD04-2879 22.5483◦N 64.0467◦E 920 Jaeschke et al. (2009) δ15N
NIOP464 22.2506◦N 63.5836◦E 1470 Reichart et al. (1998) δ15N
NAST 19.999◦N 65.6843◦E 3170 Möbius et al. (2011) δ15N
ODP724C 18.2833◦N 57.4667◦E 600 Möbius et al. (2011) δ15N
RC27-14 18.25333◦N 57.6550◦E 596 Altabet et al. (2002) δ15N
RC27-23 17.993333◦N 57.5900◦E 820 Altabet et al. (2002) δ15N
ODP722B 16.6167◦N 59.8◦E 2028 Möbius et al. (2011) δ15N
EAST 15.5917◦N 68.5817◦E 3820 Möbius et al. (2011) δ15N
MD76-131 15.53◦N 72.5683◦E 1230 Ganeshram et al. (2000) δ15N
SK117-GC08 15.4833◦N 71.0◦E 2500 Banakar et al. (2005) δ15N
MC2-GOA6 14.9800◦N 53.767333◦E 2416 Isaji et al. (2015) δ15N
CR-2 14.9◦N 74◦E 45 Agnihotri et al. (2008) δ15N
SO42-74KL 14.3210◦N 57.3470◦E 3212 Suthhof et al. (2001) δ15N
SS4018G 13.2133◦N 53.2567◦E 2830 Tiwari et al. (2010) δ15N
SK126-39 12.63◦N 73.33◦E 1940 Kessarkar et al. (2010) δ15N
SS3268G5 12.5◦N 74.2◦E 600 Agnihotri et al. (2003) δ15N
NIOP-905P 10.76666◦N 51.9500◦E 1586 Ivanochko et al. (2005) δ15N
al., 2011; Ward et al., 2009). Suboxic conditions between the thermocline and 1200 m are maintained by the balanced in-teraction of oxygen demand (organic matter degradation) and oxygen supply (ventilation; e.g., Olson et al., 1993; Sarma, 2002). The degradation of organic matter sinking out of the surface mixed layer consumes oxygen in the upper sub-thermocline water column. Primary productivity and particle flux in the Arabian Sea are highly seasonal and more than 50 % of annual particle fluxes occur during the summer
Figure 1.Stations of sediment cores forδ15N(a)and for SST(b) reconstructions with colors indicating surface sediment samples (purple) and cores from the Oman upwelling (dark blue), Somali upwelling (light blue), and the western (green), northern (yellow), eastern (red), and southeastern (orange) Arabian Sea.
(Fig. 2b) caused by deep convection due to winter cooling (Rixen et al., 2005; Wiggert et al., 2005).
[image:4.612.308.546.69.403.2]Upper water masses (<1500 m of water depth) in the In-dian Ocean have a net westward circulation, while deep wa-ters follow an eastward route as part of the Great Ocean Conveyer Belt connecting the Pacific and Atlantic Ocean (Broecker, 1991). However, this general direction comprises rather complicated routes and pathways (Durgadoo et al., 2017). Four water masses contribute to the subsurface waters of the OMZ: Arabian Sea High-Salinity Water (ASHSW), Persian Gulf Water (PGW), Red Sea Water (RSW), and In-dian Ocean Central Water (ICW). The ASHSW forms dur-ing the NE monsoon due to enhanced evaporative cooldur-ing driven by dry air from the Himalayas (Prasad and Ikeda, 2002). During September–October the core of the ASHSW at a salinity>36.5 psu andσθ=23.9 kg m−3is found in the
Figure 2.SST in◦C from Jul–Sep (SW monsoon)(a)and Jan– Mar (NE monsoon)(b)from the World Ocean Atlas (Locarnini et al., 2013). Solid arrows indicate major wind directions and broken arrows indicate surface general currents; WICC is the West Indian Coastal Current.
upper 100 m in the northern and eastern Arabian Sea (Kumar and Prasad, 1999). PGW forms a salinity maximum of 35.1– 37.9 psu atσθ=26.6 kg m−3 within the core of the
denitri-fication zone (100 to 350 m) and undergoes strong isopycnal mixing (Prasad et al., 2001) so that its proportion of the salin-ity maximum on the 26.6σθsurface is less than 40 %
(Morri-son et al., 1998). During the SW monsoon PGW core salinity is additionally reduced due to the northward flowing Somali Current providing the less saline ICW (Prasad et al., 2001; You, 1998). The RSW forms an intermediate salinity maxi-mum between 600 and 900 m and is characterized by salini-ties between 35.1 and 35.6 psu andσθof 27.2 kg m−3(Kumar
Sea from the southwest as part of the Somali Current (Res-plandy et al., 2012; You, 1998). Intermediate water from the southern sources is originally rich in oxygen, but becomes increasingly oxygen depleted and nutrient rich on its path to the Arabian Sea owing to oxygen loss during the mineral-ization of sinking organic matter. Progressive oxygen loss is reflected by the observed pattern with higher oxygen concen-trations in the NW basin than in the NE basin of the Arabian Sea (Morrison et al., 1999; Pichevin et al., 2007; Rixen et al., 2014). The deep water below about 1500 m is fed by cir-cumpolar deep water (CDW) with σθ of 27.8 kg m−3 and a
salinity of 34.8 psu (Bindoff and McDougall, 2000; Schott and McCreary, 2001).
The intensity of the OMZ and denitrification is season-ally variable. Oxygen concentrations in its core and its vol-ume vary in response to the seasonality of ventilation, prob-ably related to the seasonality of isopycnal mixing (Banse et al., 2014; Rixen et al., 2014). Models produce similar pat-terns with major ventilation from the south during the SW monsoon, while reversing currents, progressive oxygen con-sumption, and isopycnal mixing reduce oxygen concentra-tions in the entire basin during the winter monsoon (Resp-landy et al., 2012; Rixen et al., 2014). Reoxygenation during the SW monsoon occurs via the invigorated Somali Current in the western Arabian Sea and a northward-flowing under-current below 150 m of water depth along the SW coast of India (Resplandy et al., 2012), which was found up to 20◦N (Shetye et al., 1990). This undercurrent reverses its direc-tion semiannually, opposing the direcdirec-tion of the West Indian Coastal Current (WICC; Fig. 2) at the surface (Shetye et al., 1990). At present, the strongest denitrification prevails in the NE Arabian Sea although productivity and particle fluxes are highest in the western part of the basin (Gaye-Haake et al., 2005; Nair et al., 1989). Denitrification that reduces nitrate to nitrite and gaseous dinitrogen is triggered when oxygen con-centrations fall below 4–5 µM O2(Cline and Richards, 1972;
Devol, 1978). In general, oxygen-deficient conditions enable denitrification below 100 m of water depth in the Arabian Sea and active denitrification indicated by the accumulation of ni-trite (Naqvi et al., 2008) was found between about 100 and 400 m of water depth (Gaye et al., 2013a; Martin and Cas-ciotti, 2017). The intrusion of PGW that flows in a southward direction along the coast of Oman can occasionally supply oxygen and suppress denitrification (Morrison et al., 1998), as was the case during the late SW monsoon in 2007 between 250 and 400 m of water depth (Gaye et al., 2013a).
Paleoceanographic studies from the Arabian Sea report the existence of a pronounced OMZ and elevated denitrifi-cation during IS and interglacial stages, whereas the Arabian Sea OMZ was better ventilated and denitrification was sup-pressed during the LGM and stadials (Altabet et al., 1995; Higginson et al., 2004; Möbius et al., 2011; Pichevin et al., 2007). Many studies used productivity proxies and SST re-constructions, often in combination with denitrification prox-ies such as sedimentaryδ15N values, to show that warm
peri-ods (IS and interglacials) were characterized by a stronger SW monsoon inducing upwelling and higher productivity than cold periods so that denitrification was switched on in the OMZ (Altabet et al., 1999, 2002; Pichevin et al., 2007; Reichart et al., 1997; Schulte et al., 1999b; Suthhof et al., 2001). After the transition from glacial to interglacial condi-tions with the warm and cold excursions during the Bølling– Allerød and Younger Dryas (YD; 11.7–12.9 ka BP), respec-tively, the Holocene was evidently a more stable period of permanent upwelling and denitrification (Böll et al., 2015; Overpeck et al., 1996; Pichevin et al., 2007; Tierney et al., 2016). There are, however, indications that millennial-scale climate oscillations similar to the North Atlantic cold periods detected by Bond et al. (1997) also occurred in the monsoon realm, but with reduced amplitude (Azharuddin et al., 2017). These Holocene cold periods were found to be characterized by reduced precipitation on land (Menzel et al., 2014) and reduced monsoonal upwelling in the Arabian Sea (Gupta et al., 2003). The volume and intensity of the mid-water OMZ appear to have oscillated related to SW monsoon strength, in-tensity of winter cooling by the NE monsoon, and changes in OMZ ventilation (Böll et al., 2015; Das et al., 2017; Pichevin et al., 2007). Thus, understanding Holocene OMZ dynamics is indispensable to evaluate the recently observed OMZ in-tensification in the Arabian Sea (Banse et al., 2014; Rixen et al., 2014).
Indian Ocean water masses and circulation were quite different at glacial conditions as proxy studies of benthic foraminifera indicate. Deep water was evidently less oxy-genated than at present (Duplessy, 1982; Kallel et al., 1988; Schmiedl and Leuschner, 2005; Waelbroeck et al., 2006). This was reproduced by models that showed a generally more sluggish bottom water ventilation from the Antarctic (Rick-aby and Elderfield, 2005) with reduced oxygen contents due to the increase in sea ice cover (Buchanan et al., 2016; Somes et al., 2017). A better ventilation of the upper water column in the glacial ocean was explained by the better oxygen sol-ubility in the colder water (Somes et al., 2017). Studies from the southern Arabian Sea further suggest that there was much stronger formation of AAIW during the Heinrich events. This glacial AAIW (GAAIW) would ventilate intermediate waters (∼1600 m) in the Arabian Sea where AAIW is not detectable today (Jung et al., 2009).
3 Material and methods 3.1 Sample collection
dur-ing Meteor cruise M74/1b from the continental margin off northern Oman. MC680 and MC681 were sampled in 1 cm intervals and the first 400 cm of core SL163 were sampled in continuous 3 cm intervals. We analyzed alkenones in all sediment samples of SL163;δ15N was analyzed in all sam-ples of MC681 and SL163 and in every second sample of MC680. All sediment samples were freeze-dried and homog-enized prior to chemical treatment and analyses.
3.2 Analyses of the new cores SL163–MC681 and MC680
3.2.1 Stable nitrogen isotopes
The ratio of the two stable isotopes of N (15N/14N) is ex-pressed asδ15N, which is the per mil deviation from the N-isotope composition of atmospheric N2(δ15N=0 ‰):
δ15N= [(RSample−RStandard)/RStandard] ×1000, (1)
where RSample is the 15N/14N ratio of the sample and
RStandardis the15N/14N ratio of atmospheric N2;δ15N
val-ues were determined using a Finnigan MAT 252 isotope ra-tio mass spectrometer after high-temperature flash combus-tion at 1100◦C in a Carlo Erba NA 2500 elemental analyzer. Pure tank N2was calibrated against the International Atomic
Energy Agency reference standards 1 and IAEA-N-2, which were, in addition to an internal sediment standard, also used as working standards. Replicate measurements of a reference standard resulted in an analytical precision better than 0.2 ‰. The mean standard deviation based on duplicate measurements of samples is 0.07 ‰.
3.2.2 Alkenones
Sample preparation and the detailed analytical procedure for alkenone identification are described in Böll et al. (2014). Pu-rified lipid extracts of between 1.5 and 5 g of freeze-dried and homogenized sediment samples were analyzed for alkenone concentrations using an Agilent 6850 gas chromatograph (GC) equipped with a split-splitless inlet system, a silica col-umn (30 m×0.25 µm film thickness×0.32 mm ID; HP-1; Agilent), and a flame ionization detector (310◦C). Alkenone unsaturation ratios were translated into sea surface temper-ature using the core top calibration for the Indian Ocean of Sonzogni et al. (1997b):
SST=(UK370−0.043)/0.033 (2)
with UK370=C37:2/(C37:2+C37:3).
All lipid extracts were analyzed twice, resulting in a mean standard deviation of 0.2◦C. The mean standard deviation
of estimated SST based on replicate extraction and measure-ment of a working sedimeasure-ment standard is 0.5◦C.
3.2.3 Sediment core age models
The age model for SL163 was published by Munz et al. (2017) and is based on 15 accelerator mass spectrometry (AMS)14C datings. In this study the upper 50 cm were taken from multicore MC681. Four additional datings and visual matching of variations in element concentrations were used to correlate SL163 and MC681 in their overlapping parts (Ta-ble S3 and Fig. S3 in the Supplement).
The age model of core MC680 is based on four accelerator mass spectrometry (AMS)14C datings from different core depths measured at Beta Analytics in Miami, FL (see Ta-ble S4 and Fig. S4). Calibration and reservoir age correction were done in the same way as for SL163 (Munz et al., 2017). Both cores have a conspicuous sedimentation hiatus around 5700 years BP. In core SL163 the hiatus was positioned at 57 cm; in MC680 the hiatus was at 37 cm based on a change in facies from olive foraminiferal nanofossil ooze below to olive brown organic-rich nanofossil silty clay above.
3.3 Integration and averaging of SST andδ15N reconstructions
The temperature and δ15N curves of most cores used here were taken from the literature (Table 1) except those for the new records of cores SL163–MC681 and MC680 presented for the first time in this paper (see above). All original data and all calculations are presented as Tables S1 and S2 in the Supplement.
In our compilation, temperature reconstructions from the eastern and southeastern Arabian Sea are based on Mg/Ca ratios of planktonic foraminifera (see methods in, e.g., Govil and Naidu, 2010; Mahesh and Banakar, 2014; Saraswat et al., 2013; Tiwari et al., 2015) except core MD90963, which has alkenone temperatures (Rostek et al., 1997). All other records are alkenone temperatures calculated with the core top calibration of Sonzogni et al. (1997b). Using the pub-lished age models, we averaged the temperature records available from the northern, western, eastern, and southeast-ern Arabian Sea and for the Oman and Somali upwelling systems (Fig. 1b). Composites are based on two to five dif-ferent core records. The data were binned in time slices of 1000 years for each individual sediment core. Next, all time slices of an age interval in a defined study area were aver-aged. The standard deviations of the calculated average SST curves rarely exceed the analytical precision of 0.5◦C of alkenone-based temperature reconstruction.
Temperature reconstructions based on different methods may differ as proxies may be seasonally biased or impacted by dissolution or diagenesis (Huguet et al., 2006; Regen-berg et al., 2014). TEX86- and alkenone-based SST
recon-structions of cores NIOP905 and SO42-KL74 were shown to differ in magnitude and phase as TEX86 temperature
temper-atures derived from planktic foraminiferal assemblages had stronger amplitudes than the alkenone-based annual average SST reconstructions in SO130-275KL of Böll et al. (2014). Two of the records used in this study have both, alkenone and Mg/Ca temperature. In core P178-15P from the Gulf of Aden, alkenone and Mg/Ca temperatures have uniform trends and are significantly correlated (P <0.05) with a slope of 1, and Mg/Ca values are on average 0.5◦C lower than alkenone temperatures (Tierney et al., 2016). A com-parison of alkenone temperatures of Huguet et al. (2006) and Mg/Ca temperatures of Anand et al. (2008) from core NIOP905 also shows that Mg/Ca temperatures are lower. In contrast, the alkenone temperatures of core MD90963 (Rostek et al., 1997) are about 1◦C lower than the two Mg/Ca temperature records of nearby cores SK129-CR04 (Mahesh and Banakar, 2014) and SK157-4 (Saraswat et al., 2005) in the southeastern Arabian Sea. As both Mg/Ca- and alkenone-based temperature reconstructions are calibrated with annual average surface layer temperatures (Regenberg et al., 2014; Sonzogni et al., 1997a, b) and as we can identify no trend in our comparison of results of the two methods in Arabian Sea sediment cores, we have compiled SST recon-structions of both methods.
The averageδ15N values were calculated per time slice in a similar way as SST curves and averaged for the same ar-eas (Fig. 1a). Before averaging the results of all curves of the selected areas, δ15N values were normalized to the av-erage δ15N value of the respective core (Table S1). Some records were too short to use their average δ15N values as they did not cover the main δ15N shift from the glacial to Holocene. In these cases the normalization was done with the average value of a nearby core with δ15N in the same range. This procedure was carried out asδ15N in sediments is impacted by several factors in addition to theδ15N of nitrate upwelled or mixed from subsurface waters. Nitrogen fixation or an allochthonous supply of nitrogen from rivers or the at-mosphere can reduce δ15N in particulate matter (Agnihotri et al., 2011, 2008, 2009; Lückge et al., 2012; Montoya and Voss, 2006). Upwelling from different water depths and the incomplete utilization of nitrate supplied by upwelling may furthermore lead to a gradient with increasing δ15N values offshore of the upwelling areas (Naqvi et al., 2003). Diage-nesis increasesδ15N values in the deep Arabian Sea by up to 3 ‰ in distal sediments (Gaye-Haake et al., 2005; Möbius et al., 2011). The normalization procedure makes the relative changes inδ15N comparable within each area despite differ-ences in the diagenetic imprint and in δ15N sources so that relative changes may be interpreted with respect to the rela-tive intensity of denitrification. Averageδ15N curves of nor-malized values have a standard deviation of up to 1.5 ‰ with most values far below 1 ‰. The standard deviation is gener-ally largest during deglaciation whenδ15N changed rapidly. The curves represent averages of four to seven individual records except for the Somali upwelling system for which only two records were found. For the construction of the
present δ15N chart, the results from surface samples pub-lished by Gaye-Haake et al. (2005) were included (Fig. 1a).
3.4 Climate and biogeochemistry model
We use results from an experiment with a global coupled atmosphere–ocean–sea ice model (the Kiel Climate Model, KCM; Park and Latif, 2009; Park et al., 2009) consisting of ECHAM5 (Roeckner et al., 2003) and NEMO (Madec et al., 2008) to force a global model of the marine biogeochemistry (PISCES; Aumont et al., 2003) in offline mode. KCM has been used for time-slice simulations of the preindustrial and the mid-Holocene climate (Schneider et al., 2010; Khon et al., 2010, 2012; Salau et al., 2012; Jin et al., 2014). Here, orbital parameters (eccentricity, obliquity, and precession) accelerated 10 times were varied transiently as forcing ac-cording to the equations of Berger (1978). The greenhouse gas concentrations follow the standard Paleoclimate Mod-elling Intercomparison Project Phase III (PMIP3) protocol (Braconnot et al., 2012) based on Indermühle et al. (1999). Changes in the ice sheets are neglected.
The ocean component (OPA9) uses a tripolar grid with a 2◦ zonal resolution, and a meridional resolution varying from 0.5◦ at the Equator to 2◦×cos (latitude) polewards of 20◦. The water column is divided into 31 layers, with 20 layers in the upper 500 m (known as the ORCA2 config-uration). ECHAM5, the atmospheric component of KCM, is run in T31 resolution with 19 layers corresponding to a grid cell size of about 400 km×400 km. PISCES (Aumont et al., 2003) simulates the marine biogeochemistry including pro-cesses that determine dissolved oxygen concentrations based on the oceanic circulation as provided by NEMO (Madec et al., 2008) and an NPZD-type (nutrient–phytoplankton– zooplankton–detritus) description of the marine ecosystem. NEMO–PISCES in the ORCA2 configurations has been used to study monsoon and biological production interconnections in a recent study by Le Mézo et al. (2017).
Age [ka BP]
0 5 10 15 20 25
S
e
a
s
u
rf
a
c
e
t
e
m
p
e
ra
tu
re
[
°C
]
22 24 26 28 30
North West Oman upwelling Somali upwelling East
Southeast
LH MH EH YD H1 LGM IS2
Figure 3.Millennial regional averages of SST (◦C) and±1σ stan-dard deviation in the northern, western, eastern, and southeastern Arabian Sea and the Oman and Somali upwelling areas of the last 25 kyr. Regions are indicated in Fig. 1. Times of interstadial 2 (IS2), Heinrich Event 1 (H1), and Younger Dryas (YD) are indicated by grey bars. The last glacial maximum (LGM), early Holocene (EH), mid-Holocene (MH), and late Holocene (LH) are also marked. Lines mark the beginning of MH and LH.
rate depends on temperature with a Q10 of 1.8 and on the
oxygen level, with a reduced rate for O2concentrations
be-low 6 µmol L−1. We also use an idealized age tracer that is set to zero in the surface layer and increases with time else-where. Advection and mixing are also applied to the age tracer. This tracer gives an indication of the subsurface cir-culation strength. Here we use it to analyze the change in the average age of the water masses in Arabian Sea OMZ over time.
We do not attempt to provide a full model analysis of the Arabian Sea OMZ in this paper, but will mainly use it as an additional tool to estimate the most likely causes for the sed-iment core analyses of OMZ intensity changes. Some basic features of the simulated OMZ can be found in the Supple-ment (Figs. S5–S7).
Figure 4.Annual SST distribution in◦C from the World Ocean Atlas (Locarnini et al., 2013)(a); alkenone- and Mg/Ca-derived SST reconstruction for the time slice from 17–18 ka BP(b)from cores shown in Fig. 1.
4 Results
4.1 Temperature reconstruction
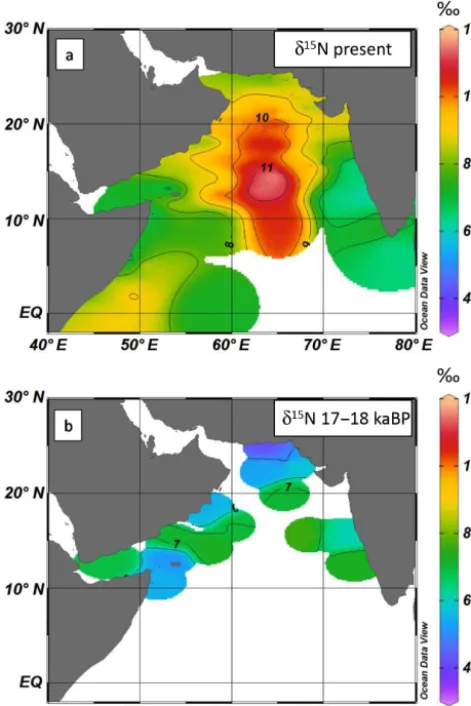
temper-Figure 5.Theδ15N values in ‰ in recent surface sediments(a); δ15N in sediments at 17–18 ka BP(b)from surface and core loca-tions shown in Fig. 1.
ature drop during the YD in the available records of higher resolution (Fig. S8). In the average curves (Fig. 3) the YD is visible only in the east and west.
In order to compare the modern and glacial SST distribu-tions (Fig. 4a, b) we plotted the SST map from the World Ocean Atlas (Fig. 4a; Locarnini et al., 2013) and the time slice at 17–18 ka BP from the core records (Fig. 4b). This time slice is neither an IS nor a Heinrich event and has the best data density of the glacial (see Sect. S2). There is a change in the SST pattern in the basin between glacial condi-tions and the Holocene. During the last glacial, the SST min-imum was situated in the northern Arabian Sea and Oman upwelling and there was generally a north–south tempera-ture increase (Figs. 3; 4b). During the Holocene the SST pattern deviates from this north–south increase (Figs. 3; 4a): (i) SSTs in the Oman and Somali upwelling areas are lower than northern Arabian Sea temperatures, and (ii) SSTs in the eastern and southeastern Arabian Sea are high and in the
same range. Small drops in SST occur in some of the curves at about 9 and 4–5 ka BP (Fig. 3).
4.2 Patterns ofδ15N
The absoluteδ15N values in surface sediments in the present Arabian Sea are elevated with values between 6 and>12 ‰ compared with those of the last glacial with values between 3.5 and 7 ‰ (Fig. 5a, b). Holoceneδ15N values are highest in the central part of the basin and in the Oman upwelling area and lower in most shelf and slope sediments outside up-welling areas (Figs. 5a and 6). Glacial shelf and slope sedi-ments haveδ15N values below 6 ‰. Similar to the present sit-uationδ15N increased towards the center of the basin. How-ever, there are no glacialδ15N records from the deepest part of the central Arabian Sea (Figs. 1a; 5b).
Theδ15N values increase between 16 and 14 ka BP in all sectors except in the eastern Arabian Sea, where the increase occurs at about 8 ka BP (Fig. 6). The normalized highest rel-ative increase inδ15N values by about 3.5 ‰ is observed in the northern Arabian Sea. All other normalizedδ15N curves increase by ≤2 ‰. Most integrated curves show a relative minimum during the YD whenδ15N almost returned to the low glacial values. The general pattern of theδ15N curves is thus similar to the GISP ice coreδ18O record during the glacial and deglaciations (Fig. 6). The threeδ15N curves of high resolution (Fig. S9) follow the GISP core with distinct minima during Heinrich Event 1 (H1) and the YD and a max-imum during IS1, whereas IS2 maxima are found neither in the Somali upwelling area nor in the eastern Arabian Sea (Fig. 6). The Holoceneδ15N patterns differ across the basin. An early Holocene (>8.2 ka BP; Walker et al., 2012) maxi-mum is observed in the open western Arabian Sea including the upwelling areas, whereas a late Holocene (<4.2 ka BP; Walker et al., 2012) maximum is visible in the northern and eastern part of the Arabian Sea. An early and late Holocene δ15N peak occurs in the Oman and Somali upwelling areas.
5 Discussion
5.1 Temperature differences between glacial and the Holocene
[image:9.612.49.285.68.422.2]in-Figure 6.Theδ18O values in ‰ from the GISP2 ice core (Grootes and Stuiver, 1997) and sea level (m above NN) reconstruction from the Red Sea (Siddall et al., 2003) (a)compared with millennial regional averages of normalized and averaged δ15N (‰) values from the northern (b), eastern(c), and western (d)Arabian Sea, the Oman(e), and Somali(f)upwelling area. Total organic carbon mass accumulation in the Arabian Sea (TOC MAR in Tg C year−1; data from Cartapanis et al., 2016, and Tim Rixen, unpublished) and insolation at 30◦N in W m−2(Berger and Loutre, 1991)(g)during the last 25 kyr. Error bars denote±1σ. Grey bars and abbreviations as in Fig. 3; interstadial 1 (IS1).
solation during the glacial (Böll et al., 2014, 2015; Reichart et al., 2004).
The observed regional differences in temperature rise from the LGM to the Holocene (Fig. 3) led to a change in the
gen-eral SST pattern (Fig. 4a, b). The SW monsoon SST pat-tern in the modern Arabian Sea with its NW–SE-oriented gradient (Fig. 4a) is strongly modulated by upwelling off Oman and Somalia and the inflow of warm and low-saline surface water from the Bay of Bengal via the WICC (Vijith et al., 2016) (Fig. 2a). The WICC inflow is fed by the North Equatorial Current and starts in the post-SW-monsoon pe-riod, probably forced by local winds around the southern tip of India (Suresh et al., 2016). It is related to prevailing sea level height difference between the Arabian Sea and Bay of Bengal, which is due to the enhanced precipitation and river discharge to the bay (Shankar and Shetye, 2001). A reason for the more latitudinal gradient of glacial isotherms (Fig. 4b) was a strengthened NE and a weakened SW monsoon so that winter cooling in the northern Arabian Sea was much stronger (Reichart et al., 2004) and upwelling was reduced or even inactive during the glacial; the cold water source in the western Arabian Sea was strongly reduced (Böll et al., 2015; Duplessy, 1982). In addition, salinity reconstructions indicate that there was less advection of low-salinity, warm surface waters by the WICC into the eastern Arabian Sea from the Bay of Bengal, probably due to the low glacial pre-cipitation and river runoff (Mahesh and Banakar, 2014).
Glacial SSTs off Somalia are in a similar range as in the western and eastern Arabian Sea and almost 2◦C higher than off Oman. This suggests that upwelling off Somalia was weaker than off Oman or even shut down. At present, SW monsoon upwelling is driven by the positive wind stress curl induced by the Findlater Jet – a low-level, cross-equatorial jet stream recurring during each SW monsoon over eastern Africa and the western Indian Ocean (Brock et al., 1991; Findlater, 1977). The strength of the Findlater Jet is directly coupled with the moisture transport to the Indian monsoon region (Fallah et al., 2016). Precipitation on land, such as that from the All-India Rainfall Series, is thus used as a measure for SW monsoon strength (Mooley and Parthasarathy, 1984). However, even at present there is no straightforward cou-pling between high rainfall on land and low SST (Levine and Turner, 2012) and thus also no direct correlation with pro-ductivity. Further, sediment proxies indicate and modeling studies suggest that the position of the Findlater Jet changed with monsoon intensity and this could decouple SST, pro-ductivity, and monsoon strength (Anderson and Prell, 1992; Le Mézo et al., 2017; Sirocko et al., 1991). The Himalayan ice shield during glacial conditions led not only to a reduced temperature gradient between land and sea so that the Find-later Jet weakened, but also to an eastward shift of the conti-nental low-pressure cell so that the Jet had a more latitudinal orientation (Le Mézo et al., 2017; Sirocko et al., 1991). Our data suggest that its glacial position was not favorable for upwelling off Somalia.
Age [ka BP]
0 5 10 15 20 25
S
e
a
s
u
rf
a
c
e
t
e
m
p
e
ra
tu
re
d
e
v
ia
ti
o
n
[
°C
]
-2.0 -1.0 0.0 1.0 2.0 3.0
E
ffe
c
tiv
e
m
o
is
tu
re
0.0 0.5 1.0 1.5 2.0 2.5 3.0 SST northern Arabian Sea-Oman upwelling
SST northern Arabian Sea-Somali upwelling Mean effective moisture
Indian monsoon effective moisture
LH MH EH YD H1 LGM IS2
Figure 7.Millennial regional-averaged SST from the northern Ara-bian Sea minus Oman-upwelling-averaged SST in◦C (black line) and northern Arabian Sea minus Somali-upwelling-averaged SST (red line; regions are indicated in Fig. 1) compared with reconstruc-tions of the mean effective moisture in southern and central Asia (blue line) and the Indian monsoon region (green line) from conti-nental archives (Herzschuh, 2006). Grey bars and abbreviations as in Fig. 3.
southward temperature increase (Böll et al., 2015). Enhanced upwelling is indicated by a positive or rising index as it shows lower temperatures in the more southern upwelling areas compared to the northern Arabian Sea. In Fig. 7 we com-pare it with the index of effective moisture calculated from a large number of lake, peat, loess, and river records from the Asian continent by Herzschuh (2006). Peaks in the upwelling indices at 22–23 ka BP suggest that upwelling prevailed dur-ing IS2. Durdur-ing this short warm interval the upwelldur-ing was enhanced off Oman and became active for about 2 millennia off Somalia. The Somali upwelling notably started at about 16 ka BP, which could reflect a shift of the Findlater Jet to a position more parallel to the western margin of the Ara-bian Sea and thus favorable for upwelling in both upwelling areas. The temperature minimum during the YD, which is quite pronounced in SST records of high resolution (Böll et al., 2015; Saraswat et al., 2013; Schulte and Muller, 2001; Tierney et al., 2016; see Fig. S8), is reflected as a minimum
in the upwelling indices at 11–13 ka BP (Fig. 7). Both the Oman and Somali upwelling indices increased during further warming after the YD at 11 ka BP. The moisture index drops after the early Holocene to the present in parallel with tem-perature records from the continent (Herzschuh, 2006; Mar-cott et al., 2013; Peterse et al., 2014), but upwelling indices remain on about the same level or even increase during the mid-Holocene (Fig. 7). We surmise that this is a signal of a mid-Holocene shift in the position of the Findlater Jet. Dur-ing the warmest period in the early Holocene the Findlater Jet reached its position closest to the coast so that the Oman upwelling may have been restricted to a much smaller area (Le Mézo et al., 2017). In the mid-Holocene the Findlater Jet shifted offshore and upwelling remained high, covering a larger area so that SST minima prevailed and productivity was enhanced (Le Mézo et al., 2017).
Holocene temperature minima do not coincide in the basin and may have different causes (Fig. 3). SST minima near coastal stations in the upwelling centers during the early Holocene climatic optimum could indicate enhanced up-welling (Böll et al., 2015). The second Holocene tempera-ture minimum at around 4–5 ka BP in the eastern part of the basin coincides with a severe drought on the Indian penin-sula (Prasad et al., 2014) and a colder climate in other terres-trial climate records from central Asia (Berkelhammer et al., 2012; Hong et al., 2003; Ponton et al., 2012). The SST mini-mum may thus be due to cooling by a strengthened NE mon-soon due to colder winters rather than to warming-related en-hanced upwelling.
5.2 Nitrogen cycling in the glacial
At present, nitrate reduction between 100 and 400 m of water depth leaves residual nitrate withδ15N values up to>20 ‰, and upwelling can transport enriched nitrate from 250 to 300 m of water depth into surface waters in the western Arabian Sea upwelling areas (Gaye et al., 2013a, b; Yoshi-nari et al., 1997). Therefore, near shore sediments from the upwelling area off Oman have δ15N elevated to >10 ‰ (Fig. 5a), andδ15N values in all other recent sediments col-lected at water depths of<1000 m, i.e., at depths where the diagenetic effect on sedimentaryδ15N is small or negligible (Altabet and Francois, 1994; Gaye-Haake et al., 2005), are between 6 and 8 ‰. This is identical to the signal of sub-thermocline nitrate, which feeds productivity primarily via seasonal deep mixing outside the upwelling areas (Gaye et al., 2013a, b). Theδ15N values>11 ‰ in the central part of the basin are a result of (i) the offshore advection of15 N-enriched nitrate from upwelling areas where nitrate is not completely utilized (Naqvi et al., 2003) and (ii) an early dia-genetic increase inδ15N in deep sea sediments (Gaye-Haake et al., 2005; Möbius et al., 2011).
lowδ15N values between 4 and 6 ‰ from<1000 m of wa-ter depth from the time slice 17–18 ka BP (Fig. 5b) and the LGM (Fig. 6; Table S1) suggest that denitrification was much reduced or absent. The δ15N values up to 7 ‰ during IS1 and IS2 in the entire basin except in the eastern Arabian Sea and Somali upwelling area (Table S1 and Fig. S9) indicate that denitrification was enhanced but restricted to the north-ern and northwestnorth-ern part of the basin during the IS. The δ15N minima of the YD and H1 are found in all records of high resolution and the average curves (Figs. 6 and S9). The oscillations in theδ15N records thus follow the primary pro-ductivity, which was enhanced during the warm phases due to stronger upwelling and reduced during the LGM, YD and Heinrich events (Leuschner and Sirocko, 2003; Reichart et al., 1997; Schulte et al., 1999a; Suthhof et al., 2001). Excep-tions from this productivity pattern were reported from the eastern Arabian Sea, where the LGM had enhanced produc-tivity at some locations (Naik et al., 2017), and from the NE-monsoon-dominated northern Arabian Sea where productiv-ity was enhanced during the YD and Heinrich events due to the strong winter cooling (Reichart et al., 2004).
The OMZ sediments from the northern Arabian Sea were indistinctly laminated during most of the last glacial, ing suboxic conditions, but were clearly bioturbated, indicat-ing fully oxic conditions only durindicat-ing the YD and Heinrich events (Suthhof et al., 2001). Aragonite preservations and δ13C of benthic foraminifera further suggest that enhanced formation of GAAIW ventilated the lower OMZ from about 800 to 1800 m, especially during stadials (Böning and Bard, 2009; Jung et al., 2009; Naidu et al., 2014; Schmiedl and Leuschner, 2005). A similar increase in GAAIW formation was observed in the Atlantic and Pacific and was explained by the strong reduction of NADW formation and a simulta-neous strengthening of SAMW and GAAIW formation due to the reduced salinity and density of North Atlantic surface water (Rickaby and Elderfield, 2005; Ronge et al., 2015). A complete breakdown of the Atlantic meridional overturning circulation (AMOC) during the stadials led to the strongest GAAIW production (Rickaby and Elderfield, 2005) and thus to the observed complete OMZ ventilation even in the north-ern Arabian Sea (Suthhof et al., 2001). The planktonic ni-trate source is at 250–300 m depths in upwelling areas and at even shallower sub-thermocline depths outside upwelling areas. The water masses feeding nitrate to the surface are thus the ASHSW and ICW. ASHSW formation was possi-bly stronger when the NE monsoon was stronger and the cli-mate was more arid so that it better ventilated the OMZ from above. The enhanced formation of SAMW also contributed to better ventilation. At present, SAMW is the major oxygen source to the Arabian Sea OMZ, while PGW, RSW, and IIW are only small contributors of oxygen (Fine et al., 2008; You, 1998). During glacial conditions, the increased SAMW pro-duction occurred further north due to the northward shift of the subpolar front similar to the GAAIW (Rickaby and El-derfield, 2005) and better ventilated the upper OMZ (Böning
and Bard, 2009). It carried more oxygen due to less mixing with IIW and RSW, and an accelerated circulation (Böning and Bard, 2009) led to a lower residence time in the Arabian Sea. Moreover, it is quite possible that glacial SAMW car-ried fewer preformed nutrients due to the better nutrient uti-lization related to increased eolian supply of phosphate and trace metals to the region of SAMW formation (Somes et al., 2017). The lower amount of preformed nutrients further re-duced productivity in the Arabian Sea. Better ventilation and reduced upwelling of nutrient-poorer water thus coincided during stadials and explain the complete oxygenation. The observed suboxic conditions discernible from laminated sed-iments in the OMZ during normal glacial conditions (Suth-hof et al., 2001) did not produce enhancedδ15N signals in the sediments. It is feasible that the oxygen concentrations did not drop below the threshold of denitrification, but it is also possible that conditions in the Arabian Sea were com-parable to those in the present Bay of Bengal where nitrate reduction and denitrification occur locally at a low level, but the enriched nitrate is not transported into surface waters due to stratification (Bristow et al., 2017). Enhanced N fixation has been suggested as an alternative reason for the lowδ15N found, especially during stadials, in the Arabian Sea (Altabet et al., 1995; Emeis et al., 1995; Suthhof et al., 2001). It could have been stimulated by the supply of excess phosphate and iron from the more arid continents (Prins, 1999; Sirocko et al., 2000). In this case, N fixation in surface waters provided N with lowδ15N that may have masked the highδ15N signal from denitrification.
5.3 Nitrogen cycling in the Holocene
vigor-ous upwelling during the Holocene climatic optimum was fed by inflow of ICW from the south, which could have bet-ter ventilated the wesbet-tern Arabian Sea and thus compensated for the enhanced respiration (Rixen et al., 2014).
Denitrification has continuously increased during the late Holocene in almost the entire basin but focused in the northern Arabian Sea (Fig. 6b). This trend coincides with Holocene cooling and a strengthening of the NE mon-soon. Only in the open western Arabian Sea outside di-rect upwelling influence doδ15N values decrease in the late Holocene (Fig. 6d). This may be related to a shift of the Find-later Jet in the offshore direction as modeled by Le Mézo et al. (2017), which may have led to better nutrient availability in the western Arabian Sea. But as there are very few late Holocene data from this region (Table S1) this record has to be interpreted with caution.
Circulation probably changed after the sea level in the Per-sian Gulf and Red Sea reached its present position at about 6 ka BP, and water masses from these two basins prevented the strong ingression of ICW to the northeastern part of the Arabian Sea (Naidu and Govil, 2010; Pichevin et al., 2007). The ventilation of the OMZ by PGW and RSW today is re-stricted to the western part where the OMZ is much weaker than in the northeastern part of the basin (Gaye et al., 2013a; Morrison, 1997). The interplay of reduced OMZ ventilation in the north and enhanced NE monsoon productivity is likely the reason for the relocation of the OMZ and denitrification maximum to the NE during the Holocene. Enhanced produc-tivity in the eastern Arabian Sea since the mid-Holocene as reconstructed from sediment cores (Agnihotri et al., 2003; Kessarkar et al., 2013, 2010) could have added to this relo-cation. It is likely that the inflow of low-density surface wa-ter suppressed primary productivity in the easwa-tern Arabian Sea in the early Holocene. After precipitation declined and the sea level difference between the Bay of Bengal and Ara-bian Sea dropped at about 8 ka BP the inflow of warm, low-saline water with the northeast monsoon current and WICC to the eastern Arabian Sea declined (Mahesh and Banakar, 2014). This coincides with a rise in eastern Arabian Seaδ15N (Fig. 6c). The OMZ is generally weaker along the west coast of India due to the northward undercurrent, which leads to the oxygenation of subsurface water during the SW monsoon (Resplandy et al., 2012), and its upwelling and convective transport into surface waters along the coast is likely to ex-plain the lowδ15N in the sediments off the west coast of India (Fig. 5a).
Results from the global climate and ocean biogeochem-istry model (KCM–PISCES; Sect. 3.4) driven by astro-nomical forcing over the Holocene suggest that ventilation changes were important drivers of the late Holocene Arabian Sea OMZ intensification (Fig. 8). The model produces a con-tinuous increase in the OMZ volume in the Arabian Sea from 9 ka BP to the present. This is driven mainly by the increasing age (time since contact with the surface) of the water masses in the Arabian Sea OMZ. Arabian Sea export production is
fairly constant in the model (Fig. 8) and can thus be ruled out as the driver for deoxygenation. An increase in export pro-duction is modeled only in a small area west of the southern Indian coast, indicating that export changes may have played only a local role (not shown). The decelerated circulation al-lowed more oxygen to be consumed by remineralization; it thus appears to be the main driver of the progressive deoxy-genation in the model (Fig. 8) and can explain the increasing water column denitrification in the Arabian Sea in theδ15N records (Fig. 6).
Total organic carbon mass accumulation rates (TOC MARs; Fig. 6g) reflect productivity, organic matter preser-vation, and burial efficiency (Cowie et al., 2014; Cowie and Hedges, 1993; Müller and Suess, 1979). Similar to δ15N, Arabian Sea TOC MAR deviates from the global pattern (Cartapanis et al., 2016). Whereas the global TOC MAR significantly declines during deglaciation and remains low throughout the Holocene, the TOC MAR of the Arabian Sea shows the decline starting at about 20 ka BP but rises during the middle and late Holocene to values similar to those of the glacial (Fig. 6g). This pattern is consistent in the entire Ara-bian Sea (see data compiled by Cartapanis et al., 2016). As discussed in detail in Cartapanis et al. (2016) the drop in TOC MAR during deglaciation may indicate (i) a reduction of pro-ductivity, (ii) a lower transfer and burial efficiency of TOC to the sediments due to the reduced mineral ballast and the tem-porary storage on the growing continental shelves, and (iii) a reduced oxygen exposure time due to faster burial and re-duced bottom water oxygenation of the glacial ocean. As we have discussed above, productivity increased in large parts of the basin due to a strengthening of the SW monsoon during deglacial warming. Productivity thus could not explain the reduced TOC MAR after the LGM. A reduced burial effi-ciency and increased deep water oxygen content are thus the most likely drivers of the deglacial TOC MAR drop in the basin. The Holocene rise in TOC MAR, inconsistent with the global trend, may likewise be due to better preservation caused by progressive mid-water deoxygenation so that oxy-gen exposure time again decreased. TOC MAR may have been augmented by enhanced NE monsoon productivity in the northern part of the basin and increasing burial efficiency by rising dust supply from the continents due to aridifica-tion after the mid-Holocene (Menzel et al., 2014; Overpeck et al., 1996; Prasad et al., 2014; Sirocko et al., 1993). The results of the KCM model, however, imply that productivity changes are not required as the increasing age of the water mass intensifies the Arabian Sea OMZ during the Holocene.
6 Summary and conclusions
circula-O
rg
a
n
ic
c
a
rb
o
n
e
x
p
o
rt
[g
C
m
o
n
th
-1
]
0.0 2.0e+12 4.0e+12 6.0e+12 8.0e+12 1.0e+13 1.2e+13 1.4e+13 1.6e+13
O
M
Z
v
o
lu
m
e
[
e
m
]
1
4
3
0 2 4 6
OC export AS OC export WAS OC export EAS OMZ volume
Age [ka BP]
0 1 2 3 4 5 6 7 8 9
M
e
a
n
a
g
e
[y
e
a
rs
]
60 80 100 120
O
M
Z
v
o
lu
m
e
[
e
m
]
1
4
3
0 2 4 6
Mean age OMZ volume
(a)
[image:14.612.129.466.69.408.2](b)
Figure 8.Simulated volume of the Arabian Sea OMZ (70 µmol L−1threshold, black) and export production in the entire Arabian Sea (red), western Arabian Sea (green) and eastern Arabian Sea (blue) over the Holocene (a). OMZ volume and age of water masses (time since contact with the surface) averaged over the OMZ(b). Arabian Sea defined as 55–75◦E, 8.5–22.5◦N; border between west and east defined at 68.5◦E.
tion. Monsoonal upwelling along the western coasts was very much reduced or absent, as was the inflow of low-salinity water from the Bay of Bengal. Therefore, the gen-eral temperature gradient had a stronger insolation-driven N– S trend compared to the circulation-driven NW–SE trend of the Holocene. Upwelling indices calculated from the tem-perature difference between the northern Arabian Sea and the Somali and Oman upwelling centers reveal depleted or even paused upwelling during the LGM and stadials, while upwelling was enhanced during IS. A shift of the Findlater Jet to a stronger E–W orientation during the glacial could have prevented upwelling off Somalia, while it continued off Oman at a reduced rate. The prevalence of strong upwelling during the mid-Holocene despite a weakening of the SW monsoon could be due to a shift of the Findlater Jet in the offshore direction.
The compilation of δ15N data shows strong millennial-scale oscillations during the glacial with depletedδ15N val-ues during the LGM and stadials and enrichedδ15N during
IS. These oscillations are caused by changes in the OMZ ven-tilation driven by millennial-scale fluctuations in the oceanic thermohaline circulation. Complete oxygenation of the OMZ occurred during stadials when SAMW formation was en-hanced, and it was more strongly oxygenated due to its re-duced residence time. The relative instability in thermoha-line circulation led to fast changes in OMZ oxygenation with minima during the IS. In analogy to conditions in the recent Bay of Bengal,δ15N values of 4–6 ‰ in glacial sediments may not necessarily indicate that denitrification was com-pletely absent. Moderate or occasional denitrification may have taken place in a more oxygenated OMZ, but itsδ15N signal was not recorded in the sediment because the sub-thermocline water mass was isolated from the euphotic zone by stratification. Also, atmospheric N sources could have contributed to the low δ15N and compensated for the en-hancedδ15N in the OMZ.
reorgani-zation of the nitrogen cycle as global climate and thermo-haline circulation provides more stable conditions. Stronger upwelling in the mid-Holocene was accompanied by stronger ventilation of the western part of the basin, which is also ven-tilated by PGW, especially after sea level reached its present maximum at 6 ka BP. The present denitrification maximum in the northeastern part of the basin was formed during the middle and late Holocene and is induced by a strengthened NE monsoon due to Holocene cooling but also due to re-duced ventilation of the northern part of the basin. Results of the KCM–PISCES model simulation show a progressive in-tensification of the OMZ over the entire model run of 9 kyr. Productivity is constant in the model and the main driver of increasing deoxygenation and denitrification is the pro-longed residence time of OMZ waters. OMZ intensification probably explains the increase in TOC MAR throughout the Holocene also deviating from the global trend.
Data availability. Data on alkenone SST and stable nitrogen iso-topes are available at https://doi.org/10.1594/PANGAEA.884086.
Supplement. The supplement related to this article is available online at: https://doi.org/10.5194/bg-15-507-2018-supplement.
Competing interests. The authors declare that they have no conflict of interest.
Special issue statement. This article is part of the special issue “Progress in quantifying ocean biogeochemistry – in honour of Ernst Maier-Reimer”. It is not associated with a conference.
Acknowledgements. We are grateful to the German Federal Min-istry of Education and Research (BMBF) for funding the BMBF projects CARIMA and CAHOL as subprojects of the research programs CAME and CAME II (BMBF grants 03G0806A, 03G0806B, 03G0806C, 03G0864A). We thank Frauke Langenberg and Sabine Beckmann for analytical support. Reiner Schlitzer and the ODV group are acknowledged for supplying the program Ocean Data View used for Figs. 1, 2, 4, and 5 (Ocean Data View available at http://odv.awi.de). Computations with KCM were carried out at the computing center of the University of Kiel. The authors are indebted to the late Ernst Maier-Reimer for his curiosity and interest in their research over many years and his never-ending willingness to help and test hypotheses with his numerical models.
Edited by: Christoph Heinze
Reviewed by: Arun Singh and three anonymous referees
References
Agnihotri, R., Bhattacharya, S. K., Sarin, M. M., and Somayajulu, B. L. K.: Changes in surface productivity and subsurface denitri-fication during the Holocene: a multiproxy study from the eastern Arabian Sea, Holocene, 13, 701–713, 2003.
Agnihotri, R., Kurian, S., Fernandes, M., Reshma, K., D’Souza, W., and Naqvi, S. W. A.: Variability of subsurface denitrification and surface productivity in the coastal eastern Arabian Sea over the past seven centuries, Holocene, 18, 755–764, 2008.
Agnihotri, R., Naqvi, S. W. A., Kurian, S., Altabet, M. A., and Brat-ton, J. F.: Is delta N-15 of Sedimentary Organic Matter a Good Proxy for Paleodenitrification in Coastal Waters of the Eastern Arabian Sea?, in: Indian Ocean Biogeochemical Processes and Ecological Variability, edited by: Wiggert, J. D., Hood, R. R., Naqvi, S. W. A., Brink, K. H., and Smith, S. L., Geophysical Monograph Series, American Geophysical Union, Washington, 2009.
Agnihotri, R., Mandal, T. K., Karapurkar, S. G., Naja, M., Gadi, R., Ahammmed, Y. N., Kumar, A., Saud, T., and Saxena, M.: Stable carbon and nitrogen isotopic composition of bulk aerosols over India and northern Indian Ocean, Atmos. Environ., 45, 2828– 2835, 2011.
Altabet, M. A.: Isotopic Tracers of the Marine Nitrogen Cycle: Present and Past, in: Marine Organic Matter: Biomarkers, Iso-topes and DNA, The Handbook of Environmental Chemistry, vol. 2N, edited by: Volkman, J. K., Springer, Berlin, Heidelberg, https://link.springer.com/chapter/10.1007/698_2_008, 2006. Altabet, M. A. and Francois, R.: Sedimentary nitrogen isotopic
ra-tio as a recorder for surface ocean nitrate utilizara-tion, Global Bio-geochem. Cy., 8, 103–116, 1994.
Altabet, M., Francois, R., Murray, D., and Prell, W.: Climate-related variations in denitrification in the Arabian Sea from sediment 15N/14N ratios, Nature, 373, 506–509, 1995.
Altabet, M., Murray, D. W., and Prell, W.: Climatically linked oscil-lations in Arabian Sea denitrification over the past 1 m.y.: Impli-cations for the marine N cycle, Paleoceanography, 14, 732–743, 1999.
Altabet, M., Higginson, M. J., and Murray, D. W.: The effect of millennial-scale changes in Arabian Sea denitrification on atmo-spheric CO2, Nature, 415, 159–162, 2002.
Anand, P., Kroon, D., Singh, A. D., Ganeshram, R. S., Ganssen, G., and Elderfield, H.: Coupled sea surface temperature-seawater d18O reconstructions in the Arabian Sea at the mil-lenial scale for the last 35 ka, Paleoceanography, 23, PA4207, https://doi.org/10.1029/2007PA001564, 2008.
Anderson, D. M. and Prell, W.: The structure of the southwest mosoon winds over the Arabian Sea during the late Quaternary: observations, simulations, and marine gelological evidence, J. Geophys. Res., 97, 15481–15487, 1992.
Annan, J. D. and Hargreaves, J. C.: A new global reconstruction of temperature changes at the Last Glacial Maximum, Clim. Past, 9, 367–376, https://doi.org/10.5194/cp-9-367-2013, 2013. Aumont, O., Maier-Reimer, E., Blain, S., and Monfray, P.:
An ecosystem model of the global ocean including Fe, Si, P colimitations, Global Biogeochem. Cy., 17, 1060, https://doi.org/10.1029/2001GB001745, 2003.
Arabian Sea during the Holocene and Younger Dryas: A multi-proxy approach, Palaeogeogr. Palaeocl., 483, 136–146, 2017. Banakar, V. K., Oba, T., Chondakar, A. R., Kuramoto, T.,
Ya-mamoto, M., and Minagawa, M.: Monsoon related changes in sea surface productivity and water column denitrification in the Eastern Arabian Sea during the last glacial cycle, Mar. Geol., 219, 99–108, 2005.
Banakar, V. K., Mahesh, B. S., Burr, G., and Chodankar, A. R.: Climatology of the Eastern Arabian Sea during the last glacial cycle reconstructed from paired measurement of foraminiferal delta O-18 and Mg/Ca, Quatern. Res., 73, 535–540, 2010. Banse, K., Naqvi, S. W. A., Narvekar, P. V., Postel, J.
R., and Jayakumar, D. A.: Oxygen minimum zone of the open Arabian Sea: variability of oxygen and nitrite from daily to decadal timescales, Biogeosciences, 11, 2237–2261, https://doi.org/10.5194/bg-11-2237-2014, 2014.
Bard, E., Rostek, F., and Sonzogni, C.: Interhemispheric synchrony of the last deglaciation inferred from alkenone palaeothermome-try, Nature, 385, 707–710, 1997.
Berger, A.: Long-term variations of daily insolation and Quaternary climate changes, J. Atmos. Sci., 35, 2362–2367, 1978.
Berger, A. and Loutre, M. F.: Insolation values for the climate of the last 10 million years, Quatern. Sci. Rev., 10, 297–317, 1991. Berkelhammer, M., Sinha, A., Stott, L., Cheng, H., Pausata, F. S.
R., and Yoshimura, K.: An Abrupt Shift in the Indian Monsoon 4000 Years Ago, in: Climates, Landscapes, and Civilizations, edited by: Giosan, L., Fuller, D. Q., Nicoll, K., Flad, R. K., and Clift, P. D., Geophysical Monograph Series, American Geophys-ical Union, Washington, 2012.
Bindoff, N. L. and McDougall, T. J.: Decadal changes along an Indian Ocean section at 32◦S and their interpretation, J. Phys. Oceanogr., 30, 1207–1222, 2000.
Böll, A., Lückge, A., Munz, P., Forke, S., Schulz, H., Ra-maswamy, V., Rixen, T., Gaye, B., and Emeis, K.-C.: Late Holocene primary productivity and sea surface temperature variations in the northeastern Arabian Sea: Implications for winter monsoon variability, Paleoceanography, 29, 778–794, https://doi.org/10.1002/2013PA002579, 2014.
Böll, A., Schulz, H., Munz, P., Rixen, T., Gaye, B., and Emeis, K.-C.: Contrasting sea surface temperature of summer and winter monsoon variability in the northern Arabian Sea over the last 25 ka, Palaeogeogr. Palaeocl., 426, 10–21, 2015.
Bond, G., Showers, W., Cheseby, M., Lotti, R., Almasi, P., deMeno-cal, P. B., Priore, P., Cullen, H. M., Hajdas, I., and Bonani, G.: A pervasive millenial-scale cycle in North Atlantic Holocene and Glacial Climates, Science, 278, 1257–1266, 1997.
Böning, P. and Bard, E.: Millenial/centennial-scale thermocline ventilation changes in the Indian Ocean as reflected by arago-nite preservation and geochemical variations in the Arabian Sea sediments, Geochim. Cosmochim. Ac., 73, 6771–6788, 2009. Braconnot, P, Harrison, S., Kageyama, M., Bartlein, P.,
Masson-Delmotte, V., Abe-Ouchi, A., Otto-Bliesner, B., and Zhao, Y.: Evaluation of climate models using paleoclimatic data, Nat. Clim. Change, 2, 417–424, 2012.
Brahney, J., Ballantyne, A. P., Turner, B. L., Spaulding, S. A., Otu, M., and Neff, J. C.: Separating the influences of diagenesis, pro-ductivity and anthropogenic nitrogen deposition on sedimentary delta N-15 variations, Org. Geochem., 75, 140–150, 2014.
Brandes, J. A. and Devol, A. H.: A global marine-fixed ni-trogen isotopic budget: Implications for Holocene ni-trogen cycling, Global Biogeochem. Cy., 16, 1120, https://doi.org/10.1029/2001GB001856, 2002.
Brandes, J. A., Devol, A. H., Yoshinari, T., Jayakumar, D. A., and Naqvi, S. W. A.: Isotopic composition of nitrate in the cen-tral Arabian Sea and eastern tropical North Pacific: A tracer for mixing and nitrogen cycles, Limnol. Oceanogr., 43, 1680–1689, 1998.
Bristow, L. A., Callbeck, C. M., Larsen, M., Altabet, M. A., Dekaezemacker, J., Forth, M., Gauns, M., Glud, R. N., Kuypers, M. M. M., Lavik, G., Milucka, J., Naqvi, S. W. A., Pratihary, A., Revsbech, N. P., Thamdrup, B., Treusch, A. H., and Canfield, D. E.: N2production rates limited by nitrite availability in the Bay of Bengal oxygen minimum zone, Nat. Geosci., 10, 24–29, 2017. Brock, J. C., McClain, C. R., Luther, M. E., and Hay, W. W.: The phytoplankton bloom in the northwestern Arabian Sea during the southwest monsoon of 1979, J. Geophys. Res.-Oceans, 96, 20623–20642, 1991.
Broecker, W. S.: The Great Ocean Conveyor, Oceanography, 4, 79– 89, 1991.
Buchanan, P. J., Matear, R. J., Lenton, A., Phipps, S. J., Chase, Z., and Etheridge, D. M.: The simulated climate of the Last Glacial Maximum and insights into the global marine carbon cycle, Clim. Past, 12, 2271–2295, https://doi.org/10.5194/cp-12-2271-2016, 2016.
Bulow, S. E., Rich, J. J., Naik, H. S., Pratihary, A. K., and Ward, B. B.: Denitrification exceeds anammox as a nitrogen loss pathway in the Arabian Sea oxygen minimum zone, Deep-Sea Res. Pt. I, 57, 384–393, 2010.
Carpenter, E., Harvey, H., Fry, B., and Capone, D.: Biogeochemical tracers of the marine cyanobacterium Trichodesmium, Deep-Sea Res. Pt. I, 44, 27–38, 1997.
Cartapanis, O., Bianchi, D., Jaccard, S. L., and Galbraith, E. D.: Global pulses of organic carbon burial in deep-sea sed-iments during glacial maxima, Nat. Commun., 7, 10796, https://doi.org/10.1038/ncomms10796, 2016.
Casciotti, K. L.: Nitrogen and Oxygen Isotopic Studies of the Ma-rine Nitrogen Cycle, Ann. Rev. Mar. Sci., 8, 379–407, 2016. Clark, P. U., Dyke, A. S., Shakun, J. D., Carlson, A. E., Clark, J.,
Wohlfarth, B., Mitrovica, J. X., Hostetler, S. W., and McCabe, A. M.: The Last Glacial Maximum, Science, 325, 710–714, 2009. Cline, J. D. and Kaplan, I. R.: Isotopic fractionation of dissolved
nitrate during denitrification in the eastern tropical North Pacific, Mar. Chem., 3, 271–299, 1975.
Cline, J. D. and Richards, F. A.: Oxygen deficient conditions and ni-trate reduction in the eastern tropical North Pacific Ocean, Lim-nol. Oceanogr., 17, 885–900, 1972.
Codispoti, L. A.: An oceanic fixed nitrogen sink exceed-ing 400 Tg N a−1 vs the concept of homeostasis in the fixed-nitrogen inventory, Biogeosciences, 4, 233–253, https://doi.org/10.5194/bg-4-233-2007, 2007.
Codispoti, L. A., Brandes, J. A., Christensen, J. P., Devol, A. H., Naqvi, S. W. A., Pearl, H. W., and Yoshinari, T.: The oceanic fixed nitrogen and nitrous oxide budgets: Moving targets as we enter the anthropocene?, Sci. Mar., 65, 85–105, 2001.