Ames Laboratory ISC Technical Reports Ames Laboratory
12-1954
Assignment of transition multipole orders from L
subshell internal conversion coefficient ratios
Harry F. Frissel
Iowa State CollegeE. N. Jensen
Iowa State CollegeFollow this and additional works at:http://lib.dr.iastate.edu/ameslab_iscreports
Part of theAtomic, Molecular and Optical Physics Commons, and theNuclear Commons
This Report is brought to you for free and open access by the Ames Laboratory at Iowa State University Digital Repository. It has been accepted for inclusion in Ames Laboratory ISC Technical Reports by an authorized administrator of Iowa State University Digital Repository. For more information, please [email protected].
Recommended Citation
Frissel, Harry F. and Jensen, E. N., "Assignment of transition multipole orders from L subshell internal conversion coefficient ratios" (1954).Ames Laboratory ISC Technical Reports. 86.
Assignment of transition multipole orders from L subshell internal
conversion coefficient ratios
Abstract
Internal conversion coefficients, hereafter symbolized by ICCs, play an important role in the field .of nuclear physics. To date physicists are unable to describe adequately the structure of the nucleus. One of the tools being used to determine nuclear structure is that of internal conversion coefficients.
Keywords Ames Laboratory
Disciplines
Atomic, Molecular and Optical Physics | Nuclear | Physics
UN CLASS I FlED
...
UN CLASS I FlED
ISC-555
hysical Sciences Reading Room Subject Category: PHYSICS
UNITED STATES ATOMIC ENERGY COMMISSION
ASSIGNMENT OF TRANSITION MULTIPOLE ORDERS FROM L SUBSHELL INTERNAL CONVERSION COEFFICIENT RATIOS
By
Harry F. Frissel
E. N. Jensen
December 1954
Ames Laboratory
Iowa State College
Ames, Iowa
Work performed under Contract No. W-7405-Eng-82.
F. H. Spedding, Director, Ames Laboratory.
The Atomic Energy Commission makes no representation or warranty as to the accuracy or useful ness of the Information or statements contained In this report, or that the use of any lnfonnatlon, apparatus, method or process disclosed In this report may not Infringe prlvately-<»wned rights. The Commission assumes no llabtltty with respect to the use of, or for damages resulting from the use of, any lnfonnatlon, apparatus, method or process disclosed In this report.
This report bas been reproduced directly from the best available copy.
Reproduction of this information is encouraged by the United States Atanic Energy Commission. Arrangements for your republication of this document in whole or in part should be made with the author and the organization he represents.
Printed in USA, Price 35 cents. Available from the Office of Technical Services, Department of Commerce,
Isc-555 1
ASSirJ.NMENT OF TRANSITION I1ULTIFDLE ORDERS FIDN L
SHBSHELL INTI:RN 4.1 CONVEFSION COEFFICIENT RI\.TIOs*
by
Harry F. Frissel and E. N. Jensen
ABSTRACT
The L subshell internal conversion coefficient ratios LI/Lir/LIII were determined for the 112.0 kev transition from Lul77 and the 85.1 kev
transition from Tbl60 and were found to be<( 0.05/1.14 + 0.02/1.00 and 0.61 + O.l0/D.87 + 0.06/1.00 respectively. These data are consistent with an E2-assignment for both transitions. The data were. obtained ~vith a variable field 180° beta ray spectrometer.
INTRODUCTION
Internal conversion coefficients, hereafter symbolized by ICCs, play
an important role in the field .of nuclear physics. To date physicists are unable to describe adequately the structure of the nucleus. One of the
tools being used to determine nuclear structure is that of internal conversion coefficients.
A nucleus in an excited state may make a transition from'the excited state to a lower energy with an anpropriate release of energy. The lower state may be stable, metastable or unstable. The energy loss of t~e nucleus ·can appear either in the emitted gamma ra;r or in an ejected atomic electron.
Letting Nfi represent the probability for emission of an orbital electron and N
'f
the probability for emission of a gam"la ray, the ICC for electric multipole radiation is then defined as C(i = Nfi/N 0 where the subscript f refers to the final state of the electron and the subscript i refers to its initial state. Since the initial state of the electron may be any of the orbital shells, the total ICC is~=
ic<i•
In the case where the radiationis magnetic multipole, the symbol~ is used for ICC.
Gamma radiation emitted from the nucleus is either one of two types, electric or magnetic. These two types may be visualized in the following
*This report .is based on a doctors thesis by Harry December, 1954 at Iowa State College, Ames, Iowa. under contract with the Atomic Energy Commission.
2
Isc-555
way.l If the Poynting vector P is in the radial direction of the nucleus, neither E, the electric field, nor H, the magnetic field, have a component along the radial direction. However, if P is not along the radial direction, either E or H, or both, have a radial component. If E has a radial component,
the radiation is designated as "electric"; i f H has a radial component, the radiation is designated as "map,netic11 • The size of the radial component
of these vectors is proportional to the multip~le order. This gamna radiation is also characterized by the quantum numbers--{ ,m. Thus, a quantum of such radiation exhibits characteristics of a particle in that it too can have an angular momentum. This is further realized to be the case when conservation of angular momentum is considered.
As is t~1e in the case of particle emission, and is also true in gamna emission, the principle of conservation of parity must be applied. Parity ascribes a definite behavior to the magnetic field H of the radiation when the coordinate system is inverted. Thus if
H(-r)
=
H(+r); even parity, H(-r)=
-H(+r); odd parity.When the field H is expanded in, terms of spherical harmonics, analysis shows th»t the p<1ri ty for multipole radiati~ of the order
_,.f,m
is given by (-1)--t' for electric multipole and -(-1) for magnetic multipole radiation.Applying the laws of conservation of angular momentum and parity
enables us to determine the changes wrought in the nucleus by the transition,
i f the angular momentum and the parity of the radiation· is known. This is one step in the direction of understanding the nucleus.
Detecting and determining the transition energies does not tell us much. However, the fact that internal conversion occurs gives us some Clues about the parity and angular momentum changes. Actually the term "internal conversion" is a misnomer, for it leads one to believe that the process is solely one vlhere the gamma ray is emitted and on its way out from the nucleus ejects an orbital electron. Actually, the process is to
be thought of as partly due to absorption of the gamma ray and partly to direct interaction qetween the electron and nucleus.2
Several people have considered the problem of evaluating internal conversion coefficients. In the first attempt by Swirles3 an oscillating Hertzian doublet was assumed as the source. Relativity effects were neglected and the results dip not.agree with the high energy experim~ntal
Isc-555 3
the mul tipole order of the radiation for electric mul tipoles. The coefficients for magnetic dipole, quadrupqle and octopole radiagions were calculated by Fisk.b Dancoff and Morrison? and Hebb and Nelson, to name a few, have done similar studies applying to lower z values and other electron shells.
Empirical curves of K/L versus z 2
/c ,
wheret..
represents the transition energy for the various electric and magnetic mul tipole orders, as compiled by Goldhaber and Sunyar9 are very usefui in makingtransition assignments. All the empirical K/L conv~rsion ratio curves fall below the non-relativistic curves of Hebb and Nelson.~ An empirical curve of K/(L+M) conversion ratios for M4 transitions obtained by Graves, Langer and MoffatlO is still lower, at low z2/!. values, than the corresponding Goldhaber and Sunyar curve.With the aid of an electronic computing;,rachine, Rose et a1. 11 made a compilation of C( K and..,dK with values for A: ranging from l to 5. The subscript on the c( and ~refer to the initial shell of the convwsion electron. Corrections for screEWing in the coe~ficient C%. K for
A:=
1, 2 and in the coefficient~K for~= l were made by Reitz.l2In an unpublished report, Goertzel and Rose47 (1947) gave analytical expressions for ICCs of the L subshells. Gellman, Griffith and Stanleyl3 simplified Goertzel and Rose's unpublished formulas and made numerical calculations neglecting screening for.El, E2, and Ml transitionp involving all three subshells for Z values of 49, 84 and 92. Rose et al.46 are in the process of ma~ing numerical calculations for all the L subshells, including effects of screening. Theoretical considerations of Tralli and Lowenl4 made irt the Pauli approximation show the relationship of~Lirri~LI for orders one through five in the region of Z ~ 35 and for low gamma enerp,ies. In all cases the~trr contribution is estimated to be less than 5% of~t. The Roman numeral subscript on the L refers to the L subshell number. I
Experimental evidence that nuclear disintegrations included mono-energetic electrons was first fgund by von Baeyer, Hahn and Meitnerl5 in 1912. Rutherford and Robinson introduced the 180° spectrograph to study spectra and estimated relative intensities of L subshell conversion electron lines of some natural radioactive substances. Separation of L subshell conversion electrons was made possible by the low transition energies and high Z involved.
4
ISC-555Prior to the time of
p~blication
of the papers of Mihelich17 , 18 and Swan and Hilll9 a program of study was instituted, on which this paper is areport, of L subshell conversion ratios. At that time it was known that Rose et al. were in the process of making theoretical calculations of L subshell-rccs. From these calculations and the experimental ratios, it was hoped that spin and parity changes of the.transitions involved could be inferred.
The type of instrument necessary to ac09mplish this work is one with primarily a high resolution. Inherently, the 180° type of spectrometer fits this requirement best. An unfinished 180° spectrometer was available at the time and was the one used for this investigation.
The ability to determine accurately spectral shapes may be set pro-portional to the figure of merit of the spectrometer as defined by Persico and Geoffrion.20 They define the figure of merit as
~- ~
.JL
- 4 #(if)5/2
f?-where .f\
=
solid angle,\t
=
source area, c:1 p/p=
momentlLrn resolution at half peak height, andf
=characteristic length (orbit radius. for 180° spectrometer). The above figure of merit applies when the spectrometer is operating under optimum conditions;!·~·' S=
Q, Q=
2f 02f,
'f
0 =fffo and.fl =
2f0!f
0 , where S=
the detector slit width, Q=
the source width,¢
0 = half the acceptance angle in the plane of the orbit andif
0 = theacceptance angle in the plane perpendicular to the orbit.
According to Persico the base resolving power is given by ~p0/p
=
/_S+Q+f (
p
0 2+tf
0 217/2f.
This is the resolution that would completelyseparate two lines. Under the optimum conditions listed before, the resolution at half peak height20 is (j P
=
l
.0 Po = 1. 5¢0 2.p 7 p
Operating at approximately optimum conditions, the geometry of the
spectrometer used in this work gave
.1(
= 0.0025 steradians,1/
=
1.3 x 0.025 cm2=
0.033 cm2, Ll pfp :: 0.15%,r
=
10.5 em and ~(figure of merit)=
0.67.For rep,ular 180° spect·rometers the highest value oftfor the spectrom-eters mentioned by Persico is 0.19, whereas for the double focusing spectrom-eters,
¢
has values up to 0.69. To obtain such a high figure of merit, .the source width had to be very small. Thus far it has been assumed that such a narrow source could be made active enough for good statistics and with a mass density that would not inhibit the instrument's resolution.spectrom-rsc-555
eter, since only a uniform field is necessary. It is well·known experimentally that the field between the pole pieces of a magnet is very uniform up to
about gap width from the edge of the pole pieces.
Aside from considerations of the field, the equation for
~
indicates that the resolution is determined by the sourc~ width, detector width, path radius and the aberration terms determined by the defining slit. Decreasing the aberration terms forces the solid angle to be decreased unless a shaped field is used. 2l For a given solid angle, an increase in radius only allows a larp,er source and, consequently, a source of smaller mass density. Making S and Q smaller requires a more careful alignment of source and detector with each other and with t"le field.In
order to determine fine structure in the spectrum, small increments in the magnetic field were taken. Consequently, the magnet:ic field had to be constant to within a sm1.ll fraction of t11e increment taken. Theelectronic control described later allowed a magnetic field stability of the order of l part in 10,000.
APPARATUS At-TD rfATERIALS
Sources
The resolution obtainable with a beta spectrometer depends on both the instrument, as we have just considered it, and the source. In the foregoing paragraphs, the resolution of mono-energetic electrons was considered.
Actually, source thickness and back scattering of the source support ma.y give an energy spread to ~~at 1-;as originally a mono-energetic beam of
electrons. Albert and Wu demonstrated the.importance of source thickness on the low energy region of Kurie plots.
The energy range of interest in this investigation lay between 70 and 130 kev. Effects of back scattering and source ~~ickness decrease with the increase of electron en7rgy. Hamilton and Gross give the empirical equation
VK
=
170~ ;-(z2/A)tc7
1 2, relating the source and the backing thickness tc(gm/cm )-to the critical voltage VK (kev), below which deviations from straight line Kurie plots occur. Here Z and A are atomic number and weight respectively. Because of the high Z sources used, the source itself 1vas primarily the determininr, factor in the critical thickness tc• For the energy range and sources in question, tc ~0.06 mg/cm2.6 rsc-.5.5.5
investigation were irradiated in the Argonne CP-.5 pile with a neutron flux of 1.5 x 10¹³ neutrons/cm2/sec. This flux was about 100 times higher than that generally used heretofore.
'Ihe necessary use of a very snall solid anr,le and very narrow sources demanded sources thicker than the critical thickness even though the isotopes had very high specific activity.
~pe FM 6501 Nylon was used for source backing. The Nylon chips were dissolved in hot iso-but~l alcohol. A drop of this solution on PH 7 water p.:ave films of 10/'( g/cm • The distilled water was made neutral by means of a potassium sulphate buffer. Approximately 10~gjcm2 of aluminum was evaporated on the film. A strip of film 1 mm wide and 12 mm long was wet ted with a solution of one part sodium lauryl sulphate to 1000 parts of water. This detergent deposit served to define the area to which the radio-active material would flovl when deposited in small drops. The isotopes were in chloride solutions. When this solution had dried, the 1 mm wide strip was cut free from the rest of the film and placed on the source holder. Before cementing the edges fast, the ends were crimped together. Now, when a small drop of water or of radioactive solution was dropped on the strip, it would collapse into a narrow filament approximately 0.20 to 0.25 mm wide. This means that the mass density of the film plus the aluminum coating increased to about 0.1 mg/cm2. This is to be compared with the
mass density of the sources themselves which were of the order of 0.1 to 0.5 mg/cm2.
A somewhat different procedure was followed in the case of Pm1
4
7 whose Kurie plot was used to determine the window transmission curve of the Geiger window. This source could be made much wider(4
mm) since resolution was of little consequence in this case. The Pm2Cl3 was deposited by repeated thermal evaporation within a vacuum onto a 12~g/cm2 Formvar film. Bent into a canoe shape, a strip of 1 mil tantalum about 50 mils wide served as the heater for evaporating the salt. This heater was placed 3/8 inch below the film. The evaporation was accomplished by momentarily flashing to a yellow-white heat several times.Charging up of all sources was avoided by placing the filament from a 2.5 volt 0.30 amp bulb about 1 1/4 inches behind the film. This filament was run continuously during the spectrometer runs at a.sufficient
tempera-ture for the electron emission to prevent charging of the film. The thin aluminum coating on the Nylon films did not provide adequate grounding. It apoeared that the aluminum \vas attacked by the acidic chloride solutions. Later sources did not have the aluminum coating.
ISC-555
cases where very narrow sources of high activi~ are necessary, the method
becomes both hazardous and expensive.
Spectrometer
7
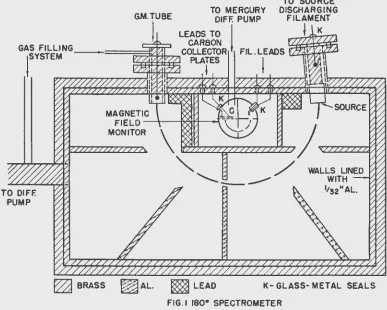
The spectrometer chamber was made of brass and lined with l/32 inch aluminum. Aluminum served to reduce F,amma photo emission, due to its low
z.
Four of the baffles served to reduce scattering while the most central baffle (Fig. 1) limited the angles
fJ
0 andtf
o. Those baffles made of brass helped to support the walls of the chamber. Five walls of the spe~trometer were soft soldered together. The sixth side, the front side ·..vall, was held to the rest of the chamber by numerous screws, with a rectangular neoprene gasket to provide the vacuum seal.
Except for the housing for the magnetic field monitor, the entire
system was pumped on by a V11F-20\'J oil diffusion pump. The field monitor housing was connected to a mercury diffusion pump. Originally the mercury
pump was installed in an attempt to stop the formation of an insulating
coat on the anode of the electron gun. This coating was thought to be due to the incomplete carbonization
4
of diffusion pump oil back streaming intothe system. Later information2 indicated that it was due to an oil residue
left in the Metal during its manufacture. Early troubles with too field monitor were attributed to this film foriOlation. Subsequently, this was shown not to be true, and no noticeable trouble due to this film has been
found to date. To prevent corona discharges from the high accelerating voltages
used in the electron gun of the field monitor, a high vacuum was necessary. This high vacuum was more easily and quickly obtained with the separate diffusion pump, and for that reason the pump was not removed.
The Geiger tube had a 3/8 inch brass collar about a third of its
length from its base. This collar clrunped to a similar brass collar on the spectrometer by means of four bolts. A neoprene gasket provided the vacuum seal. A similar arranrement was used for tm source holder. Between the source holder and the Geiger tube there was placed a total of about 6
em of lead. More shielding than this was prevented by the presence of the
field monitor.
On the top side of the spectrometer were four Kovar gla.ss-metal seals. Two acted as seals for leads from the collecting pl~tes of the magnetic
field monitor. The other h~o Kovar seals were for leads to the filament of the maP:netic field monitor, and were soldered to a removable brass plug, in order that the filament would be accessible.
Instrumentation
Power supplies
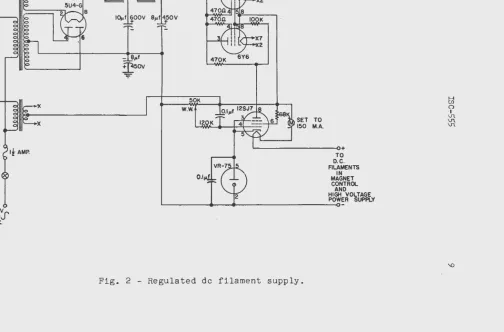
The two low voltage power supplies (Figs. 2 ~d 3) were patterned after
8
ISC-555
MAGNETIC
Fl E LD --\---I'A'?I-1+-~
MONITOR
~ BRASS ~ AL. ~ LEAD
TO SOURCE DISCHARGING
FILAMENT
~ K
K- GLASS- METAL SEALS
[image:12.554.67.454.272.582.2]115Vf"'
sov
A!;.·X
·X
470K
50K w.w.
2
SET TO 150 M.A.
~---0+ TO D.C. FILAMENTS
IN MAGNET CONTROL
AND HIGH VOLTAGE POWER SUPPLY
~---4~--~---~
Fig. 2 - Regulated de filament supply.
0i
0
I
V1. ~
[image:13.554.50.576.87.421.2]e
I805l leonl
"' l
l""
€w
y I+ yReo. ·
••s7-G
,...----,.
15K
lOW
180K
IW
J~~ 2Jme~VR 15
ISO
&o,.t
450V
lOOK IW
~· ' I O-ISOV
SK 20W
- -:soov Reo.
lOOK
Fig. 3 - Re_g!,!_lated power supply.
b
H en
( )
I
\.n
\J\
[image:14.554.23.682.90.471.2]Isc-.5.5.5 11
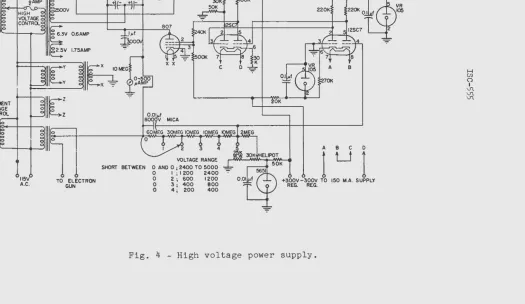
Fig. 4 shows the high voltage supply which supplied the filament current
and accelerating voltage to the electron gun of the magnetic field monitor.
This supply contained two Variacs; one controlled the filament current and
the other.controlled the voltage supplied to the primary of a high voltage
transformer whose secondary gave 2.500 volts rms when the imput was 11.5
volts. This high voltage secondary connected to a voltage doubler. The
positive high voltage was grounded for ac by th~ l~f condenser and also
connected to the plate of the 807. In order to make the 807 behave as a
high mu triode, the screen and control grids were connected together.
A string of twelve 10 meg resistors and one 2 meg resistor were connected
to the negative high volt3ge. In series with the helipot was a 25k ohm
precision resistor and the combination was in parallel with the .5651 voltage
reference tube. Partial~y shorting out the resistors,· as indicated in the
diagram, accordingly changed the voltage range of the helipot. Terminal .5
was kept at zero potential by the de amplifier arrangement. Thus the positive
volta~e of the variable connector on the helipot determined the negative high voltage of the filament center tap.
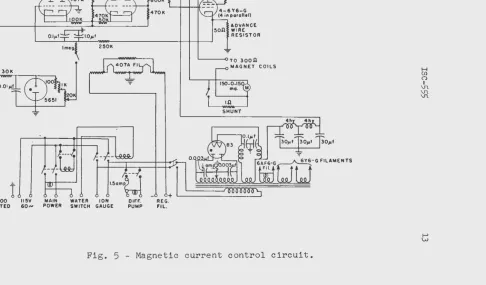
Magnet current control and magnetic field monitor
Fig • .5 v,ives the diagram of the magnet current control. This chassis
also contained a system of relays and switches which prevented application of power to the magnet, diffusion pump and ion gauge unless the water switch was closed. Current regulation was provided by the two 407A tubes and the
.56.51. A 50 ohm Advance wire external resistor in the cathode circuit of the
6y6 tubes provided the error signal.
To give a measurement of the magnet1c field and to monitor the field, a device using the principle of the 180° spectrometer itself was used. This method was particularly sui table since the spectrometer was designed
for low energy investigations. The unit was housed in the central area of
the spectrometer. It consisted of a .5 mil tungsten filament set 3/16
inch behind a 4 mil slit. A variable accelerating voltage of 200-.5000
volts existed between the filament and grounded entrance slit. For a predetermined voltage the field was varied until these electrons had a
path radius of 1.46 em.
TWo
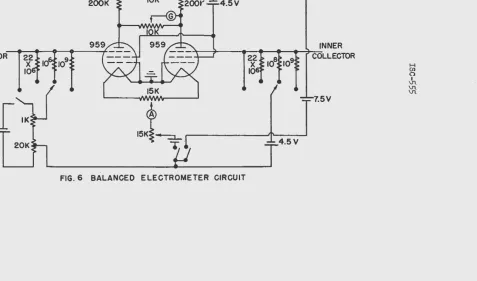
carbon plates, 4 mils apart~ feeding into abalanced electrometer, formed the detector. The balanced electrometer
(Fig. 6) is a modification of the wyn-Williams electrometer circuit. Immediately in front of the carbon collecting plates was a screen mesh
acting as a suppressor grid. The suppressor grid was at ground potential
and the carbon collectors were at plus 45 volts. ·
A sensitivity factor for the field monitor is defined by s
=
galv.de fl. in em/% chan~e in electron energy. Using a galvanometer whose
resist-FILAMENT VOLTAGE CONTROL
115
A. C.
2X2-A
TO ELECTRON
GUN
SHORT BETWEEN
2X2-A
30KS :;.lOOK
50K
MICA
VOLTAGE RANGE 0 AND 0 2400 TO 5000 0 I 1200 2400
0 2 600 1200
0 3 400 800
0 4 200 400
201(
A
1
+300V -300V TO
REG. REG.
Fig.
4 -
High voltage power supply.B C 0
u
I
150 M.A. SUPPLY
I-'
r0
H
CfJ
0
[image:16.550.25.565.111.423.2]lOOK~\ !:lOOK
250K
!
+300 -300 115V MAIN WATER ION REGULATED 60,., POWER SWITCH GAUGE
OIFF.
PUMP 470K 800K
470K
+
REG.
FIL.
ADVANCE WIRE RESISTOR
1 0ro :soon
MAGN.ET COILS
SHUNT
Fig.
5 -
Magnetic curren~ control circuit.H en
0
I
\J1 \J1 \J1
1-'
[image:17.553.67.559.131.454.2]200K 4.5V
OUTER
f~tl~
109
i
~0~~ :0~1T
t
INNERCOLLECTOR
r
~lloafJoi
COLLEClOR
'7.5V
6V.r IK
4.5V
FIG. 6 BALANCED ELECTROMETER CIRCUIT
t--' ~
H
(ll
[image:18.554.77.566.132.413.2]ISC-555
ances of 108 ohms, s varied from 10 to 100 c~ per l% change in energy over
the range of 0.20 kev to
5
kev. These accelerating voltages correspondedto soectrometer beta energies of roughly 10 to 200 kev. In terms of
per-centage chan~e of momentum, the above sensitivities would approximately be
doubled.
For purposes of measurinr, the accelerating voltage, a 30.31 meg and
lOk ohm resistor were connected across the high voltage. Voltage across
15
the lOk ohm resistor was measured vlith a Rubicon type B potentiometer and
aoplication of t~e proper multiplying factor gave the accelerating voltage.
Ooerating at such high voltages permitted a possible error due to the voltage
coefficient of the 30 meg resistor. This vol~age coefficient was obtained
according to the method of Rymer and Wright,2 resulting in t~e following
expression for the accelerating voltage: Va = 3031Vp - 3.3Vp , where VP is
the ootentiometer reading and 0'-V
<
1.5
volts. The last term representsthe
~orrection
for the voltage coeFficient. At. most, this correction amountsto l part in 700.
Detector
An end window type Geiger tube was employed in these experiments. The
tube was made from brass tubin~ 3 l/2 inches long, 7/8 inches o.d. and 9/16
inches i.d. Its active length was 2 l/4 inches. A brass disk 1 l/2 inches
in diameter, containing the Kovar glass-metal seal and 3 mil tungsten anode
Hire, was sealed to the end of the Geiger tube with a teflon washer. Three
screws held this disk in place. At the windmv end a small brass ring was
seated in to the tube and had a Nylon thread across its diameter and the
diameter of the tube. A glass hook on the end of the anode wire fastened
to the Nylon thread; thus the anode wire was kept taut and properly centered.
Earlier Geiger tubes were made with 5 mil tungsten wire and were left
unsupported on the beaded end. These tubes always had srort plateaus with
high slopes and the tubes were very unstable. In order to improve the ratio
of the tube to the wire diameter ratio in the hope that this would improve
the performance, a 3 mil tungsten anode was tried. Such a fine anode wire
necessitated the use of the Nylon string arrangement mentioned previously.
With this modification, the tube acquired a plateau of 160 volts and 7%
slope per 100 volts. The tube \-las very stable and has worked very
satis-factorily ever since.
The Geiger tube windows, 300~g/cm2 Formvar, were attached to a brass
ring with Krylon. A groove around the edge of the ring held a 5/8 inch 0
ring, which provided the vacuum seal. The window aperture was l/2 inch.
The other side of the ring allmved a cap to be seated in it. This cap had
a 0.8 mm slit cut into it and this slit rested l/16 inch in front of the
window. Two half moons could be waxed to the cap in such a manner that the
16
rsc-SSSBefore the Geiger tu~e was soft soldered to the brass flange, which allowed it to be attached to the spectrometer, alignment was set so that the source and Geiger tube entrance slit would he parallel to each other and parallel to the field. This alignment ~vas mA.de by means of a weighted
l mil wire, used as a plumb line.
· A model 163 scaler from Nuclear Instrument and Chemical Corporation
was used in conjunction with the cathode follower and Geiger tube. The
pulses from the Geir,er tube were monitored with a Raychronix model C-7 scope. The Geiger tube voltage was adjusted for constant pulse height.
RESULTS
Geiger Tube Window Transmission Coefficient
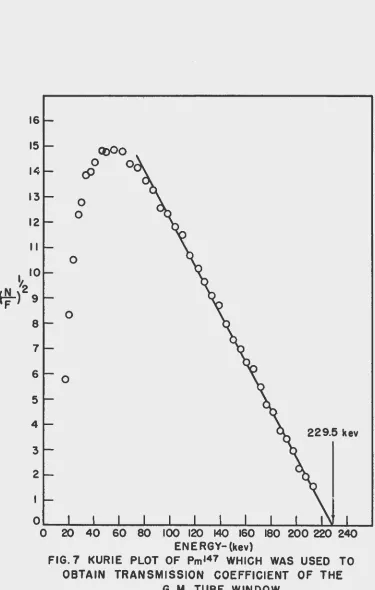
Langer, Motz and Price2l have demonstrated that Pml47 has an allowed shape for its Kurie curve. Therefore the departure of the Kurie plot at
low energies from a straight line may be used to infer the absorption of the Geiger i-Tindow down to such energies where other effects enter, such as source and backing thickness. To minimize effects of source and backing thickness, the source preparation described e'lrlier was used. This source,
on l2fig/cm2 2Formvar film, was estimated to have a surface density of less
than 6~g/cm • This compares with the l~/cm2 source on l.S~g/cm2 Zapon film used by Langer
et
al. 2lwhen a straight Kurie plot was obtained down to 8kev.
Figs. 7 and
8
show that the Kurie plot and resulting ·~smission curverespectively obtained from this Pml47 source. The transmission curve is
significantly different from that obtained by Lane and Zaffarano.27 ·
Extrapolation of the transmission curves to zero transmission gives lS kev
for the author's and 10 kev for Lane and Zaffarano1s curve. Also, window
absorption sets in at about 30 to SO per cent lm'll'er energy in the case of Lane and Zaffarano1s work.
Factors which might affect a discrepancy in the energy of zero
trans-mission would be (l) error in measurement of surface. density, (2) error in
energy calibration of the spectrometer and (3) the fact that the author's window film WA.s not coated with a conducting film, as was Lane and Zaffarano1s.
The aiscrepancy in ~he sharpness of the transmission curve and the onset of ~vindow absorption is more than likely attributable to differences
in counter geometry. Lane and Zaffarano used a slide window counter and
had a ne<J.rly unifonn counting efficiency over the entire window area. The author's spectrometer would tolerate only an end window counter which
suffered from a non-uniform counting efficiency over the area of the entrance
16
15
Q)OO
0 0
14
c9
13
0
12 0
II
0
I 10
z
~)29
0
8
7
6
0
5
4
3
2
•
•
•
•
•
ISC-555
•
•
•
•
•
•
•
•
•
•
•
•
•
•
•
229.5 kev
o~~--~~--~~~~~--~--~~--~~~
0 20 40 60 80 100 120 140 160 180 200 220 240 ENERGY- (kev)
FIG. 7 KURIE PLOT OF Pm147 WHICH WAS USED TO OBTAIN TRANSMISSION COEFFICIENT OF THE
G. M. TUBE WINDOW
[image:21.550.94.469.82.672.2]1.0
t.L LL 0.8
LLI
0
0 0.7
z
0 0.6
CJ) CJ)
-
0.5::E
~
0.+
/
0:: .
....
0.30.1
0
0 10 20 30 40 50 60 70 80 90 100
ENERGY-(kev)
FIG. 8 TRANSMISSION CURVE FOR END WINDOW GEIGER MUELLER TUBE WITH 300
,MG/CM2 FORMVAR WINDOW. THE CURVE WAS DERIVED FROM KURIE PLOT OF Pm147
~
1-'
CP
H '
(/)
0 I
\Jl. \Jl.
[image:22.549.31.591.66.437.2]ISC-555
Lul77 Isotope
The isotope Lul76 is only 2.6% abundant in the natural element. However, its huge cross section for thermal neutrons of 4000 barns is 160
times larger than the cross section of the isotope in the remaining 97.4% of the natural element. The Lu sample was irradiated for 10 days in the
~rgonne CP-5 pile. Between the time irradiation stopped and data were taken, a period of three days elapsed which was sufficient for the 3.7 hour activity of tul7b to die out. Peak counting rates of about 275 per min. were obtained witr. a source of approximate surface density of 0.1 mg/cm2.
19
Absolute caiibration of the spectrometer was obtained from the Lrrr trailing edge of the 112.0 kev transition. In the field monitoring system, the electron velocity is proportional to the square root of the accelerating voltave which in turn is proportional to (Vp)l/2, where
v
2 is the potentio-meter reading. Thus the momentum Htm' wherefm
is the raaius of the monitoring beam, is also proportional to (Vp)l;~. The field His the same for boththe mon,itoring beam and the beta particles. Therefore H)= (H{m) =
k(Vp)l/2 (gauss em).
f
mFor rtarrow sources, about 0. 25 mm wide, k waf' found to be 1429 (gaus.s cm/voltsl/2). Using a wiqe source, 4 mm, comparable to that used for Pml47, k = 1417 (gauss qm/voltsl/2). This compares with the value of k
=
1331 (gauss cm/voltsl/2) computed from the measuredflfm
ratio and the classical equations relating H and the accelerating voltage.Critical x-ray absorption energies28 were used to the Ln line trailing edge relative to the Lrrr edge. 1125 gauss em for the Lu edge agrees very well with the with the abscissa.
find the H
f
of The value ofHf
=
experimental intercept
Fig. 9 shows the total beta spectrum and Fig. 10 shows the composite L line after subtraction of the continuous beta background. The straight line properties of the Kurie curve was used to remove the beta background. ~ctually, scattering did distort the low energy portion, so the true Kurie line could not be used. Instead the actual background was represented by a straight line, as if it were a true Kurie line. One.might then question the accuracy of those points near the leading edge of the conversion line (Fig. 10). However, the method of analysis for determining the conversion ratio was not critically dependent on this. part of the conversion line, so any error involved here is not important~
Two peaks are shown (Fig. 10) that are not completely resolved,
FOR 1050
<
Hp<
1270 , SEVERALPOINTS HAVE BEEN DE LET EO
Ln
N'
•
Lm·M
•
•
0 900 1000 .
-Hp- (GAUSS-CM)
FIG. 9 PORTION OF TOTAL·· BETA SPECTRUM OF Lu 177
OBTAINED ·WITH 180° SPECTROMETER
f\.)
0
H (f)
0 I
\Jl. \Jl.
ISC-
555
21m,
~G£11 = dH ~n,
>-
t->
i=
u
<(
,.._
,.._
0 ::J 0 ..J
lL
0 ::E 0
mu
o•
w
- ( f )
(/)
z
::> ..J
0<(
(])<.!)
o-
z
-,
09,.(/) ~a::
0 lLI
1'- >
0
z
0u
0 w ..J 0
0 0
I()
0
<.!)
lL
0
~
0 0 0 0
0 0 0
o-f(l (\J
22 ISC-555
the ratio of the rccs of the corresponding subshells. Therefore these peaks had to be separated.
As seen by the d~tector, the area under the spectrum of a mono-energetic beam of electrons was considered as the product of an amplitude and a shape
factor. The shape factor depends on the source, spectrometer and energy of the electrons. Since the L sub shell lines differ so little in energy, their shape factors could be considered to be the same. Thus the ratio of the
areas under L conversion lines is equal to the ratio of amplitudes.
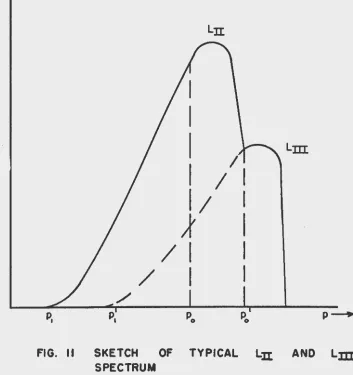
Consider the representation of Fig. 10 as sketched in Fig. ll. The portion of the trrr curve between p1 ' and p01 was mayked
qy
an Lrr pea~. Both peaks had the same base spread and therefore Pl was known. ~hPo ) was known from the data and the assumption was further made that (ap)Pl' = 0. For the dotted part of the Lrrr curve, the following equation was assumed: Nrrr (p) = N(p01 ) ~(P-Pl')/(p0'-Pl')_7n, which satisfied the boundary condition at Pl'. The only unknown in the above expression was n. For,the corresponding portion of the Lrr peak curve, a similar expressionNrr (p)
=
err ~(P-Pl)/(p0-pl)_7h was used which contained unknowns err and n. The sum of these two equations was evaluated at Po and Pl<
p < Po• The two resulting transcendental equations were solved graphically for err and n, giving en=
187 and n=
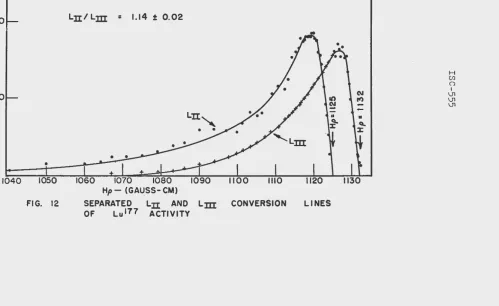
4.5.Fig. 12 shows the Lrr and Lrrr peaks separated in the manryer described above. Amplitude ratios indicate an Lrr/Lrrr intensity ratio of l.lh with a probable error of .:t 0.02. An estimated limit on Lr conversion was set at Lr/Lrrr<O.o5. Also, it Has determined that M/Lrrr
=
0.62.:: 0.02.The spread in H
J
coveredqy
the steep trailing edge of the line shapeas seen in Fig. 12 represents the change in H
f
necess:1ry to go from one edge of the source to the other. From this percentage change in Hf,
asource width of 0.25 mm was determined which ar,rees with the actual source width of 0.20 to 0.25 mm. This also indicates that the source and the detector were properly lined up.
To make an evaPQrated source for the intermediate image spectrometer, the chloride of Lul77 was used. This source had a surface density ~g/cm2 and was on a 25~g/cm2 al~inum coated collodion film. This surface density was estimated 'by· considering the total beta spectrum area, resolution and solid angle of the spectrometer. Data on total beta and beta-gamma coinci-dences were obtained with this spectrometer.
Analysis of the K conversion peak of the to tal spect:r'Uln resulted in an energy of 112.0 + 0.2 kev for the low enerv,y gamma, designated as ~l·
N(p)
·
rsc-555
I
I
I
I
I
1
I;
A'
/I
/
I
Lm
FIG. II SKETCH OF TYPICAL LII AND Lm
SPECTRUM
[image:27.544.114.467.279.654.2]200
N'
100
01040
FIG. 12
Ln/ Lm
=
1.14 :t o.o2LINES
SEPARATED Ln AND Lm CONVERSION
OF Lul77 ACTIVITY
1\)
-F
H
(f.l
( ) I
[image:28.546.47.562.104.427.2]ISC-555
For convenience the three beta groups are designated by B1, B2, and
B3
in order of increasing end point energies. The B1 beta group was isolated
b;r means of coincidences with both 208.7 and 318 kev gammas. This coincidence
spectrum is shown in Fig. 13 and its Kurie plot appears in Fig.
14.
A lineobtained by the least square method indicJ.ted a beta end point of 179 2: 2 kev •.
Fig. lS depicts the spectrum and Fig. 16 depicts the Kurie plot for the
B1 and B2 beta groups obtained from beta coincidences with all gammas and
x-rays. The presence of t:1e large, high energy heta group at these energies
introduced a high accidental counting rate which made it difficult to obtain
good statistics on the B2 beta group. An end point of 388 + 3 kev was
indicated by these data.
-From this total coincidence spectrum, the B2 beta group was subtracted;
the Bl bet~ group so obtained had an end point of 181 + 4 kev, which is in
reasonable agreement with the previous determination of 179 2: 2 kev.
The Kurie plot shown in Fig. 18 was derived from the total beta spectrum,
Fig. 17. \'lith the aid of a linear least square fit, the end point of the B3 ·
beta group was determined as 507 2: 2 kev. Fig. 19 shows the B1 and B2 beta
groups obtained from the total beta spectrum by successive subtractions.
Their end points were 178 + 9 kev and 407 + 6 kev respectively. Areas under
the spectrum curves of the-three beta groups, in order of increasing end
point energy, gave branching percentages of 9:~, 17% and 74% respectively.
The above br~nching percentages, together with the effective half
life of 5.85 x 10 sec., enabled the in.dividual beta transition comparative
half lives to be computed. Resulting log10 ft. values for the three beta
groups in order of increasing end point enerr,y, using the tabulations of
Feenberg and Trigg,30 were found to be 6.31, 6.94 and 6.80.
Removal "of the beta background gave the K, L and M conversion lines of the
112.0 kev transition.. These are shown in detail in Fig. 20, where (H
f
)Nversus H f is plotted. N represents the counting rate per unit of momentum.
When N(H f) versus H
f
is plotted, a mono-energetic conversion peak willhave a symmetrical shape. Since the L line was known to be made up of an
Lrr and Lrrr line, each of about equal intensity, a symmetrical L line was
also assumed. This property was used to separate the L and N lines. The
high energy side of the L conversion peak was made to be the mirror image of its low energy side. Subse~1ent subtraction of the mirror image from
the com~osite line resulted in the M line as shown. The Lrr and Lrrr lines
differ m momentum by H f;:::::. 7 gauss em. Using the K line shape, this momentum
difference was estimated to cause the L peak to be 4.2% less in intensity
than if the Lrr and Lrn lin~s were directly superimposed. Taking this into
consideration, relative peak heights gave K/L/M = 0.64 + 0.02/1.00/0.28 + 0.01.
spectrom-N
5---~---~--4
3
2
00
YJ=
112.0
±
0.2 kev
y
2
=
208.7
±
1.4 kev
200
400
600
~800
I000
Hp- (GAUSS -CM)
FIG
.
13
LOWEST
BETA
GROUP
OF
FROM
COINCIDENCES
WITH
GAMMAS
1200
1400
1600
Lul77
OBTAINED
208.
7
AND
318 kev
[image:30.551.37.561.80.465.2]•
•
•
•
•
•
•
•
0 0 20
FIG. 14
~
~
0
'
z
~
\
..J
\
y1=
112.0 ± 0.2 kev\
'
y2=
208.7 ± 1.4 kev\
'
X'
I
>
"
.:IC
(\1
+t
en
~
40 60 80 100
ENERGY- (kev)
KURIE PLOT OF LOWEST ENERGY BETA GROUP OF Lul77 OBTAINED FROM COINCIDENCES WITH 208.7 AND 318 kev GAMMAS
I
1
H en
(")
I
\.11.
\.11.
\.11.
[image:31.550.39.671.108.466.2]4.0
1-
f
I
I I
Y
1=
112.0! 0.2 kev
~I
Y
2
=
20 8 . 7
±
I.
4 k e v
3.0
t-'fl
,~
...J I
~
I
N 2.0-
----
~t
~
1.0
...J
I
0
I Io"
I II
I
I
I
I I i-~I
I
I
I0
400
800
1200
1600
2000
2400
2800
Hp- (GAUSS- CM)
FIG.I5 LOWEST AND MIDDLE ENERGY BETA GROUPS OF Lul77
OBTAINED FROM COINCIDENCES WITH ALL GAMMAS AND
Ka X-RAYS
1\)
co
Ei1
0
0.
~
1.2 1-
.J
·~
•
• •
:e
~..
TOTAL COINCIDENCES•
0 -+-+-+- AFTER SUBTRACTION OF1.0
r- •
•
-
z
<t SECOND BETA GROUP•
'Yj
=
112.0±
0.2 kev~~
,.
~ y2
=
208.7! 1.4 kev0.81-
..
+ • ~
Y.
t
\+ I<f>2
\
~
H0.6 • (/)
'.
,.
0I
Vl. Vl.
•
Vl....J
0.4
r-
-..._
'++•
I >~ .X
.,
-,
+I
0.2
r-
\
~--...__
CX)-
,
CX)r
+ ....-~
-\~
I
0
0 50 100. 150 200 250 300 350 400
ENERGY - (kev)
FIG.I6 KUR IE PLOT OF THE LOWER ENERGY BETA GROUPS OF Lu 177 1\)
275
250
225
200
175
N
150
125
100
75
50
25
0
0
~
~
::E
dS..J
~
I
~
.
y
1=
112.0
±
0.2 kev
y?=
208.7
±
1.4
kev
400
800
1200
1600
2000
2400
Hp- (GAUSS- CM)
FIG.
17
TOTAL BETA SPECTRUM OF Lu 177
3200
VJ
0
H
(/l (')
121-
~ ~ cf5I
101-
~ ..J~
I
)....-9
~
-·
·r
~
y
=
112.0± 0
.
2 kev
~
y
=
208.
7
:t
1.4 kev
8
~.
-
l
~
7t~:
(
~
)2
••••
6
-
-51-
~-.I
••
•
41-e
~.
>•••
w~-
.z31
"'
2
01
I I I I I I I I I I I I 3 . I I I I0
80
160
240
320
400
480
560
EN~RGY-
(kev}
FIG.I8 KURIE PLOT OF 'TOTAL BETA SPECTRUM OF Lul77
H
(J)
0 I
V1. V1. V1.
5
I •
I .
i
4
(-f)t
I~
'II
I
>--.:_+'
I \
•
I
3
I
I
•
I2
00
50
FIG. 19
I
'
I
'
1
I~
I
I I
~~I
J ~
I
~I
I _,
I
I
I I
>-S"
1
I
~
I
-I )o;;
I
t
i
l'\
I
'
t
I
'
I •I \ >
cu I
I
~\
0)\
CD +I~
150 200
ENERGY- {kev)
KURIE PLOTS OF BETA GROUPS OF
TOTAL SPECTRUM
250 300
> cu ~ CD +I ~ 0 ¢
,t
L0~
77
AND MIDDLE ENERGYLu DERIVED FROM
[image:36.547.39.544.90.479.2]30
25
(Hp)NXI0 4
15
10
5
0600
K
FIG. 20
Kl LIM
=
0.64:!: 0.02 I 1.001 0.28±QOI
900 1000
Hp- (GAUSS- CM)
K , L AND M CONVERSION Ll N ES FROM
112.0 kev TRANSITION IN Lul77 DECAY
~
0
I
\.11.
\.11. \.11.
[image:37.553.45.599.85.503.2]34 ISC-555
eter resolution, conversion ratios are found from the r3.tio of peak altitudes
in the (H
f
)N versus Hf
curve. rrv'hen the source thickness does inhibit the spectrometer resolution; conversion ratios are found from areas nnder peaksof N versus H
f.
Relative intensities of the K conversion line and B1 and B2 beta groups
gavecx:_ K
=
0.4 + 0.2. The correction was made for the 5% branching29 of the second excited state of Hfl77 into the 318 kev crossover transition. The large error covers the range of possible branching percentages for the sum of g~oups B1 and B2, 20% to 35%, as discussed later. This value forO(_ K is very sensitive to the branching percentages.Previous to the time the above data ~ taken, a source of lower total
activi~ and about 10 times lower specific activity was used to obtain the total beta spectrum. However, the coverage was not as detailed in the high energy region and regions of the ~ conversion lines as was the previous
source. All features of the abov~ aata were roughly duplicated except for the beta branching percentages. At that time the branching percentages were, in order of increasing beta end point energies, 9%, 11% and 8o%.
H01-1ever, these percentages are deemed less reliable than the 9%, 17'1> and
74% obtained with the high specific activity source because only half as
many points were availa:Jle to determine the large B3 beta group. For these same percentages Anton1eva et al.31 obtained 18%, 17% and
65%
respectively.In addition, the low specific source yieldedO( K
=
0. 041 .:_ 0. 010 for the 208.7 kev transition; this determination was based on the 9% branching for the B1 group and 5% branching of the second excited state of Hfl77 to the 318 kev crossover transition.Tb160 Isotope
A Tbl59 sample was irradiated for one month in the Argonne CP-5 pile.
This isotope is 10nf6abundant and has a cross section of 10 barns. A
somewhat thicker Tb 0 ~9urce, estimated at 0.2 to 0.5 mg/cm2, was used
than in the case of Lu1 I •
Tbl60 has some high energy gammas. The 6 em of lead shielding was not enough to shield completely the Geiger tube from these high energy
gammas. Thus a background about five times above normal had to be tolerated. This background composed approximately one half of the peak counting rate.
Consequently poorer statistics were obtained for Tbl60 than in the case of
tul77.
The L conversion line of Tb160 is some 25 kev lower than the L conver-sion line of tul77. Both lmver energy of L converconver-sion line and greater . surface density would be expected to cause greater scattering. Thi's was
seen to be true, (Fig. 21), by the fact that the leading edge of the
50
0
700
FOR 925
<
Hp<
1000, SEVERALPOINTS HAVE BEEN DELETED
Ln
Lm
800 900 ,1000
Hp-(GAUSS -CM)
•
[image:39.550.34.561.107.440.2]1100 1200
FIG. 21 PORTION OF TOTAL BETA SPECTRUM OF Tbl60 OBTAINED WITH 180°
SPECTROMETER
H (/)
0
..
\Jl \Jl \Jl36 rsc-555
To obtain the L subshell conversion lines, (Fig. 22 and Fig. 23), the
same method of analysis was used as in the case of tul77. Fig. 22 shows the
composite L and H conversion line. The extreme leading edge is not shown
for convenience of graphing. By assigning a base spread for the l1 line
equal to that of the L line and expressing its leading ed~e by a straight
line, the H line contribution Has eliminated. An equation of the form
N
=
c ;-(P-Pl)/(p0-pl) ~ was assumed for the leading edge portion of eachsubshell. By choosing-three averaged experimental points, the first at the
Lrr
peak, the second at theLr
peak and the third on the slope of the leadingedge, three transcendental equations were obtained. Solution of these
equations resulted in err= 48.5, cr
=
34.7 and n=
2.6; crrr was determinedas ~4.0 directly from the data. The Roman numeral subscripts denote the
particular subshell. Separated in this manner, the L subshell ratios were
found to be Lr/Lrr/Lrrr = 0.61 ~ O.l/0.87 ~ o.o6/l.OO. In addition it was
found that M/Lrrr
=
0.94 ~ 0.07.Having used the 112 kev LIII line of tgl?7 for calibration of the
spectrometer, the Lrii trailing edee of Tb 0 indicates.the transition
energy to be 85.1 + 0.2 kev. Using critical x-ray absorption energies,28
the H
f
values of the Lr and Lrr trailing edges were computed relative tothe Lrii trailing edge. These values, indicated in Fig. 23, were in good
agreement with the experimentally indicated H
f
values formed by the interceptswith the abscissa.
H£'181 Isotope
This isotope, resulting from irradiation of Hfl80 for one month in
.the Argonne CP-5 pile, would be exgected to have much less specific activity
in L conversion electrons than TblbO. It had been hoped to check the
results of Sv-Jan anrl Hill1 9 Hith this isotope. The small solid angle of the
spectrometer was in evidence, as counts above the background were hardly
detected. Even at this low counting rate, the source had a very high mass.
DISCUSSION
tul77 Isotope
Conversion ratios
On the basis of both their angular correlation studies and their C(_ K
determinations, McGowan e t al. 29 have de signa ted the 112.0 kev gamma as E2
and the 208.7 kev gamma
as
El, giving basis to the spin assignments madeby them.
Results of this work, Lrr/Lirr
=
'1.14 ~ 0.02 and LI/Lrri L-o.o5 for180
160
J40
l20
80
60
40
20
0 920
FIG. 22
•
•
•
•
•
•
---
•
•
960 97C
Hp- (GAUSS- CNI)
L AND M CONVERSION LINES FROM 85 kev
TRANSITION IN Tbl60 DECAY
M
•
VJ
[image:41.552.49.617.104.457.2]60 +
CALCWLATED POINTS
-+-+-+- EXPERIMENTAL- Lm
-o--o--o- EXPERIMENTAL- Ln
--6--lr--lr- EXPERIMENTAL- LI
6
6
6
6
+
+
+
~l~
\
\Ur\~
1"-... (1) + 0')
•\1\f
I
IItf
0 ~~--~~--~~--~~~~--~~--~~--~--L-~--~~-L~~--~
880 890 900 910
FIG. 23 L SUB SHELL
920 930 940
Hp-( GAUSS- CM ) CONVERSION LINES FROM
Tb160 DECAY
950 960 970 980
85.1 kev TRANSITION IN
w co
H
(f)
0
I
[image:42.551.73.606.92.443.2]ISC-555
39
from the • ..-ork of Gellman et a1. 13 of LI/111/Lnr
=
0.11.: 0.03/1.14.: 0.03/1.00for E2 radiation. Difficul~ in interpolating from the few points given by
Gellman et al.l3 gave rise to the estimated uncertainty attached to the theoreticalvalue. According to theory and experiment,l7 conversion in Ln
would be negligible forM radiation, and for El radiation 1I/1III~3; so
these can be ruled out.
Good agreement was found for the M/L ratio of the 112.0 kev transition by the hvo spectrometers. From the subshell data H/1
=
0. 29 + 0.01; this aF,rees with M/1=
0.28 + 0.01 obtained with the intermediate Lnage spectrom-'eter.As expected, the effects of source thickness were very much in evidence as shown by the long sloping leading edge of the conversion lines, (Fig. 12). However, it was the tra.iling edge of the conversion peaks that v1as important in this case. The steep trailing edge is characteristic of the 180°
spectrometer and has permitted measurements of the 1 subshell conversion
ratios to be made. Hhat happens at the far leading edge is not too important to the calculations.
Conversion ratios
K/1/M
=
0.64/l.00/0.28 for the 112.0 kev transition,obtained with the intermediate image spectrometer~ are somewhat hi~her than
the ratios 1/2/0.5 determined by Anton1eva et al. 1 The K/L ratio is also
a bit ~igher than the empirical curve of Goldhaber and Sunyar indicates forE2 radiation; their curve shows K/L ;::::::..o.4.
A search of the literature was made on those points makipg up tg;i.s region of the Goldhaber and Sunyqr E2 curve. For one thing, the Hol ~ point appears to have no hasis for being there. Its 95 kev transition has a K/L ratiol7 of 6.4 which brands it as predominantly Ml. The Ybl70 point, K/1 ?GO.l5, was determined by Fraser32 using a 0.25 mg/cm2 source and by Mihelich and Churchl~ using a 1 mg/cm2 source and photographic plates.
Photographic plates begin to have low sensitivity in the K line energy
region, ?3 kev, and sensitivity corrections could well be in error. Recent
work of Graham, Wolfson and Bell33 who did a· ,very thorough two-year study on Ybl70 revealed a K/L
=
0.38. They used thinly deposited sources of the order5
to 10~ g/cm2.Siegbahn,34 using a thin source of un§pecified density, found Hgl97 to have K/1
=
0.73; also, Sherk and Hill,3~ using a 10~ g/cm2 source, found Hgl97 to have K/L=
0.6. Both of these are above the Goldhaber and S1myar empirical curve value of K/1=
0.45.40 rsc-555
In all the exceptions noted above, thin sources were used. This was also
true in the K/L determination of Lul77 performed in the intermediate image
spectrometer.
The several exceptions to the Goldhaber and Sunyar curve, noted above,
sugg~st th~t their empirical curve may be too low in this particular region
of Z
/c.
It is to be noted that the K lines of these transitions havequite low energies, where source scattering is an impo~tant factor.
There is poor agreement between the c:(K
=
0.4 ~ 0.2 for the 112.0kev tr~nsition from this investigation and that of 0.81 ~ 0.08 of McGowan
et al. ~9 HcGowan et al. obtained their results from a comparison of x-ray
Intensities. The extrapolated value Qf the E2 theoretical K conversion
coefficients of Rose et al.ll uncorrected for screening is 0.80, according
to McGowan. However,-a size~ble error should probably·accompany this
extrapolated value. Extrapolation of the theoreticalO( K' including
screening, from the work of Reitzl2 gives G( K
=
0.60 + 0.10.Gellman et al. 13 point out that the work of Reitz on E2 transitions
may be in error.--However, recent similar work of Rose et al.4b seems to
agree with that of Reitz over the energy interval in which~hey overlap.
As was pointed out earlier, the sensitivity to branching percentages
places a large error on the value obtained in this investigation. The
upper limit, c(K
=
0.6, obtained by using the branching percentages obtainedwith the less accurate data of the low specific activity source, is in accord
with Reitz's theoretical value.
Good agreement was obtained with McGowan on the value ofc( K for the
208.7 kev transition, 0.041 + 0.010 compared with his 0.042 + 0.015. These
are in definite agreement ~ith the theoretical values for. an-El assignment
of 0.045 without·screeningll and ·0.042 with screening.l2
Beta group end points
Experience in this laborato~ has shown that beta end points obtained
from B- C)coincidence measurements are more reliable than those obtained
in the subtraction of successive beta groups. Final end point values
arrived at in this work were determined with this factor in mind.
Three determinations were made for the Bl beta gr~up end point,
179 + 2 kev, 181 + 4 kev and 178 + 9 kev. The last value resul ted after
two group subtractions from t.'le tOtal beta spectrum and is not felt to be
reliable. From the average of the first u~o values, the B1 beta end