
A song of fire and water: will climate change interacting with fire affect the distribution of vegetation in the Australian Wet Tropics?
439
0
0
Full text
(2) A song of fire and water:. will climate change interacting with fire affect the distribution of vegetation in the Australian Wet Tropics?. Jeremy Keenan Little BSc[Hons] University of Wollongong. Submitted February 2015 For the degree of Doctor of Philosophy. College of Marine and Environmental Sciences James Cook University, Cairns, Queensland, Australia.
(3) .
(4)
(5) Acknowledgements One does not accomplish great things without the physical, mental and spiritual support of others.. I wish to thank Steve Williams, Steve Turton, Will Edwards, Jeremy Vanderwal and Chris Johnson of James Cook University (JCU) and David Bowman of University of Tasmania for various supervisory roles throughout my candidature. You have each taught me many things. Special thanks to Steve Williams and to Will Edwards for taking the risk and agreeing to take me on. I wish to thank David Bowman, Lynda Prior and Grant Williamson of the University of Tasmania for an insightful, rewarding and thoroughly enjoyable collaboration. I also wish to thank James Maloney (JCU) and Beth Crase (NUS) for friendly technical advice. I acknowledge the team support from members of the Centre for Tropical Biodiversity and Climate Change (JCU), including Alex Anderson, Luke Shoo, Robert Puschendorf, Collin Storlie and Scott Parsons.. I am grateful for access to country, which was granted by the traditional custodians of the lands of the Wet Tropics, Eungella and McIlwraith Range. On ground fieldwork was gratefully permitted by the Queensland Parks and Wildlife Service (QPWS) and the Australian Wildlife Conservancy. Thanks also to those agencies for ‘trying’ not to burn my weather stations. I also wish to thank Roger Stevens (Mt Spurgeon) and Peter Mann-Jones (via QPWS; Mt Windsor) for access to historic weather data. I thank Andrew Hedges (QPWS) and Ellen Weber from Wet Tropics Management Authority, for advice and encouragement. I thank Graham Harrington, Matt Bradford and David Hilbert from CSIRO for early discussions, advice and for making available their data. I make a special acknowledgement and thanks to Rupert Russell, whose insight, understanding, passion and knowledge of the tall eucalypt forests of the Wet Tropics has been an inspiration. I had much assistance conducting field work and I wish to thank the following volunteers: Alex Anderson, Sophia Carroll, Rhiannon Dalrymple, Kalu Davies, Christine Eriksen, Samantha Forbes, Emma Ignjic, Pat Macquarie, Andrew Picone, Daniel & Jade Stonggrove, Sian Thomas and especially Maree Grenfell. Special thanks to Alex Anderson for opportunities to expand my work into other bioregions (not included here) and for great adventures on Cape York Peninsula.. Heartfelt thanks to my friends for providing a roof over my head when I needed it, especially Alex Anderson, Scott Parsons and Sam Fox. I am indebted to my family and friends who provided me with personal support. My love, gratitude and thanks go to Carolyn Little, Alan and Lois Little and to Maree Grenfell. Love, thanks and memory also. i.
(6) go to the late Magnus and Gwenyth Frendin. My love and appreciation goes to Evie and Rosa Little for being such beautiful sparks of joy. I wish to thank all my friends (you know who you are) and family for the emotional support you have shared throughout my long and arduous candidature. I could not have done it without you. Special thanks go to Maree Grenfell, Nathan Knott, Megan Lewis, Michelle Yates, Andrew Picone, Anita Cali and Jann Crase for love, emotional support, care and encouragement. Much love and deep gratitude goes to Maree Grenfell for enduring some tough, wonderful and unforgettable years, for unwavering support and for carrying me out of the jungle on one leg (I’ll save that story for another time), in more ways than one.. As egotistical as this sounds, I also have to thank myself. The road less travelled was a difficult one. I acknowledge the dedication, persistence (stubbornness), grim determination, independence, passion and belief in myself that it could be done, despite the odds.. Thank you to all those of you that believed in me too. It is accomplished!. This thesis is dedicated to sacred ecology, mother earth and the divine feminine in each of us. May we treat her more gently. I dedicate this thesis to the sacred places of the Wet Tropics that gave me insight and wisdom: Chooreechillum, Wooroonooran, Kahlpahlim, Manjal Dimbi, Wurrmbu, Wundu and Nulbullulal. These names, their landscape and their spirit should be etched into the psyche of all Australians. They will endure within me forever.. Jeremy Little Cairns, October 2015. ii. .
(7) Statement of the Contribution of Others Stipend: •. James Cook University (JCU). •. College of Marine and Environmental Sciences (JCU). •. Centre for Tropical Biodiversity and Climate Change (JCU) (CTBCC). •. Graduate Research School (JCU. •. Wet Tropics Management Authority (WTMA). Supervision: •. Prof. Stephen Williams. •. Prof. Steve Turton. •. Dr. Will Edwards (part). •. Prof. David Bowman (part). •. Dr. Jeremy Vanderwal (part). •. Prof. Chris Johnson (part). Funding of Research and Equipment (Chapters 3 and 4): •. Marine and Tropical Sciences Research Facility (MTSRF) via CTBCC. •. Queensland Government Department of Premiers and Cabinet. •. Wet Tropics Management Authority (WTMA). •. Skyrail Rainforest Foundation. Collaboration with University of Tasmania (UTAS) (Chapter 4): •. Prof. David Bowman, Dr. Lynda Prior, Dr. Grant Williamson (Chapters 4,5). •. Funding- National Climate Change Adaptation Facility (NCCARF). •. Funding- School of Plant Science (UTAS). Statistical support: •. Lynda Prior (Chapters 4). •. Susan Jacups (Chapters 2,3). •. Rhondda Jones (Chapters 2,5). •. Jeremy Vanderwal (Chapter 2). •. Beth Crase (Chapter 2). Data Analysis: •. Lynda Prior (Chapter 4). iii.
(8) •. Grant Williamson (Chapters 4,5). Access to Data: •. Bureau of Meteorology. •. Geosciences Australia. •. Queensland Government. •. Wet Tropics Management Authority. •. CTBCC. •. Graham Harrington and Matt Bradford, CSIRO (Atherton). Editorial assistance:. iv. •. Thesis: Steve Williams, Steve Turton.. •. Chapter 4: Lynda Prior, David Bowman. .
(9) ABSTRACT. Vegetation, fire and climate are intrinsically interrelated phenomena. Changes in one of these elements will affect the others. Climate change poses an immediate threat to ecosystems, affecting both fire regimes and vegetation around the world. Climate change interacting with other stressors pose the greatest threat to species and ecosystems. Hence, fire as an environmental stressor can exacerbate climate change impacts. The synergistic effects of direct climate change impacts and climate-induced shifts in fire regimes have substantial implications for vegetation and the distribution of vegetation types. For example, fire sensitive vegetation globally already only occupies half its potential distribution due to fire. Changes in fire regime have the potential to increase this pressure and induce firedriven tipping points where vegetation shifts into an alternative stable state. The Australian Wet Tropics, a world heritage region of international significance, hosts a range of vegetation types, narrow ecotones, fire regimes and climatic variability in close proximity along steep elevation gradients. Broad vegetation types in the region are rain forest, tall eucalypt forest and savanna, which occur along this environmental gradient. Rain forest vegetation dominates the high rainfall coastal ranges and savanna woodlands dominate the drier inland areas, with a narrow band of tall eucalypt forest in between. Fire is a regular occurrence in Australian savanna and accounts for 80% of the fire activity in Australia. Rain forests on the other hand, are unlikely to burn on a regular basis and are characterised by fire sensitive species. Tall eucalypt forests are also sensitive to frequent fire, but infrequent fire can aid the recruitment of its shade-intolerant canopy eucalypt species. Thus, these vegetation types represent a spectrum of fire regimes and fire tolerance along an environmental gradient. The aim of this thesis was to address the question 'will climate change interacting with fire affect the distribution of vegetation types'? Fine-resolution vegetation distribution models were developed using topographic, edaphic and climatic variables for current conditions. Complex interactions between vegetation, modelled macroclimate, topography and edaphic factors were detected. These required further exploration to account for the influence of climate relative to other factors, such as fire, competition and vegetation feedbacks. The relative influence of climate and topography on the distributional patterns of vegetation was determined (Chapters 2 and 3) and the potential presence of alternative vegetation states was quantified (Chapter 2). Vegetation feedbacks on microclimate and fire danger were detected (Chapter 3 and 4). Accounting for these complexities in vegetation models is currently a major barrier to making effective predictions of future distributions.. v.
(10) The potential influences of model inaccuracies, alternative vegetation states, spatially interpolated climate models, and inability to account for fire indicated modelling would be unlikely to result in accurate outputs. These complexities were explored to ascertain how they affect current distributions and how climate change might impact them, rather than relying on simple model predictions of distribution under future climates. A spatial analysis of in situ below-canopy micrometeorological and fire danger conditions was assessed from a regional network of monitoring sites within different vegetation types. These were compared with standard meteorological stations and used in an assessment of historic climate and fire danger trends within the region. How spatial climate models related to in situ topoclimate conditions was tested. A review of historic trends and potential future trajectories was made and how data may better explain future projections of future climate, fire and vegetation distribution, but no hard evidence could be presented. Three vegetation types (rain forest, tall eucalypt forest and savanna) were modelled at a fine-resolution with a geospatial residuals autocovariate technique to assess model capacity to accurately predict current vegetation distribution (Chapter 2). Models generally performed well, but were not near perfect despite use of high-resolution data, robust spatial techniques, full data set and known distributions. This result suggested that there were other important variables influencing vegetation distribution. Comparisons of observed and potential vegetation distributions provided insight into landscape patterns and suggested competition and feedbacks between vegetation types within overlapping environmental niches. Alternative stables states of vegetation and stochastic disturbances by fire are mechanisms also likely to be contributing to vegetation distribution and thus affecting model performance. The relative performance of models between vegetation types and occupancy of potential distributions by other vegetation types indicated that savanna was the most stable vegetation type and tall eucalypt forests the least. Tall eucalypt forests, a threatened ecological community, occupied a narrow environmental space between rain forest and savanna. They are exposed to both long-term shade intolerance from rain forest and short-term frequent fire intolerance from encroaching savanna fires. Other vegetation types occupied large areas of the modelled core environmental niche for tall eucalypt forest, which instead occupied sub-optimal environmental conditions with very low probability of occurrence. This suggested that tall eucalypt forests are closer to the edge of their environmental niche than the other communities and are likely to be less resilient to additional threats, such as from climate change or increased fire risk. Combined these threats suggest that tall eucalypt forests could be at risk of ecosystem collapse. Predictions of species or vegetation distribution under current or future climate scenarios are generally based upon spatial interpolated climate data. However, spatial climate data are based on relatively simple interpolation algorithms, which do not accurately capture the idiosyncrasies of montane meteorology. Spatially interpolated climate has seldom been assessed. vi. .
(11) against actual in situ conditions, particularly in complex terrain. The reliability of spatially interpolated climate data in reflecting in situ topoclimate conditions relative to vegetation types was tested. A network of 32 micrometeorological sites along eight transects encompassing rain forest, tall eucalypt forest and savanna was established throughout the Wet Tropics region. Three years of microclimate measurements were made at each site and were compared with parallel data from a nearby official meteorological station (Mareeba). They were also compared with spatially interpolated climate data extracted for each site (Chapter 3). Microclimate showed significant differences between vegetation types along the environmental gradient and with Mareeba. Temperature, for example, decreased along the environmental gradient from savanna at lower elevations, to rain forest at higher elevations. However vegetation was a better predictor of microclimate than topography (up to 99% of overall model performance), suggesting the potential effect of vegetation feedbacks on microclimate conditions. This was consistent with case studies of alternative stable state theory for the region. Interpolated climate variables did not relate well and were generally poor predictors of in situ microclimate. Again, vegetation was a better predictor of micrometeorological conditions than spatially interpolated climate, contributing up to 90% of overall model performance. Biota respond to topoclimate conditions, suggesting that spatially interpolated climate data alone is unlikely to reliably predict vegetation distributions under any climate scenarios. Incorporating vegetation type, topographic, edaphic and meteorological data in distribution or bioclimatic modelling will result in more meaningful and realistic models. Climate and fire interact and can strongly affect vegetation distribution, particularly fire sensitive vegetation. Fire danger is a metric that assesses fire risk as a function of climate. The McArthur’s Forest Fire Danger Index (FFDI) was calculated from microclimate data for each of 32 sites within the three vegetation types (Chapter 4). These were compared with parallel FFDI calculated for a key official meteorological station at Mareeba. There was a strong association of the Mareeba FFDI values with those from the three vegetation types, albeit they were substantially lower. FFDI values were significantly different between each vegetation type. Values decreased from more open vegetation (savanna), through to closed vegetation (rain forest), a pattern that was consistent across each transect. Only very rarely would rain forest be flammable, despite being adjacent to highly flammable savannas. These results demonstrated a stronger effect of vegetation type on fire danger (as well as microclimate), compared to topography, consistent with a fire – vegetation feedback, which is associated with alternative stable state theory. However, fire restricts rain forest to half their potential distribution around the globe, suggesting that fire is a stronger influence on vegetation distribution than any microclimatic feedbacks that might suppress fire and prevent it from encroaching into firesensitive vegetation.. vii.
(12) Distribution models were concluded to be too inaccurate to predict how climate change might influence vegetation distribution at a scale relevant to existing distributions of vegetation and biota because: spatially interpolated climate data does not capture extreme events or accurate represent topoclimate conditions; inability to account for vegetation feedbacks and alternative stable states, and vegetation distribution models using current climate were not perfect. All of these issues complicate the climate - vegetation relationship, making a simple modelling strategy questionable without factoring in these complexities and how climate change might impact them. Other methods were used to assess implications of climate change and fire on vegetation distribution. This was done by assessing recent meteorological trends and determining likely trajectories of change in climate and fire danger at a fine-scale within the region. Variability, extremes and trends in climate and fire danger were identified for two key sites and compared with projected future climate trajectories. Observed daily meteorological data at Cairns (1890-2010) and Mareeba (19572010) were analysed for trends in climate and fire danger, including variability and extremes (Chapter 5). Known relationships between Mareeba climate and fire danger, with those for the three vegetation types (Chapter 3 and 4) were used to extrapolate historic climate and fire danger conditions for those vegetation types. Cairns and Mareeba displayed consistent trends for some variables, but opposing trends for others. There were significant increases in all fire danger trends, including average and extreme FFDI at Cairns between 1890 and 2010, however, few fire danger trends were significant at Cairns between 1957 and 2010. Mareeba had no significant trends(1957-2010), but some noteworthy trends were nearsignificance. These near-significance trends indicated a possible increase in extreme fire danger, but also a possible decrease in average fire danger conditions. Climatic variables underlying FFDI calculation contributed in varying ways to these results. Temperatures increased at both sites, however, rainfall showed no trend at Cairns, but an increasing trend at Mareeba. Climatic trends for each of the vegetation types were expectedly consistent with trends at Mareeba, but with different values. Historic climate and fire danger trends were broadly consistent with future climate projections. Intra-regional trend variation may help explain some of the uncertainty and weak climate projections made by coarse projections for the Wet Tropics region. With sitespecific intra-regional trend information regional variability can be assessed. Observed climate patterns and trends were not consistent throughout the region and by ‘averaging’ these conditions across the region, as is done with global climate models, the detail, accuracy and certainty of trends is weakened by masking variability. Historic trends provide evidence of some consistent and some divergent climate change trajectories within the region. If increasing extreme FFDI is real and is matched with increased fire occurrence,. viii. .
(13) then this may pose a threat to fire sensitive tall eucalypt forests and rain forests, with implications for fire management practices in these ecosystems. The potential presence of alternative stable vegetation states and vegetation feedbacks on microclimate and fire danger were quantified for rain forest, tall eucalypt forest and savanna (Chapter 2). The presence of vegetation types existing in disequilibrium with climate and in alternative states suggests that climate change alone is unlikely to drive vegetation change or shift in stable states. However, a potential increase in extreme fire danger conditions could disrupt existing alternative stable states in vegetation to drive vegetation change. This would impact fire sensitive tall eucalypt forests and rain forests. This threat is exacerbated by a legacy of European disturbance and increased vulnerability of forest types. The interaction of multiple stressors, including climate change and fire has the capacity to destabilise vulnerable vegetation, promoting shifts into alternative stable states. Tall eucalypt forests, an already threatened vegetation type, are the most at risk of ecosystem collapse in this region. Will climate change interacting with fire affect the distribution of vegetation types? Evidence including the relative vulnerability of vegetation types and potential changes in fire danger, suggest that vegetation distributions could change. The tendency is for an expansion of savanna, at the expense of a contraction of tall eucalypt forest and rain forest edges, presumably mediated by fire. But an increase in fire danger alone is not enough. Ignitions are required for changes in fire potential to be realised. Ignition sources, including their frequency, timing and location may be a key stressor to exacerbating climate and fire risk to vegetation. Appropriate fire and ignition management could be used to mitigate this risk. How we manage ignitions and fire in the landscape in consideration of ecosystem risks could affect future vegetation distributions. Appropriate fire regimes in the present may be of greater concern to the resilience, distribution and persistence of vulnerable vegetation in the future, than directly from climate change. Fire frequency is perhaps more strongly linked to ignitions than to climate directly. The overwhelming majority of ignition sources causing fire frequency are anthropogenic. Arson and perverse fire management actions have the potential to exacerbate potential climate change impacts, to tip the balance and drive change in the distribution of vegetation types, including shifts into alternative vegetation states. The main issue may not be about how climate change and a change in fire danger could affect vegetation, but how fire is managed into the future. Fire managers and agencies must adapt to increased fire danger conditions if they are to prevent potential vegetation change and distributional shifts. Consistent with other national and regional reports, it is suggested that reducing landscape pressures, such as fire, are the best option for mitigating climate change impacts on ecosystems. The message is, never mind the warming, watch out for the fire!. ix.
(14) Table of Contents. Acknowledgements ........................................................................................................................ i Statement of the Contribution of Others ...................................................................................... iii ABSTRACT .................................................................................................................................. v Table of Contents .......................................................................................................................... x List of Tables .............................................................................................................................. xiv List of Figures........................................................................................................................... xviii List of Plates .............................................................................................................................. xxii List of Appendices .................................................................................................................... xxiii Prelude ...................................................................................................................................... xxxi. CHAPTER 1 General introduction: climate change, fire vegetation distribution and the Australian Wet Tropics ........................................................................................................................................... 1. 1.1. Introduction: vegetation, fire, climate and change ............................................................... 1. 1.2. Vegetation, fire, climate and change in the Australian Wet Tropics ................................... 6. 1.3. Study Area ............................................................................................................................ 9. 1.4. Vegetation of the Wet Tropics ........................................................................................... 13. 1.4.1. Vegetation classification ............................................................................................ 13. 1.4.2. A spectrum of fire tolerance ...................................................................................... 14. 1.4.3. A history of vegetation change .................................................................................. 15. 1.5. Climate change in the Wet Tropics .................................................................................... 17. 1.6. Aims ................................................................................................................................... 18. CHAPTER 2 Vegetation distribution and disequilibrium along an environmental gradient in the Wet Tropics of northeastern Australia ............................................................................................................. 21. 2.1. Abstract .............................................................................................................................. 21. 2.2. Introduction ........................................................................................................................ 23. 2.2.1. Aims ........................................................................................................................... 24. 2.2.2. Wet Tropics vegetation models ................................................................................. 24. 2.2.3. Methodological approach .......................................................................................... 25. 2.2.4. Ecological theory ....................................................................................................... 25. 2.3. x. Methods .............................................................................................................................. 26. .
(15) 2.3.1. Study area ................................................................................................................... 26. 2.3.2. Remotely sensed spatial data analysis ........................................................................ 27. 2.3.3. Model analysis ............................................................................................................ 29. 2.3.4. Spatial generalised linear models ............................................................................... 32. 2.3.5. Models of vegetation distribution .............................................................................. 33. 2.4. Results................................................................................................................................. 34. 2.4.1. Remotely sensed spatial data analysis ........................................................................ 34. 2.4.2. Spatial generalised linear models ............................................................................... 34. 2.4.3. Models of vegetation distribution .............................................................................. 41. 2.4.4. Tall eucalypt forests ................................................................................................... 46. 2.5. Discussion ........................................................................................................................... 46. 2.5.1. Spatially interpolated data .......................................................................................... 46. 2.5.2. Vegetation feedbacks, competition and fire ............................................................... 49. 2.5.3. Implications ................................................................................................................ 51. 2.5.4. Wet Tropics vegetation models .................................................................................. 52. 2.5.5. Conclusions ................................................................................................................ 53. CHAPTER 3 The microclimate of vegetation types along an environmental gradient: implications for bioclimatic models ....................................................................................................................... 59. 3.1. Abstract ............................................................................................................................... 59. 3.2. Introduction......................................................................................................................... 61. 3.3. Methods .............................................................................................................................. 64. 3.3.1. Study design ............................................................................................................... 64. 3.3.2. Micrometeorological measurements within vegetation types .................................... 68. 3.3.3. Official meteorological station measurements ........................................................... 69. 3.3.4. Spatially interpolated climate data ............................................................................. 70. 3.3.5. Statistical modelling ................................................................................................... 70. 3.4. Results................................................................................................................................. 72. 3.5. Discussion ........................................................................................................................... 83. 3.5.1. Conclusions ................................................................................................................ 85. CHAPTER 4 Fire weather risk differs across rain forest - savanna boundaries in the Wet Tropics of northeastern Australia .................................................................................................................. 89 4.1. Abstract ............................................................................................................................... 89. xi.
(16) 4.2. Introduction ........................................................................................................................ 90. 4.3. Methods .............................................................................................................................. 91. 4.3.1. Study design............................................................................................................... 91. 4.3.2. Microclimatic measurements ..................................................................................... 92. 4.3.2.1. Temperature and humidity ................................................................................. 92. 4.3.2.2. Soil moisture ...................................................................................................... 93. 4.3.2.3. Rainfall ............................................................................................................... 93. 4.3.2.4. Wind ................................................................................................................... 93. 4.3.3. Forest Fire Danger Index (FFDI) ............................................................................... 93. 4.3.4. Statistical modelling .................................................................................................. 94. 4.4. Results ................................................................................................................................ 95. 4.5. Discussion ........................................................................................................................ 102. 4.5.1. Conclusions.............................................................................................................. 104. CHAPTER 5 Historic trends in climate and fire danger: evidence of climate change trajectories and implications for vegetation ........................................................................................................ 107. 5.1. Abstract ............................................................................................................................ 107. 5.2. Introduction ...................................................................................................................... 109. 5.2.1 5.3. Methods ............................................................................................................................ 113. 5.3.1. Study area ................................................................................................................ 113. 5.3.2. Historic climate and data homogenisation ............................................................... 115. 5.3.2.1. Data stitching ................................................................................................... 115. 5.3.2.2. Data calibration ................................................................................................ 116. 5.3.2.3. Data homogenisation........................................................................................ 116. 5.3.3. Forest Fire Danger Index (FFDI) ............................................................................. 116. 5.3.4. Microclimate measurements .................................................................................... 117. 5.3.5. Historic climate for vegetation types ....................................................................... 118. 5.3.6. Trend Analysis ......................................................................................................... 118. 5.4. Results .............................................................................................................................. 119. 5.4.1. Forest Fire Danger Index ......................................................................................... 120. 5.4.2. Climate ..................................................................................................................... 126. 5.5. xii. Objectives ................................................................................................................ 113. Discussion ........................................................................................................................ 130. 5.5.1. Forest Fire Danger Index ......................................................................................... 130. 5.5.2. Climate ..................................................................................................................... 132. .
(17) 5.5.3. Historic trends and climate change projections ........................................................ 133. 5.5.4. Methodology implications ........................................................................................ 138. 5.5.5. Conclusions .............................................................................................................. 139. CHAPTER 6 General Discussion .................................................................................................................... 143. 6.1. Introduction....................................................................................................................... 143. 6.2. Synthesis of key findings .................................................................................................. 145. 6.3. Aims and objectives .......................................................................................................... 148. 6.3.1. Determine the relative contribution of topographic, climatic and edaphic factors in explaining current vegetation distributions (Chapter 2) .......................................... 149. 6.3.2. Assess the fine-scale variation in climate driven by topography and vegetation along an environmental gradient (Chapter 3) .................................................................... 150. 6.3.3. Determine the relative performance of spatially interpolated macroclimate, vegetation and topography in explaining in situ topoclimate (Chapter 3) ............... 150. 6.3.4. Assess the fine-scale variation in fire danger driven by topography and vegetation along an environmental gradient (Chapter 4) .......................................................... 151. 6.3.5. Identify historic climate and fire danger trends and extremes within the Wet Tropics region (Chapter 5) .................................................................................................... 152. 6.3.6. Determine whether observed climate and fire danger trends are consistent with projected future climate trajectories (Chapter 5) ..................................................... 153. 6.3.7. Identify historic and likely future changes in climate and fire danger relative to vegetation types (Chapter 5) .................................................................................... 154. 6.3.8. Evaluate likely impacts of climate change interacting with fire and other potential stressors on vegetation types (Chapter 6) ................................................................ 154. 6.3.9. Will climate change interacting with fire affect the distribution of vegetation types? .. ................................................................................................................................ 154. 6.4. Conservation and management implications .................................................................... 155. 6.5. Future research, integration and implementation ............................................................. 159. 6.6. Research refinements and improvements ......................................................................... 162. 6.7. Conclusions....................................................................................................................... 165. References .................................................................................................................................. 169 Appendices ................................................................................................................................. 215. . xiii.
(18) List of Tables. Table 2.1. Climatic (BIOCLIM) variable codes and descriptions for 11 temperature variables and eight precipitation variables. ............................................................................ 28. Table 2.2. Description of models with combinations of climatic and geographic variables used for predicting the distribution of vegetation types in the Australian Wet Tropics. Variables whose names commence with ‘bc’ are bioclimatic variables, which are described in Table 2.1. K is the number of parameters in each model, including catgories. ............................................................................................................... 32. Table 2.3. Average values for a range of geographic and climatic variables for three broad vegetation types (rain forest, tall eucalypt forest and savanna woodland) the Australian Wet Tropics region. ............................................................................... 34. Table 2.4. Relative performance of multi-variable models (Table 2.2) for predicting distribution of three vegetation types (a. rain forest, b. tall eucalypt forest and c. savanna). Models were non-linear logistic regressions and included a residuals autocovariate based on spatial autocorrelation analysis. Model selection is based on AICc values, Akaike weights (wi) and percentage explained deviance (D2). True Skill Statistic (TSS) also indicate model performance and delta indicates predictive performance from a 10-fold cross validation. Columns are ranked by AICc values.. .......................................................................................................................... 36. Table 2.5. Details of a preferred model (M10) explaining the distribution of three vegetation types (a. rain forest, b. tall eucalypt forest and c. savanna) in the Australian Wet Tropics. These results are for a non-linear spatial logistic regression model with six explanatory variables (Table 2.2) and a residuals autocovariate (RAC) (K = 29). Model details list AICc values, percentage explained deviance (D2) and True Skill Statistic (TSS), which indicate overall model performance, while the adjusted delta is the prediction error from a 10-fold cross validation and indicates the average number of misclassifications. ................................................................................. 38. Table 2.6. Predicted (potential) distribution of three vegetation types compared with actual (observed) vegetation type present at that point. Count (number of points) and proportions (percentage) of potential and observed vegetation type are given for rain forest (RF), tall eucalypt forest (TEF) and savanna (SAV). Data are provided for high probability of occurring (p ≥0.9), moderate probability (p ≥0.7), low probability (p ≥0.5) and very low probability (p ≥0.1). .......................................... 43. Table 2.7. Comparison of the area (hectares and percentage) of observed and modelled vegetation for 568,800 points (3,555,000 ha), excluding other vegetation types. Modelled area shows the vegetation type with the highest probability of occurrence. xiv. .
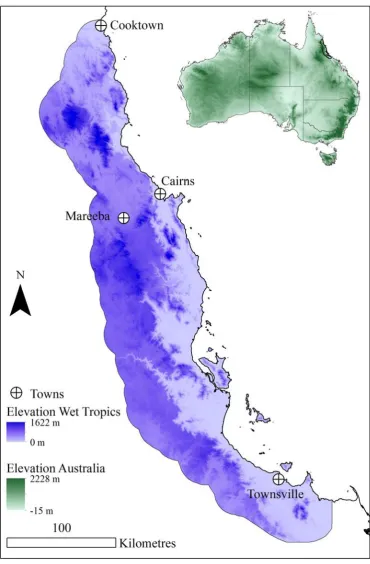
(19) at each point. Proportion of modelled areas occupied by other vegetation types is shown. ...................................................................................................................... 44. Table 3.1. Details of transects shown in Figure 3.1, incorporating rain forest, tall eucalypt forest and savanna vegetation. Details of sites for each transect are given in Table 3.2. .......................................................................................................................... 64. Table 3.2. Details of field sites along 8 transects with one site in rain forest (RF), two sites in tall eucalypt forest (TEF) and one site in savanna (SAV) for each transect. .............. .......................................................................................................................... 66. Table 3.3. Differences in microclimate by vegetation type and landscape position. Model performance (explained deviance) for generalised linear models comparing microclimate variables among vegetation types and landscape position (transect). Three vegetation types, rain forest (RF), tall eucalypt forest (TEF) and savanna (SAV) were compared in a pairwise analysis in the combinations shown below. The response variable was micrometeorological variable of vegetation type 1 and the explanatory variables in the global model were micrometeorological patterns of vegetation type 2, transect, and their interaction. See Appendix 3.6 for full details of these results. ........................................................................................................ 76. Table 3.4. Summary results of individual linear mixed effects models, each testing the capacity for daily Mareeba meteorological data and vegetation type to predict daily observed microclimate at 32 field study sites with ‘Transect’ as a random effect (climate_variable ~ Mareeba * VegType). The explained deviance is reported. See Appendix 3.8 for details of these results. ................................................................ 77. Table 3.5. Summary of individual linear mixed effects models testing the relationship among vegetation type, transect and elevation with daily observed micrometeorological data at 32 field study sites (recorded daily over a three-year period). Vegetation types were rain forest (RF), tall eucalypt forest (TEF) and savanna (SAV). See Appendices 3.6-3.9 for full model details. .............................................................. 81. Table 3.6. Assessing the ability of interpolated climate data in predicting on ground microclimate conditions. Summary of linear mixed-effects models examining the relationship between monthly micrometeorological variables (as recorded over a three year period) and monthly interpolated climate (ESOCLIM) for each of 32 study sites within three vegetation types (rain forest, tall eucalypt forest, savanna). The response variable was one of nine micrometeorological variables and the explanatory variables were modelled climate of the corresponding month, vegetation type, and their interaction. Models were repeated using different random effects, with ‘month’, ‘transect’ and ‘elevation’ used alternately in separate models.. xv.
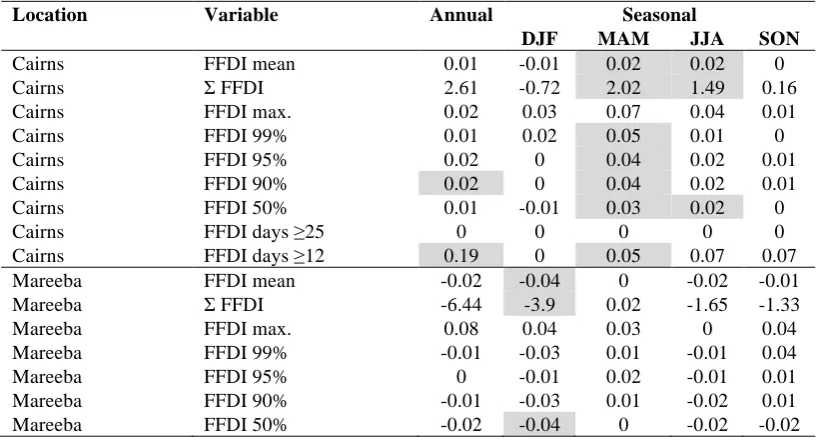
(20) The percent explained deviance (relative to the null model) for the full model is reported. For full model details, see Appendix 3.14. For model selection from candidate models, see Appendix 3.15. .................................................................... 82. Table 4.1. Linear mixed effects models comparing Forest Fire Danger Index (FFDI) of the three vegetation types with those of the meteorological station at Mareeba (first model set). The response variable was FFDI for the vegetation type, and the explanatory variables were FFDI at Mareeba on the corresponding day, vegetation type, and their interaction (i.e. the multiplicative effects of the two predictive variables). ‘Transect’ was a random effect in all models. wi is the Akaike weight, and ‘D2’ is % explained deviance relative to the null model. This model set shows that all of fire risk at Mareeba, vegetation type, and their interaction were useful predictors of fire risk............................................................................................. 100. Table 4.2. Linear models comparing Forest Fire Danger Index (FFDI) among vegetation types and landscape positions (transect). The three vegetation types, rain forest (RF), tall eucalypt forest (TEF) and savanna (SAV) were compared in a pairwise fashion in the three models shown below. The response variable was FFDI of vegetation type 1, and the explanatory variables in the global model were FFDI of vegetation type 2, transect, and their interaction (i.e. the multiplicative effects of the two predictive variables). The candidate model sets shown compared all combinations of these explanatory variables. Akaike weights (wi) indicate the preferred model and overall model performance is indicated by percent of the deviance explained (D2). ....... 101. Table 4.3. Comparison of linear mixed-effects models investigating the relationship between vegetation type (savanna, tall eucalypt forest and rain forest) with elevation. The response variable was Forest Fire Danger Index (FFDI) and the explanatory variables were vegetation type (VegType), elevation, their interaction and with ‘day’ as a random factor. The model with most support (global model) has the highest Akaike weight (wi) and highest percent explained deviance (D2). .......... 102. Table 5.1. Linear trends in FFDI values for Cairns, from 1890 to 2010. Values represent the linear annual or seasonal change per year (slope coefficient). Shading indicates trends that were significant at the 95% level. Model details are provided in Appendix 5.3 for annual outputs and Appendices 5.5-5.8 for seasonal outputs... 121. Table 5.2. Linear trends in FFDI values for Cairns and Mareeba, from 1957 to 2010. Values represent the linear annual or seasonal change per year (slope coefficient). Shading indicates trends that were significant at the 95% level. Model details are provided. xvi. .
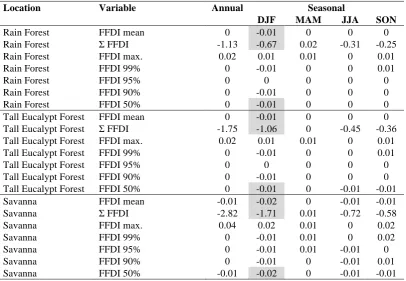
(21) in Appendix 5.4 for annual outputs and Appendices 5.5-5.8 for seasonal outputs ..... ........................................................................................................................ 122 Table 5.3. Linear trends in FFDI values (reconstructed from Mareeba data) for rain forest, tall eucalypt forest and savanna, from 1957 to 2010. Values represent the linear annual or seasonal change per year (slope coefficient). Shading indicates trends that were significant at the 95% level. Model details are provided in Appendix 5.4 for annual outputs and Appendices 5.5-5.8 for seasonal outputs. .......................................... 126. Table 5.4. Linear climatic trends for Cairns, from 1890 to 2010. Values represent the linear annual or seasonal change per year (slope coefficient). Shading indicates trends that were significant at the 95% level. Model details are provided in Appendix 5.3 for annual outputs and Appendices 5.5-5.8 for seasonal outputs. Climate variables were Southern Oscillation Index (SOI), temperature (Temp.), relative humidity (R. Hum.), rainfall, wind speed and drought factor (KBDI). ...................................... 128. Table 5.5. Linear climatic trends for Cairns and Mareeba from 1957 to 2010. Values represent the linear annual or seasonal change per year (slope coefficient). Shading indicates trends that were significant at the 95% level. Model details are provided in Appendix 5.4 for annual outputs and Appendices 5.5-5.8 for seasonal outputs. Climate variables were Southern Oscillation Index (SOI), temperature (Temp.), relative humidity (R. Hum.), rainfall, wind speed and drought factor (KBDI). .... 129. . . xvii.
(22) List of Figures. Figure 1.1 Map of the Australian Wet Tropics study area, showing elevation. Locations of relevant towns with official meteorological stations are also shown. .................... 10 Figure 1.2 Map of the Australian Wet Tropics study area, showing the distribution of broad vegetation types; rain forest, tall eucalypt forest and savanna. Locations of relevant towns with official meteorological stations are also shown. .................................. 11. Figure 2.1 Predicted distribution of rain forest (left) and overlayed with observed distribution (right). Highest probability is indicated by values closer to 1 and least probability by values closer to 0. Probabilities determined by fitted values for GLMs of rain forest distribution.. .................................................................................................. 40 Figure 2.2 Predicted distribution of tall eucalypt forest (left) and overlayed with actual distribution (right). Highest probability is indicated by values closer to 1 and least probability by values closer to 0. Probabilities determined by fitted values for GLMs of tall eucalypt forest distribution. .............................................................. 41 Figure 2.3 Predicted distribution of savanna (left) and overlayed with actual distribution (right). Highest probability is indicated by values closer to 1 and least probability by values closer to 0. Probabilities determined by fitted values for GLMs of savanna distribution. ............................................................................................... 42 Figure 2.4 Predicted distribution of rain forest, tall eucalypt forest and savanna overlayed with actual distribution of tall eucalypt forest. Highest probability is indicated by values closer to 1 and least probability by values closer to 0. Probabilities determined by fitted values for GLMs of vegetation distribution .................................................. 45 . Figure 3.1 Map of the Australian Wet Tropics region showing distribution of three broad vegetation types rain forest, tall eucalypt forest and savanna. Location of study transects and major towns are also shown. Descriptions of the numbered transects are listed in Table 3.1. ............................................................................................. 65 Figure 3.2 Map of the Australian Wet Tropics region showing the location of study transects within three broad vegetation types. Descriptions of the numbered transects are listed in Table 3.1 and site descriptions are listed in Table 3.2. ............................. 67 Figure 3.3 Average monthly temperature at Mareeba meteorological station and within three broad vegetation types (savanna, tall eucalypt forest and rain forest) in the Australian Wet Tropics region over a three-year study period. .............................. 73. xviii .
(23) Figure 3.4 Average monthly relative humidity at Mareeba meteorological station and within three broad vegetation types (savanna, tall eucalypt forest and rain forest) in the Australian Wet Tropics region over a three-year study period. .............................. 74 Figure 3.5 Average monthly meteorological measurements at Mareeba meteorological station and averaged conditions within three broad vegetation types (savanna, tall eucalypt forest and rain forest). Soil moisture deficit was calculated by the Keetch-Byram Drought Index at the Mareeba meteorological station. ........................................... 75 Figure 3.6 The predicted relationships of daily temperature in three broad vegetation types (savanna, tall eucalypt forest and rain forest) compared with Mareeba meteorological station. ............................................................................................ 78 Figure 3.7 The predicted relationships of daily relative humidity (RH) in the three broad vegetation types (savanna, tall eucalypt forest and rain forest) compared with Mareeba meteorological station. ............................................................................ 79 Figure 3.8 The relationships of four meteorological variables (rainfall, wind speed, mean soil moisture deficit and maximum soil moisture deficit) between Mareeba meteorological station and three broad vegetation types (savanna, tall eucalypt forest and rain forest)............................................................................................... 80. Figure 4.1 Average monthly maximum temperature at the meteorological station at Mareeba and within three broad vegetation types (savanna, tall eucalypt forest and rain forest) in the Australian Wet Tropics region over a three-year study period (see also Figure 3.3). ....................................................................................................... 95 Figure 4.2 Average monthly minimum relative humidity at the meteorological station at Mareeba and within three broad vegetation types (savanna, tall eucalypt forest and rain forest) in the Australian Wet Tropics region over a three-year study period (see also Fig 3.4). ............................................................................................................ 96 Figure 4.3 Average monthly wind speed at the Mareeba meteorological station and within three broad vegetation types (savanna, tall eucalypt forest and rain forest) in the Australian Wet Tropics region over a three-year study period (see also Fig 3.5). .. 96 Figure 4.4 Average monthly Soil Moisture Deficit (SMD) within three broad vegetation types (savanna, tall eucalypt forest and rain forest), plotted against the Keetch-Byram Drought Index (surrogate SMD measure) at the Mareeba meteorological station in the Australian Wet Tropics region over a three-year study period (see also Fig 3.5). ......................................................................................................................... 97 Figure 4.5 Total monthly rainfall recorded at the meteorological station at Mareeba and averaged across 8 sites in savanna vegetation in the Australian Wet Tropics region over a three-year study period (see also Fig 3.5)..................................................... 97. xix.
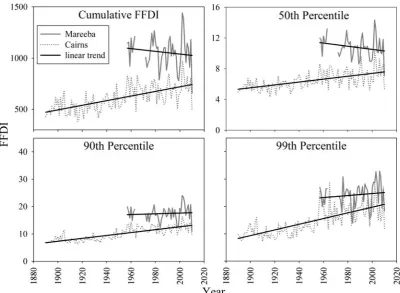
(24) Figure 4.6 Average monthly Forest Fire Danger Index (FFDI) at the meteorological station at Mareeba and within three broad vegetation types (savanna, tall eucalypt forest and rain forest) in the Australian Wet Tropics region over a three-year study period. . 98 Figure 4.7 Average monthly Forest Fire Danger Index (FFDI) at Mareeba between 1957 and 2010. The study period from April 2007 to April 2010 was typical of the entire period. ..................................................................................................................... 98 Figure 4.8 The predicted relationships of daily Forest Fire Danger Index (FFDI) in the three broad vegetation types (savanna, tall eucalypt forest and rain forest) compared with Mareeba meteorological site. ................................................................................ 100 Figure 4.9 Daily Forest Fire Danger Index (FFDI) at the meteorological station at Mareeba and within three broad vegetation types (savanna (SAV), tall eucalypt forest (TEF) and rain forest (RF) in the Australian Wet Tropics region over a three year study period. Boxes indicate medians (lines) and upper and lower quartiles, bars show 10th and 90th percentiles and circles, outliers. ....................................................... 101. Figure 5.1 The location of two official meteorological stations, Cairns and Mareeba, relative to the distribution of three broad vegetation types in the Wet Tropics of northeastern Australia. .......................................................................................... 114 Figure 5.2 Historic annual mean Forest Fire Danger Index (FFDI) at Cairns and Mareeba, with the global mean Southern Oscillation Index (SOI). SOI and FFDI display an inverse relationship, with high FFDI values occurring when SOI is strongly negative (El Niño conditions). .............................................................................. 120 Figure 5.3 Historic annual Forest Fire Danger Index (FFDI) at Cairns and Mareeba. All trends were significant for Cairns for the period from 1890 to 2010, but only the 90th percentile trend was significant from 1957 to 2010. None of these trends were significant for Mareeba. ........................................................................................ 121 Figure 5.4 Historic seasonal average Forest Fire Danger Index (FFDI) at Cairns and Mareeba for the period December-January-February (DJF), March-April-May (MAM), June-July-August (JJA) and September-October-November (SON).................... 123 Figure 5.5 Historic seasonal maximum Forest Fire Danger Index (FFDI) at Cairns and Mareeba for the period December-January-February (DJF), March-April-May (MAM), June-July-August (JJA) and September-October-November (SON). .... 123 Figure 5.6 Historic Forest Fire Danger Index (FFDI) at Cairns and Mareeba for the annual fire season during September-October-November (SON). Average (Figure 5.4) and annual maximum (Figure 5.5) for the fire season are depicted elsewhere. .......... 124. xx. .
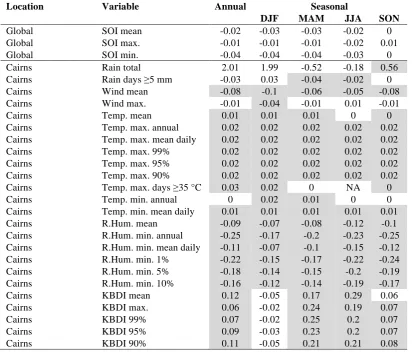
(25) Figure 5.7 Historic annual Forest Fire Danger Index (FFDI) for three vegetation types, rain forest (RF), tall eucalypt forest (TEF) and savanna (SAV). These trends were not statistically significant (Table 5.3). ....................................................................... 125 Figure 5.8 Historic Forest Fire Danger Index (FFDI) for the annual fire season during September-October-November (SON), for three vegetation types, rain forest (RF), tall eucalypt forest (TEF) and savanna (SAV). These trends were not statistically significant (Table 5.3). .......................................................................................... 125 Figure 5.9 Historic annual temperature values at Cairns and Mareeba were average, annual extreme minimum (coldest record), annual extreme maximum (hottest record) and the 90th percentile. All trends were significant for Cairns between 1890 and 2010, except for annual minimum (Table 5.4), but only average and 90th percentile trends (decreasing) were significant from 1957 to 2010 (Table 5.5). All trends for Mareeba were significant except for annual minimum temperature (Table 5.5). . 127 Figure 5.10 Historic annual total rainfall (mm) at Cairns and Mareeba. The trend for Cairns was not significant (Table 5.4 and 5.5), but was significant for Mareeba (Table 5.5).. .................................................................................................................... 128. Figure 6.1 High elevation areas of Australia. ......................................................................... 157. . xxi.
(26) List of Plates. Plate 1.. Wundu: a rain forest clad, steep, coastal mountain range of the Australian Wet Tropics. ............................................................................................................ xxxiii. Plate 2.. Tall eucalypt forest/ rain forest boundary on the Carbine Tableland; a remote and undisturbed section of the Wet Tropics. Rain forest vegetation appears in the far right of both images. Savanna vegetation can be observed on the distant, inland, range in the top of Plate 2a. .................................................................................. 20. Plate 3.. Rain forest vegetation of the Wet Tropics. .......................................................... 55. Plate 4.. Tall eucalypt forest vegetation of the Wet Tropics. ............................................. 56. Plate 5.. Savanna vegetation of the Wet Tropics................................................................ 57. Plate 6.. Micrometeorological stations in situ. a. in savanna vegetation with rainfall gauge; b. depicting data retrieval. .................................................................................... 87. Plate 7.. Prescribed fire in tall eucalypt forest above 1000 metres elevation in the Lamb Range (Davies Creek National Park), Australian Wet Tropics. The vegetation gradient can be seen, with savanna in the foreground (light green), tall eucalypt forest on the midslopes (tall white tree trunks) and rain forest vegetation (dark green with closed canopy) on the mountain summit (Kahlpahlim, 1306 m asl).104. Plate 8.. Tall eucalypt forest that has been logged, grazed and burnt, with signs of frequent fire that has damaged (right) or killed (left) mature Eucalyptus grandis trees. The understorey following such intensive disturbances if often grassy with species such as Imperata cylindrica. Mt Windsor. ......................................................... 140. Plate 9.. Logged tall eucalypt forest being burnt to maintain the grassy understorey. .... 140. Plate 10.. Prescribed burning in tall eucalypt forest that does not have a grassy understorey. The lower left image (Paluma) depicts a higher intensity burn with complete understorey and sub-canopy scorch than the other images with low intensity burns (Lamb Range). However, mature Eucalyptus grandis are readily killed by repeated low intensity fires (lower right image). ............................................... 141. . xxii . .
(27) List of Appendices. Appendix 1.1. Supplementary essay on tall eucalypt forests of the Australian Wet Tropics. .... ....................................................................................................................... 216. Appendix 2.1. Process for assessing and selecting an appropriate model technique for predicting vegetation distribution .................................................................. 229. Appendix 2.2. Testing spatial GLM analysis options and identifying techniques that are computationally viable with a large dataset................................................... 233. Appendix 2.3. Summary data for a range of geographic and climatic variables for three broad vegetation types (rain forest, tall eucalypt forest and savanna woodland) in the Australian Wet Tropics .................................................................................. 235. Appendix 2.4. Occurrence of eight category of geology (rock name) in the Wet Tropics region listing total percentage of the region and percentages occupied by three different vegetation types; rain forest (RF), tall eucalypt forest (TEF) and savanna woodland (SAV). Details for 26 additional categories, which compose the category ‘other’ are listed. ........................................................ 241. Appendix 2.5. Occurrence of six category of landform pattern in the Wet Tropics region, listing total percentage of the region and percentages occupied by three different vegetation types; rain forest (RF), tall eucalypt forest (TEF) and savanna woodland (SAV). Details for 10 additional categories, which compose the category ‘other’ are listed. ........................................................ 242. Appendix 2.6. Occurrence of 10 category of relief type in the Wet Tropics region, listing total percentage of the region and percentages occupied by three different vegetation types; rain forest (RF), tall eucalypt forest (TEF) and savanna woodland (SAV). Details for 3 additional categories, which compose the category ‘other’ are also provided ................................................................. 243. Appendix 2.7. Occurrence of six category soil order (Australian Soil Classification) in the Wet Tropics region, listing total percentage of the region and percentages occupied by three different vegetation types; rain forest (RF), tall eucalypt forest (TEF) and savanna woodland (SAV). Details for six additional categories, which compose the category ‘other’ are listed. ........................... 244. Appendix 2.8. Comparison of spatial (residuals autocovariate) non-linear logistic regressions testing for individual variables predicting distribution of 3 vegetation types: a. rain forest, b. tall eucalypt forest and c. savanna ........................................... 245. . xxiii.
(28) Appendix 3.1. Shoo, L. P., Storlie, C., Vanderwal, J., Little, J. & Williams, S. E. (2011) Targeted protection and restoration to conserve tropical biodiversity in a warming world. Global Change Biology 17, 186–193 ................................. 249. Appendix 3.2. Letter and report authored by Jeremy Little and submitted to State Ministers regarding the 'Cessation of timber harvesting at Herberton Range State Forest' in the Australian Wet Tropics, an identified protection priority of cool climate refugia ............................................................................................... 259. Appendix 3.3. Ministerial response to the report 'Cessation of timber harvesting at Herberton Range State Forest' ....................................................................................... 284. Appendix 3.4. Gazettal notice regarding the transfer of the Mt Baldy section of Herberton Range State Forest from State Forest to protected area tenure (Baldy Mountain Forest Reserve) on 9 December 2010 ........................................................... 287. Appendix 3.5. Calibration for maximum temperature (Tmax, °C) measured in PVC housing against standard Stevenson Screen (SS) housing. Calibrations also used Photosynthetically Active Radiation (PAR, µmol/m2/s) measurements (where available), which determined the amount of sunlight directly affecting the PVC housing. Results are provided for categories of canopy cover with a. 025% canopy cover and b. 26-75% canopy cover. Testing showed it was not necessary to adjust readings from sites with a thick canopy (76-100% canopy). ...................................................................................................................... 290. Appendix 3.6. Pairwise models (GLM) comparing each of ten daily micrometeorological variables within each of three vegetation types; rain forest (RF), tall eucalypt forest (TEF) and savanna (SAV). Pairwise combinations, therefore, were RF:TEF, RF:SAV and TEF:SAV. micrometeorological variables were recorded within each vegetation type, replicated eight times in eight different 'transect' locations; Koombooloomba (AUKO), Mt Baldy (AUMB), Mt Lewis (CUML), Mt Spurgeon (CUMS), Davies Ck (LUDC), Tinnaroo Ck (LUTC), Paluma (SUPA) and Mt Windsor (WUMW). The response variable for each model consists of one of ten microclimate variables for the first vegetation type (in the pairwise analysis) and the explanatory variables were the microclimate variable at the second vegetation type, transect and their interaction. Micrometeorological variables were temperature (a. maximum, b. mean, c. minimum), relative humidity (d. maximum, e. mean, f. minimum), mean wind speed (g.) and soil moisture deficit (SMD; h. maximum, i. mean) and solar exposure (j.). Coefficient estimate, standard error (SE), 95% confidence intervals (95% CI), probability significance (P), Akaike. xxiv .
(29) Information Criterion (AICc) and percent explained deviance (D2) relative to the null model are reported ............................................................................ 291 Appendix 3.7. Model selection of pairwise models (GLM) comparing each of ten daily microclimate variables within each of three vegetation types; rain forest (RF), tall eucalypt forest (TEF) and savanna (SAV). Pairwise combinations, therefore, were RF:TEF, RF:SAV and TEF:SAV. Microclimate variables were recorded within each vegetation type, replicated eight times in eight different transect locations; Koombooloomba (AUKO), Mt Baldy (AUMB), Mt Lewis (CUML), Mt Spurgeon (CUMS), Davies Ck (LUDC), Tinnaroo Ck (LUTC), Paluma (SUPA) and Mt Windsor (WUMW). The full model response variable was one of ten microclimate variables for the first vegetation type (in the pairwise analysis) and the explanatory variables were the microclimate variable at the second vegetation type, transect and their interaction. Microclimate variables were temperature (a. maximum, b. mean, c. minimum), relative humidity (d. maximum, e. mean, f. minimum), mean wind speed (g.) and soil moisture deficit (SMD; h. maximum, i. minimum) and solar exposure (j.). Alternative candidate models consisted of the absence of the interaction term (model_1), the absence of the interaction term and 'transect' (model_2), 'transect' only (model_3) and the null model (model_null). Model selection was based on Akaike Information Criterion (AICc) and all tables are ranked by AICc. Delta AICc, Akaike weights (wi) and percent explained deviance (D2) relative to the null model are also reported .......................................................................................................... 303. Appendix 3.8. Linear mixed effects models testing the capacity for daily Mareeba meteorological data and vegetation type to predict daily observed micrometeorological patterns at 32 field study sites (recorded daily over a three-year period). Vegetation types were rain forest (RF), tall eucalypt forest (TEF) and savanna (SAV). The response variable for each model was sitebased micrometeorology and the predictor variables were daily meteorology data at Mareeba meteorological station, vegetation type and their interaction, with 'transect' as a random effect. Models were repeated for each of ten meteorological variables; temperature (a. maximum, b. mean, c. minimum), relative humidity (d. maximum, e. mean, f. minimum), mean wind speed (g.), soil moisture deficit (h. maximum, i. mean) and rainfall (j.; savanna sites only). Coefficient estimate, standard error (SE), 95% confidence intervals (95% CI), t values (t), probability (P), Akaike Information Criterion (AICc) and percent explained deviance (D2) relative to the null model are reported 309. xxv.
(30) Appendix 3.9. Model selection of linear mixed effects models testing the capacity for daily Mareeba meteorological data and vegetation type (rain forest, tall eucalypt forest and savanna) to predict daily observed micrometeorological conditions at 32 field study sites. Models were repeated for each of ten meteorological variables (response variable); temperature (a. maximum, b. mean, c. minimum), relative humidity (d. maximum, e. mean, f. minimum), mean wind speed (g.), soil moisture deficit (h. maximum, i. mean) and rainfall (j.; savanna sites only). Meteorological data at Mareeba, vegetation type, and their interaction were the explanatory variables, with ‘Transect’ as a random effect. Alternative candidate models were the full model without the interaction term (model_1), the absence of the interaction term and 'transect' (model_2), 'transect' only (model_3) and the null model (model_null). Model selection was based on Akaike Information Criterion (AICc) and all tables are ranked by AICc. Delta AICc, Akaike weights (wi) and percent explained deviance (D2) relative to the null model are also reported ........................................... 312. Appendix 3.10 Linear mixed effects models testing the relationship between vegetation type and transect with daily observed micrometeorological conditions at 32 field study sites (recorded daily over a three-year period). Vegetation types were rain forest (RF), tall eucalypt forest (TEF) and savanna (SAV). Micrometeorological variables were recorded within each vegetation type, replicated eight times in eight different transect locations; Koombooloomba (AUKO), Mt Baldy (AUMB), Mt Lewis (CUML), Mt Spurgeon (CUMS), Davies Ck (LUDC), Tinnaroo Ck (LUTC), Paluma (SUPA) and Mt Windsor (WUMW). The response variable for each model was site-based micrometeorology and the predictor variables were vegetation type, transect and their interaction, with 'day' as a random effect. Models were repeated for each of eleven micrometeorological variables (response variable); temperature (a. maximum, b. mean, c. minimum), relative humidity (d. maximum, e. mean, f. minimum), mean wind speed (g.), soil moisture deficit (h. maximum, i. mean), rainfall (j.) and solar exposure (k.). Coefficient estimate, standard error (SE), 95% confidence intervals (95% CI), t values (t), probability (P), Akaike Information Criterion (AICc) and percent explained deviance (D2) relative to the null model are reported ........................................................................... 315 Appendix 3.11 Model selection of linear mixed effects models testing the relationship between vegetation type and transect with daily observed micrometeorology at 32 field study sites (recorded daily over a three-year period). Vegetation types were rain forest (RF), tall eucalypt forest (TEF) and savanna (SAV). Models xxvi .
(31) were repeated for each of eleven meteorological variables (response variable); temperature (a. maximum, b. mean, c. minimum), relative humidity (d. maximum, e. mean, f. minimum), mean wind speed (g.), soil moisture deficit (h. maximum, i. mean), rainfall (j.) and solar exposure (k.). The response variable for each model was site-based micrometeorology and the predictor variables were vegetation type, transect and their interaction, with 'day' as a random effect in all models. Alternative candidate models were the full model without the interaction term (model_1), vegetation only (model_2), transect only (model_3) and the null model (model_null). Model selection was based on Akaike Information Criterion (AICc) and all tables are ranked by AICc. Delta AICc, Akaike weights (wi) and percent explained deviance (D2) relative to the null model are also reported ................................................................ 322 Appendix 3.12 Linear mixed effects models testing the relationship between vegetation type and elevation with daily observed micrometeorological conditions at 32 field study sites (recorded daily over a three-year period). Vegetation types were rain forest (RF), tall eucalypt forest (TEF) and savanna (SAV). The response variable for each model was site-based micrometeorology and the predictor variables were vegetation type, elevation and their interaction, with 'day' as a random effect. Models were repeated for each of eleven micrometeorological variables (response variable); temperature (a. maximum, b. mean, c. minimum), relative humidity (d. maximum, e. mean, f. minimum), mean wind speed (g.), soil moisture deficit (h. maximum, i. mean), rainfall (j.) and solar exposure (k.). Coefficient estimate, standard error (SE), 95% confidence intervals (95% CI), t values (t), probability (P), Akaike Information Criterion (AICc) and percent explained deviance (D2) relative to the null model are reported .......................................................................................................... 325 Appendix 3.13 Model selection of linear mixed effects models testing the relationship between vegetation type and elevation with daily observed micrometeorological conditions at 32 field study sites (recorded daily over a three-year period). Vegetation types were rain forest (RF), tall eucalypt forest (TEF) and savanna (SAV). Models were repeated for each of eleven micrometeorological variables (response variable); temperature (a. maximum, b. mean, c. minimum), relative humidity (d. maximum, e. mean, f. minimum), mean wind speed (g.), soil moisture deficit (h. maximum, i. mean), rainfall (j.) and solar exposure (k.). The response variable for each model was site-based micrometeorology and the predictor variables were vegetation type, elevation and their interaction, with 'day' as a random effect in all models. Alternative. xxvii.
Figure


+7



Related documents