Loading of Silica Nanoparticles in Block Copolymer Vesicles during
Polymerization-Induced Self-Assembly: Encapsulation E
ffi
ciency and
Thermally Triggered Release
Charlotte J. Mable,
*
,†Rebecca R. Gibson,
†Sylvain Prevost,
‡Beulah E. McKenzie,
†Oleksandr O. Mykhaylyk,
*
,†and Steven P. Armes
*
,††Department of Chemistry, University of Sheffield, Brook Hill, Sheffield, South Yorkshire S3 7HF, United Kingdom ‡ESRF, The European Synchrotron, 71 Avenue des Martyrs, 38000 Grenoble, France
*
S Supporting InformationABSTRACT: Poly(glycerol monomethacrylate)-poly(2-hy-droxypropyl methacrylate) diblock copolymer vesicles can be prepared in the form of concentrated aqueous dispersions via polymerization-induced self-assembly (PISA). In the present study, these syntheses are conducted in the presence of varying amounts of silica nanoparticles of approximately 18 nm diameter. This approach leads to encapsulation of up to hundreds of silica nanoparticles per vesicle. Silica has high electron contrast compared to the copolymer which facilitates TEM analysis, and its thermal stability enables quantification of the loading efficiency via thermogravimetric analysis. Encapsulation efficiencies can be calculated using disk centrifuge photosedimentometry, since the vesicle density
increases at higher silica loadings while the mean vesicle diameter remains essentially unchanged. Small angle X-ray scattering (SAXS) is used to confirm silica encapsulation, since a structure factor is observed at q≈0.25 nm−1. A new two-population model provides satisfactory datafits to the SAXS patterns and allows the mean silica volume fraction within the vesicles to be determined. Finally, the thermoresponsive nature of the diblock copolymer vesicles enables thermally triggered release of the encapsulated silica nanoparticles simply by cooling to 0−10 °C, which induces a morphological transition. These silica-loaded vesicles constitute a useful model system for understanding the encapsulation of globular proteins, enzymes, or antibodies for potential biomedical applications. They may also serve as an active payload for self-healing hydrogels or repair of biological tissue. Finally, we also encapsulate a model globular protein, bovine serum albumin, and calculate its loading efficiency using fluorescence spectroscopy.
■
INTRODUCTIONMicrocompartmentalization is widely acknowledged to be a fundamental prerequisite for life on Earth.1−4 Many intra-cellular processes require spatial separation of components via impermeable lipid membranes, with membrane proteins allowing the selective diffusion of various chemical species in and out of cells.5Similarly, microencapsulation is important for many industrial formulations, ranging from orally administered drugs6to agrochemicals7,8to laundry products.9,10This enables the controlled release of active components and can also prevent the premature deactivation of mutually incompatible components, such as enzyme denaturation by bleach chemicals in liquid laundry products. In particular, liposomes11and block copolymer vesicles12−19(or“polymersomes”) are some of the most widely used carriers in the development of drug delivery applications.20−22 Typically, such hollow nanoparticles are loaded with water-soluble drugs,23−25 oligonucleotides,25−27 enzymes,28or antibodies.29In this context, there are also a few reports describing the incorporation of magnetic nanoparticles
within block copolymer vesicle membranes, which may enable active targeting of tumors.30
Over the last five years or so, polymerization-induced self-assembly (PISA) has become established as a powerful tool for the rational design and efficient synthesis of a wide range of diblock copolymer nano-objects in either aqueous solution or non-aqueous media.31−33Of particular relevance to the present study, RAFT aqueous dispersion polymerization can be utilized to prepare block copolymer vesicles at copolymer concen-trations of up to 25% w/v solids.34−38Periodic sampling during such syntheses has confirmed a progressive evolution in copolymer morphology, with transmission electron microscopy (TEM) studies revealing that the transformation of highly anisotropic worms into well-defined vesicles proceeds via a so-called“jellyfish”intermediate.35These observations suggest an intriguing question: can the efficient encapsulation of
nano-Received: October 5, 2015 Published: November 24, 2015
Article
pubs.acs.org/JACS License, which permits unrestricted use, distribution and reproduction in any medium,
particles within the vesicles be achieved during such PISA syntheses?39This question is directly addressed herein, with an aqueous silica sol being selected as a model cargo. These nanoparticles were chosen for the following five reasons: (i) they are commercially available in the form of concentrated dispersions; (ii) they possess sufficient electron contrast to allow their visualization by TEM; (iii) they are relatively strong X-ray scatterers; (iv) their density is sufficiently high to enable sedimentation-based particle size analysis; (v) their loading efficiency can be readily determined using thermogravimetry. Moreover, Leibler and co-workers40recently reported that silica nanoparticles enable the convenient repair of cleaved synthetic hydrogels or biological tissue (e.g., organs such as the liver). Hence, such silica nanoparticles are likely to be a biomedically relevantactivespecies, in addition to serving as a model cargo. In the present study, a series of silica-loaded AB diblock copolymer vesicles was readily prepared via RAFT aqueous dispersion polymerization36,37,41 by chain-extending a water-soluble poly(glycerol monomethacrylate) (PGMA) chain transfer agent (CTA) using 2-hydroxypropyl methacrylate (HPMA) in the presence of varying concentrations of aqueous silica nanoparticles.
Provided that an appropriate diblock copolymer composition is targeted, the resulting amphiphilic PGMA−PHPMA diblock copolymer chains undergo in situ self-assembly via a complex multistep mechanism that ultimately leads to the formation of large polydisperse vesicles.35 An open-ended “jellyfish” structure is generated just prior to vesicle formation;35hence, silica nanoparticles can diffuse within the jellyfish before membrane formation is complete, leading to their in situ encapsulation. It is perhaps worth emphasizing that vesicle formation via this pathway circumvents the problem of encapsulation discussed by Adams et al. for vesicles prepared via post-polymerization processing of preformed diblock copolymers.42
■
RESULTS AND DISCUSSIONSynthesis and Characterization of Silica-Loaded Vesicles. RAFT solution polymerization of GMA was conducted in ethanol at 70°C to generate a near-monodisperse G58 macro-CTA (Mw/Mn = 1.13; see Figure S1). After
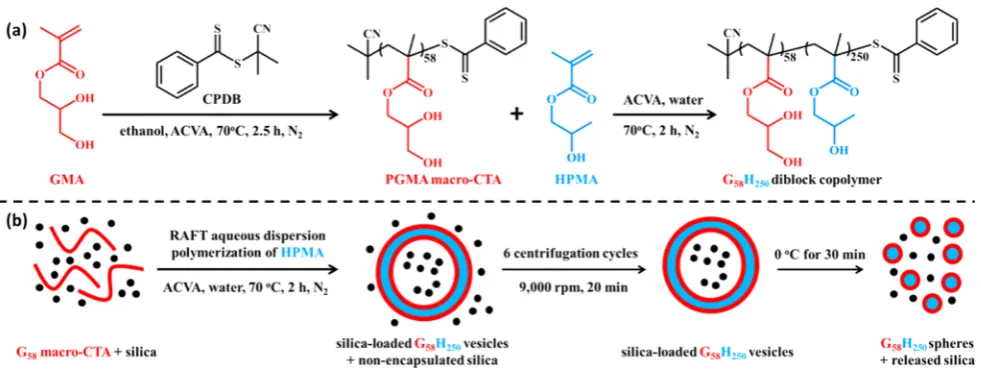
purification, this water-soluble macro-CTA was utilized for the RAFT aqueous dispersion polymerization of HPMA at 10% w/w solids (see Figure 1a) to obtain PGMA58-PHPMA250 diblock copolymers, denoted hereafter as G58H250 for the sake of brevity. Gel permeation chromatography (GPC) studies indicated that near-monodisperse diblock copolymers were obtained with minimal macro-CTA contamination and high blocking efficiencies (Mw/Mn = 1.12; see Figure S1). RAFT aqueous dispersion polymerization of HPMA was also conducted in the presence of 5−35% w/w silica nanoparticles. 1H NMR studies (see Figure S2) indicated that >99% HPMA conversion was achieved within 2 h at 70°C, regardless of the presence of silica nanoparticles.
[image:2.625.69.560.66.251.2]TEM images (seeFigures 2andS3) reveal a pure vesicular morphology for the control experiments performed in the absence of any silica nanoparticles, as expected when targeting such an asymmetric G58H250 diblock copolymer composi-tion.35,36 Dynamic light scattering (DLS) studies indicated a mean vesicle diameter of 350 nm with a polydispersity (PDI) of 0.08 (seeTable 1). The folds that are discernible in the TEM images are the result of vesicle buckling and/or partial collapse of these relatively delicate nanostructures under ultrahigh vacuum. For experiments conducted in the presence of silica nanoparticles, TEM images reveal that a pure vesicular morphology is still obtained, with excess non-encapsulated silica nanoparticles also present. In order to remove the non-encapsulated silica, the vesicles were centrifuged at 9000 rpm for 20 min and redispersed in deionized water (see cartoon in Figure 1b). After six centrifugation−redispersion cycles, TEM images suggest that the vast majority of the non-encapsulated silica is removed and that the remaining silica nanoparticles reside within the vesicles (seeFigures 2andS3).
Hypothetically, these TEM observations could be the result of drying artifacts. In contrast, cryo-TEM allows the direct observation of hydrated vesicles that have not been dried, stained, or fixed; thus, this technique is much more representative of their native environment. Cryo-TEM images (seeFigure 3) confirm that the silica nanoparticles are indeed located inside the vesicle lumen. Both DLS and TEM studies indicate that the vesicle diameter is essentially unchanged, regardless of the initial silica concentration, [silica]0.
Figure 1.(a) Synthesis of a G58macro-CTA via RAFT solution polymerization and subsequent synthesis of G58H250diblock copolymer via RAFT
aqueous dispersion polymerization (targeting this copolymer composition is known to lead to vesicle formation35,36). (b) Schematic cartoon illustrating in situ encapsulation of silica nanoparticles during the synthesis of G58H250diblock copolymer vesicles via RAFT aqueous dispersion
Simple geometric considerations suggest that the maximum number of silica nanoparticles encapsulated per vesicle during these PISA syntheses should be given by the total vesicle lumen volume multiplied by the number of silica nanoparticles per unit volume in the aqueous solution, which depends on [silica]0. In order to quantify the amount of silica encapsulated within the vesicle lumen, the following three characterization techniques were utilized.
Disk Centrifuge Photosedimentometry (DCP). DCP reports the weight-average particle diameter, which lies between the number-average and intensity-average diameters reported by TEM and DLS, respectively.43
Assuming a spherical particle morphology, a DCP weight-average diameter can be calculated, provided that the particle
density is accurately known. Since the PHPMA membrane is highly plasticized by water38the vesicle density wasestimatedto be 1.10 g cm−3. When arbitrarilyfixing the vesicle density at this value, the mean vesicle diameter increases monotonically and Figure 2. TEM images of G58H250 diblock copolymer vesicles
synthesized in the presence of increasing amounts of silica nano-particles (0−20% w/w silica). (Left) As-synthesized dried dispersions containing excess silica. (Right) After six centrifugation−redispersion cycles to remove excess silica. Additional TEM images for silica-loaded vesicles prepared using an initial silica concentration of 15%, 25%, 30%, or 35% w/w are shown inFigure S3.
Table 1. Summary of DLS Hydrodynamic Diameters (Dh), Initial and Final Silica Contents Determined by Thermogravimetry (TGA) Before and After Centrifugation, TGA-Derived Silica Loading Efficiency (LETGA), Effective Density (ρeff), Number of Silica Nanoparticles Per Vesicle (Nsv), and Encapsulation Efficiency (EEDCP) Determined Using Disk Centrifuge
Photosedimentometry (DCP), SAXS-Derived Vesicle Diameter (whereDv = 2RvandσDvIs Its Standard Deviation), and the Concentration of Encapsulated Silica Obtained for a Series of G58H250Diblock Copolymers Prepared in the Presence of 0−35% w/w Silica
[silica]0
(% w/w)
DLSDh
(PDI) (nm)
initial TGA silica content (%) fi
nal TGA silica content (%)
LETGA
(%)
DCPρeff
(g cm−3) DCP
Nsv EEDCP(%)
SAXSDv±
σDv(nm)
SAXS-derived concentration of encapsulated silica (% w/w)
0 350 (0.08) 0.25 0.25 0.0 1.071 0 0 291±7 0
5 364 (0.17) 37.7 3.78 7.85 1.076 9 13.2 296±6 0.20
10 390 (0.18) 51.5 8.72 9.55 1.084 24 16.9 295±5 0.41 15 317 (0.20) 63.5 13.6 10.5 1.093 40 18.9 323±5 1.12 20 402 (0.17) 73.1 17.0 10.2 1.106 66 24.6 335±6 1.87 25 382 (0.15) 78.2 19.2 9.51 1.119 91 25.6 301±5 1.75 30 410 (0.16) 83.8 21.0 8.85 1.130 112 26.2 332±5 2.03 35 346 (0.09) 86.5 22.1 8.12 1.141 133 26.6 301±5 1.79
Figure 3.Cryo-TEM images obtained for (a) empty G58H250diblock
copolymer vesicles, (b) G58H250diblock copolymer vesicles prepared
in the presence of 20% w/w silica nanoparticles (after centrifugation to remove excess silica nanoparticles), and (c) the silica nanoparticles alone, for which the SAXS-derived vesicle diameter (Dv) is 18.4 nm.
Figure 4.DCP data recorded for G58H250diblock copolymer vesicles
prepared in the presence of increasing amounts of silica nanoparticles (0−35% w/w silica). (a) Uncorrected weight-average vesicle size distributions for which an arbitrary vesicle density of 1.10 g cm−3was
utilized. (b) Corrected weight-average vesicle size distributions whereby the weight-average diameter was held constant at 291 nm (as calculated from SAXS analysis of vesicles prepared in the absence of any silica nanoparticles) by adjusting the vesicle density from 1.071 to 1.141 g cm−3, see Table 1. These densities were then used to
calculate the silica content of the vesicles. N.B. The apparent
broadening of these DCP size distributions is an artifact caused by the superposition of a density distribution on the size distribution (because larger vesicles will contain more silica nanoparticles, see main text for details).
the vesicle size distribution becomes significantly broader when the [silica]0is increased from 0 to 35% w/w (seeFigure 4a). Given that the silica density is 2.06(5) g cm−3 (as judged by helium pycnometry), this suggests that the number of silica nanoparticles encapsulated per vesicle increases at higher [silica]0, as expected. Hence, the effective vesicle density increases, resulting in much faster sedimentation of the vesicles relative to the non-encapsulated silica nanoparticles. This means that DCP analyses can be conducted on the as-synthesized dispersions, since the excess silica nanoparticles cannot be detected on the same (short) time scale as the vesicles. However, the vesicle size distribution hasfinite width, and larger vesicles contain many more silica nanoparticles than smaller vesicles. This leads to a density distribution being superimposed on the vesicle size distribution, which results in its artificial broadening. In principle, this problem can be corrected by calculating the particle density for a given diameter, as reported by Fielding et al.43 However, this refinement was not considered necessary in the present work. SAXS analysis of the G58H250 diblock copolymer vesicles prepared in the presence of silica nanoparticles indicated volume-average vesicle diameters of 295−335 nm, which are comparable to the mean diameter of 291±7 nm obtained for empty vesicles (seeTable 1). This suggests that the presence of the silica nanoparticles does not significantly affect the PISA synthesis. Taking the SAXS diameter of the empty vesicles to be the true DCP diameter for both empty and silica-loaded vesicles, the effective vesicle density (ρeff) must vary from 1.071 to 1.141 g cm−3on increasing the [silica]
0from 0 to 35% w/w (seeFigure 4b). This difference inρeffallows calculation of (i) the mean number of silica nanoparticles encapsulated per vesicle (Nsv), (ii) the volume of the vesicle lumen occupied by silica nanoparticles (Vsl), and (iii) the encapsulation efficiency (EEDCP, see eqs S1−S8 in the Supporting Information for calculations). This analysis suggests thatNsvincreases from 0 to 133 (seeFigure 5a andTable 1),Vslincreases from 0 to 4.76%, andEEDCPincreases from 0 to 27% on increasing [silica]0from 0 to 35% w/w (seeFigure 5b andTable 1). TheNsvincreases monotonically with [silica]0. However, Nsv is lower than the theoretical Nsv calculated from geometric considerations. Naively, we expected that theNsvwould be simply comparable to the number of silica nanoparticles that occupy a certain volume for a given [silica]0. However, the silica concentration inside the vesicle lumen islowerthan that outside the vesicles. This suggests a mass transport problem: diffusion of the silica nanoparticles within the jellyfish during PISA appears to be relatively slow on the time scale of vesicle formation. Thus, only approximately 27% of the theoretical maximum amount of silica is actually encapsulated within the vesicle lumen (see Figure 5b).
Thermogravimetric Analysis (TGA). Pyrolysis of the methacrylic copolymer used in this study leaves no incombustible residues on heating up to 800 °C in air. In contrast, the silica nanoparticles are thermally stable under these conditions. Thus, TGA can be used to determine the encapsulated silica content of dried vesicles after removal of the excess non-encapsulated silica via six centrifugation− redis-persion cycles (see TEM images inFigure 2).
The silica nanoparticles used in this work lose∼10.1% mass on heating to 350 °C in air during TGA analysis. This is attributed to a combination of surface moisture and also pyrolysis of surface glycerol groups (at ∼350 °C), which are present for this particular commercial grade. This mass loss
must be taken into account when calculating the silica content of the silica-loaded vesicles (see eq S9 in the Supporting Information and also for the data shown in Table 1). As expected, TGA curves recorded prior to centrifugation (see Figure S4a) indicate higher silica contents than those observed after centrifugation (seeFigure S4b).
In calculating the TGA-derived loading efficiency (LETGA, see eqs S9 and S10) it is assumed that (i) all the copolymer present has formed vesicles, (ii) there are no empty vesicles, and (iii) all of the excess silica was removed via centrifugation (which is likely to be the case in view of the gravimetric analysis results shown inFigure S5). TheLETGAremains relatively constant at around 9% regardless of the [silica]0 (see Figure 5b). It is perhaps worth emphasizing the difference betweenLETGA and EEDCP. The former parameter is calculated from experimental TGA data and represents the proportion of silica that is encapsulated within the vesicles relative to [silica]0. In contrast, EEDCP is calculated by combining the DCP and SAXS data. SAXS is used to determine an accurate weight-average vesicle diameter, vesicle membrane thickness, and vesicle lumen volume. The numerator term is the mean number of silica nanoparticles per vesicle (determined by using the SAXS diameter to calculate the precise vesicle density required to correct the raw DCP data), while the denominator is calculated by multiplying the [silica]0by the total vesicle lumen volume divided by the total volume of the solution. This calculation assumes that there are no interactions between the copolymer and the silica. For a given vesicle diameter and [silica]0, the Figure 5. Effect of varying the initial silica concentration, [silica]0,
during the in situ loading of silica nanoparticles into G58H250diblock
copolymer vesicles prepared via RAFT aqueous dispersion polymer-ization at 70°C. (a) Comparison of the theoretical maximum number of silica nanoparticles encapsulated per vesicle with that calculated experimentally from DCP data. (b) Comparison of DCP-derived silica encapsulation efficiency (EEDCP) and the TGA-derived loading
efficiency (LETGA).
denominator term can be used to calculate the theoretical maximum number of silica nanoparticles per vesicle.
Small Angle X-ray Scattering (SAXS).In order to analyze the synchrotron SAXS data obtained for these silica-loaded vesicles, it was necessary to develop an appropriate analytical model. Three types of particles are present in these samples: empty copolymer vesicles (morphology 1), spherical silica nanoparticles (morphology 2), and silica-loaded copolymer vesicles (morphology 3). In general, the silica component scatters X-rays more strongly than the copolymer, but the silica nanoparticles (morphology 2) dominate the scattering intensity at high q, whereas the much larger vesicles (morphology 1) dominate the scattering at low q. Drawing on our earlier structural characterization of core−shell nanocomposite par-ticles comprising polymer cores and particulate silica shells,44 the scattering patterns associated with morphology 3 can be satisfactorilyfitted using a two-population model. In this case population 1 corresponds to silica-loaded vesicles and population 2 describes the particulate nature of the corresponding lumen. Thus this two-population model includes a modified version of morphology 1 and morphology 2 and can be applied to all three morphologies. In general, the scattering intensity of a system composed ofndifferent (non-interacting) populations of polydisperse objects can be expressed as:
∫
∫
∑
= Ψ
=
∞ ∞
I q S q N F q r r r r
r r
( ) ( ) ... ( , , ..., ) ( , ..., )
d ...d
l n
l l l l lk l l lk
l lk
1 0 0
1 1
1 (1)
where Fl(q, rl1,...,rlk) is the form factor, Ψl(q, rl1,...,rlk) is the distribution function,Nlis the number density per unit volume, and Sl(q) is the structure factor of the lth population in the system.rl1,...,rlkis a set ofkparameters describing the structural morphology of thelth population. The two-population model can be derived fromeq 1 by taking n = 2 and assigning the silica-loaded copolymer vesicles to population 1 (l= 1) and the spherical silica nanoparticles within the vesicle lumen to population 2 (l = 2). The form factor for population 1 (vesicles) can be described as:45
β β
β
= + + −
+
F q A q N F qR N N
A q N A q A q
( ) [ ( )] ( ) ( 1)
[ ( )] 2 ( ) ( )
ml
ml
1
2
agg c 2
c g agg agg c
2
c 2
agg c c (2)
However, this expression requires modification to represent silica-loadedvesicles: the amplitude of the membrane self-term ineq 2must be replaced by an amplitude representing both the membrane and the silica-loaded lumen expressed as the form factor amplitude for a core−shell spherical particle:46
ξ ξ
ξ ξ ξ ξ
= − − Φ
+ − − − − Φ
A q x V qR
x V qR
( ) (1 )( ) ( )
[ (1 )( )] ( )
ml
l
sol m sol out out
sol sol m sol in in
(3)
whereRin=Rm−(1/2)Tmis the radius of the lumen,Rout=Rm + (1/2)Tm is the outer radius of the membrane, Vin = (4/ 3)πRin3 is the volume of the vesicle lumen, and V
out = (4/ 3)πRout3is the volume of the vesicle.Rmis the radius from the center of the vesicle to the middle of the membrane,Tmis the membrane thickness (Figure 6), and Φ(x) = (3[sin(x) − xcos(x)])/x3is the form factor amplitude for a homogeneous sphere. The vesicle aggregation number (i.e., the mean number of copolymer chains per vesicle) is given by Nagg = (1 − xsol)(Vout − Vin)/Vm, where xsol is the solvent fraction in the
membrane and Vm is the volume of the membrane-forming hydrophobic PHPMA block (Vm = VPHPMA250). The X-ray scattering length contrast for the corona block isβc=Vc(ξc− ξsol), where Vc is the corona block volume (VPGMA58). The block volumes are calculated from V = Mw/(ρNA) using the weight-average molecular weight,Mw, of the block components and the mass densities of the three blocks comprising the copolymer (ρPHPMA= 1.21±0.01 g cm−3andρ
PGMA= 1.31± 0.01 g cm−3; these values were determined for the corresponding homopolymers using helium pycnometry).ξsol, ξm, ξc, andξl are the X-ray scattering length densities of the surrounding solvent (ξH2O= 9.42×10
10cm−2), the membrane-forming hydrophobic block (ξPHPMA= 11.11×1010cm−2), the vesicle corona block (ξPGMA = 11.94 × 1010 cm−2), and the vesicle lumen [ξl = (1 − VSiO2/Vin)ξH2O + (VSiO2/Vin)ξSiO2, where ξSiO2 = 17.5 × 1010 cm−2 and V
SiO2 is the volume occupied by silica nanoparticles within the lumen]. It should be mentioned that the X-ray scattering length contrast for the membrane block is given byβm=Vm(ξm−ξsol). Thus the (βc/ βm)2ratio is approximately 0.08, which suggests that the profile of the electron density distribution within the corona should be included in the model. However, recent modeling of experimental data on a similar system has demonstrated that incorporation of a profile function in the model has a negligible effect on the derived structural parameters.38 The self-correlation term for the corona block ineq 2 is given by the Debye function,Fc(qRg) = (2[exp(−q2R
g
2)−1 +q2R g 2])/(q4R
[image:5.625.328.557.69.257.2]g 4), whereRg is the radius of gyration of the corona block (Figure Figure 6.SAXS patterns obtained for 1.0% w/w aqueous dispersions of G58H250 diblock copolymer vesicles prepared via PISA in the
presence of varying amounts of silica nanoparticles (0%, 5%, and 35% w/w silica). Gray circles represent data, and solid lines representfitting curves: when no silica was present during the vesicle synthesis, a single-population vesicle model was sufficient tofit the corresponding SAXS pattern, whereas two populations were required when silica nanoparticles were present during the PISA synthesis. Red and blue dashed lines represent populations 1 and 2, respectively. For clarity, the upper two SAXS patterns are shifted vertically by arbitrary scaling factors, as shown on the plot. (Inset) Schematic representation of empty and silica-loaded G58H250 diblock copolymer vesicles, where
small black circles represent silica nanoparticles, red = PGMA block (G), light blue = PHPMA block (H),Rmis the radius from the center
of the vesicle to the middle of the membrane,Tmis the membrane
thickness, andRgis the radius of gyration of the corona.
6). Assuming that there is no penetration of the corona blocks within the membrane, the amplitude of the corona self-term is expressed as:
= Ψ +
+ + − − ⎡ ⎣ ⎢ ⎢ ⎤ ⎦ ⎥ ⎥
A q qR q R R
q R R
q R R
q R R
( ) ( )1 2
sin[ ( )]
( )
sin[ ( ]
( )
c g
out g
out g
in g
in g (4)
where Ψ(qRg) = (1 − exp(−qRg))/(qRg)2 is the form factor amplitude of the corona chain. The polydispersities for two parameters (RmandTm), expressed as a Gaussian distribution, are considered for thefirst (silica-loaded vesicle) population:
πσ πσ
Ψ = σ
σ
− −
− −
r r e
e
( , ) 1 2 1 2 R r R T r T
1 11 12
m 2
( ) /2
m 2
( ) /2
R
T
11 m2 2m
12 m 2
m 2
(5)
whereσRmandσTmare the standard deviations forRmandTm, respectively. The number density per unit volume of population 1 (l= 1 ineq 1) is expressed as:
∫ ∫
=
Ψ ∞ ∞
N c
V r( ,r ) ( ,r r )d dr r
1
1
0 0 1 11 12 1 11 12 11 12 (6)
where c1 is the total volume f raction of copolymer molecules forming vesicles in the sample and V1(r11, r12) is the total volume of copolymers in a vesicle [V1(r11, r12) = (Vm + Vc) Nagg(r11,r12)]. It is assumed that the vesicle dispersion is sufficiently dilute to enable the structure factor for population 1 to be set to unity [S1(q) = 1]. Population 1 describes scattering from a vesicle with a homogeneous lumen. However, the lumen actually has a particulate structure arising from the encapsulated silica nanoparticles. This generates an additional scattering signal that can be described by population 2, for whichl= 2 in eq 1. The form factor for this population is simply that for a homogeneous sphere:
ξ ξ
= − Φ
F q2( ) ( SiO2 sol)2 2(qRSiO2) (7)
where RSiO2 is the mean radius of the silica nanoparticles. All other parameters and functions in the model for population 2 are analogous to those for population 1 (eq 2). The polydispersity of one parameter (RSiO2), expressed as a Gaussian distribution, is considered for population 2:
πσ
Ψ( )r = 1 e− − σ
2
l
R
r R
2 2 2 ( ) /2 R
SiO2 21 SiO2 2 SiO2 2 (8)
where σRSiO2 is the standard deviation for RSiO2. The number density per unit volume of population 2 is expressed as:
∫
=
Ψ ∞
N c
V r( ) ( )dr r
2
2
0 2 21 2 21 21 (9)
where c2 is the total volume f raction of silica particles in the sample and V2(r21) = (4/3)πr213 is the volume of a single spherical silica nanoparticle. Since interparticle interactions are expected for silica particles occupying the vesicle lumen, a hard-sphere interaction structure factor based on the Percus−Yevick approximation47was introduced into the model for population 2:
=
S q2( ) SPY( ,q RPY,fPY) (10)
whereRPYis the interaction radius andfPYis an effective hard-sphere volume fraction. The model was incorporated in Irena SAS macros for Igor Pro software,48and numerical integration ofeqs 1,6, and9was used for datafitting.
Accordingly, use of population 1 alone was sufficient for satisfactory data fits to SAXS patterns obtained for empty G58H250diblock copolymer vesicles synthesized in the absence of any silica nanoparticles. Use of the vesicle model (l= 1 ineq 1andξl=ξsolineq 3) produced a reasonably goodfit over 7 orders of magnitude of X-ray scattering intensity (seeFigure 6). The overall vesicle radius,Rv=Rout+ 2Rg, was calculated to be 145.5 nm (Table S1), which is consistent with both TEM observations (Figure 2) and DLS data (Table 1). TheRgof the G58corona block was determined to be 2.3 nm fromfitting of the G58H250 SAXS pattern.38 This experimental value is comparable to a theoretical estimate: the projected contour length of a single GMA monomer is 0.255 nm (two carbon bonds in all-trans conformation), the total contour length of a G58block,LPGMA= 58×0.255 nm = 14.79 nm, and the Kuhn length of 1.53 nm, based on the literature value for poly(methyl methacrylate),49 result in an estimated Rg of (14.79 × 1.53/ 6)1/2 or 1.94 nm. The SAXS data fit suggested that the hydrophobic PHPMA component of the vesicle membrane was solvated,xsol= 0.16.
In order to produce satisfactory fits to SAXS patterns obtained for G58H250 diblock copolymer vesicles prepared in the presence of silica nanoparticles, incorporation of population 2 (l = 2 in eq 1) into the model was essential. It was also assumed for thefitting that all silica nanoparticles represented by population 2 are located within the vesicles. Thus the volume fraction of silica nanoparticles, c2, and the scattering length density of the lumen, ξl, must be related in order to produce a self-consistent model. In this respect, the scattering length density of the lumen can be expressed asξl= (1−c2/ cl)ξH2O+ (c2/cl)ξSiO2, wherecl= (c1Vin)/((Vout−Vin)(1−xsol)), is the total volume fraction of the vesicle lumen.
Structural parameters for the silica nanoparticles alone were obtained from SAXS patterns recorded for 0.1%, 1%, and 5% w/w aqueous silica sols (see Figure S6). In this case, only population 2 of the model was required for satisfactory datafits. The silica nanoparticle radius (RSiO2) was estimated to be 9.2± 2.1 nm in all cases. Fittings for the 1% and 5% w/w silica SAXS patterns required a hard-sphere interaction structure factor (see eq 10), because a pronounced peak at q ≈ 0.25 nm−1 was observed at higher silica concentrations. In contrast, no structure factor was observed for the 0.1% w/w silica sol, as expected.
A superposition of X-ray scattering signals from the two populations used in the model produced goodfits to the SAXS data obtained for vesicles synthesized in the presence of silica nanoparticles after removal of excess non-encapsulated silica (Figure 6andTable S1). It is assumed that both theRgof the PGMA block and the water content within the vesicle membrane are independent of [silica]0. This is reasonable because the same batch of PGMA macro-CTA was utilized and the same PHPMA block degree of polymerization (DP) was targeted in all cases. Thus theRg andxsolvalues obtained for G58H250diblock copolymer vesicles synthesized in the absence of any silica were also used for SAXS fitting of the vesicles synthesized in the presence of silica nanoparticles. Moreover,
SAXS analysis shows that both Tm and Rv remain virtually constant regardless of [silica]0(Tm≈15.9 nm andRv≈145.5 nm,Table S1), which is consistent with our TEM observations (Figure 2) and DLS data (Table 1). This confirms that the dimensions of the empty vesicles produced using this PISA formulation in the absence of any silica are comparable to those obtained in the presence of the silica nanoparticles (seeTable 1). It is emphasized that the broad peak at q ≈ 0.25 nm−1, which is associated with interacting silica nanoparticles, confirms successful silica encapsulation within the vesicles. Moreover, increasing the [silica]0 leads to both a higher effective volume fraction and a reduction in the correlation distance between silica nanoparticles (fPYandRPY, respectively, seeTable S1), which suggests a greater packing density for the silica nanoparticles within the vesicle lumen. This was corroborated by control experiments in which silica nano-particles were added to empty vesicles to afford dispersions of the same overall silica concentration. SAXS patterns recorded for such dispersions did not possess any peak atq≈0.25 nm−1 corresponding to silica nanoparticles, indicating that no structure factor is required in this case (see Figure S7). These SAXS observations confirm beyond any reasonable doubt that the silica nanoparticles are indeed encapsulated within the vesicles during these PISA syntheses.
The concentration of encapsulated silica nanoparticles (see Table 1) can be estimated using the volume fraction of silica nanoparticles (c2) obtained from thefitted SAXS patterns. In general, the SAXS data are in fairly good agreement with the corresponding TGA data (seeFigure 7). However, SAXS tends to underestimate the concentration of encapsulated silica at higher [silica]0. In principle, this might be because TGA cannot distinguish between the silica nanoparticles located within the vesicles and any excess, non-encapsulated silica that might remain in the aqueous continuous phase. In contrast, the two-population SAXS model used in this work is mainly sensitive to silica nanoparticles located within the vesicle lumen. However, TEM studies coupled with gravimetric analysis of successive supernatants suggest that there is relatively little, if any, non-encapsulated silica present after six centrifugation−redispersion cycles (see Figures 2 and S5, respectively). This discrepancy arises because DCP reports artificially broadened, highly asymmetric size distributions at higher [silica]0, as discussed earlier. This is essentially a polydispersity effect: heavier vesicles containing relatively high silica loadings appear larger in the
DCP size distribution, whereas lighter vesicles containing fewer encapsulated silica nanoparticles appear smaller, giving rise to an artificially skewed distribution.
[image:7.625.62.299.67.200.2]This polydispersity effect also leads to uncertainty in the calculated copolymer volume fraction (c1). The copolymer concentration was actually kept constant at 1.0% w/w for all SAXS measurements. However, the SAXS model incorrectly suggests that the copolymer concentration is reduced 10-fold as the [silica]0is increased from 0 to 35% w/w. Such a significant discrepancy must be associated with the broad distribution of Nsv indicated by DCP measurements. The latter technique shows that at low [silica]0 there is a relatively symmetric (approximately Gaussian) distribution of silica nanoparticles per vesicle. However, vesicle dispersions prepared at higher [silica]0 exhibit significantly broader, highly asymmetric distributions skewed to higher mass (Figure 4). This effect is enhanced because ξSiO2 is higher than that of the copolymer (17.5 × 10¹⁰ vs 11.11 × 1010 cm−2, respectively), so heavily loaded vesicles scatter much more strongly than lightly loaded (or empty) vesicles. This bias becomes important at higher [silica]0, resulting in a lowerapparentcopolymer concentration. In contrast, for [silica]0= 5% w/w, the particle size distribution is relatively narrow and symmetric (approximately Gaussian), meaning that the SAXS data are more reliable in this regime. For PISA syntheses conducted at this relatively low [silica]0, the mean number of silica nanoparticles per vesicle is calculated to be 9 and 14 for DCP and SAXS, respectively.
In principle, the problem in the SAXS analysis observed at high [silica]0could be rectified by incorporating an additional function in order to account for the polydispersity of Nsv. However, the current SAXS model already incorporates three polydispersity functions (eqs 5 and 8): an extra function describing the asymmetric distribution of Nsv would signifi -cantly complicate the data analysis and is beyond the scope of this work.
Thermally Triggered Release of Silica Nanoparticles.
In the light of recent work by Leibler and co-workers, the controlled release of silica nanoparticles from vesicles could offer a self-repair mechanism for either synthetic hydrogels or living tissues.40 For the G58H250 diblock copolymer vesicles described herein, a relatively low degree of polymerization (DP) was targeted for the thermoresponsive PHPMA block because we wished to explore the feasibility of controlled release of the encapsulated silica nanoparticles.
In control experiments performed in the absence of any silica nanoparticles, TEM studies confirmed that the G58H250diblock copolymer vesicles underwent a morphology change to produce a mixture of diblock copolymer spheres and short worm-like micelles on cooling to 0°C for 30 min (seeFigure S8).
For silica-loaded G58H250 diblock copolymer vesicles prepared in the presence of 5% w/w silica nanoparticles, a similar change in morphology was observed on cooling (see Figure 8a). Such vesicle dissociation leads to release of the encapsulated silica nanoparticles, which results in loss of the silica structure factor in the corresponding SAXS pattern. Thus, this thermally triggered transition confirms that the silica nanoparticles are indeed encapsulated within the vesicle lumen. SAXS was utilized to explore the kinetics of silica nanoparticle release at 0 °C (see Figure 9). Time-resolved SAXS studies indicated that intact silica-loaded vesicles were still present after 6 min at 0°C. Close inspection of these SAXS patterns confirmed that the local minimum atq≈0.02 nm−1, Figure 7.Effect of varying the initial silica concentration, [silica]0, on
the concentration of encapsulated silica, as calculated using SAXS (green triangles, measured at 1.0% w/w copolymer) and TGA (red circles) for G58H250diblock copolymer vesicles prepared at 10% w/w
in the presence of 0−35% w/w silica nanoparticles (after six centrifugation−redispersion cycles).
which is associated with the vesicle form factor, disappeared after 9 min at 0°C. Moreover, the gradient of the scattering pattern at low q is reduced from −2 to −1 after 9 min, indicating the formation of worm-like micelles. This gradient tends to zero after 12 min at 0°C, suggesting further vesicle dissociation to form a mixture of spheres and short worm-like micelles. Furthermore, thefinal pattern after 30 min at 0°C is
identical to that obtained after 12 min, confirming that the morphological transition is essentially complete after 12 min. Further time-resolved SAXS studies were conducted for silica-loaded vesicles prepared in the presence of 10−35% w/w silica nanoparticles, which will be reported elsewhere in due course. Leibler’s recent pioneering study40 suggests that silica nanoparticles can be utilized as remarkably effective adhesives for the repair of both synthetic hydrogels and biological tissue. More specifically, two cut pieces of either polydimethylacryla-mide gel or calf’s liver can be glued together simply by spreading an aqueous solution of 30 nm commercial silica nanoparticles on the two freshly cleaved interfaces and applying light pressure for 30 s. In the context of the present study, we hypothesize that silica nanoparticles encapsulated within vesicles are not available for the repair of either synthetic hydrogels or biological tissue. However, after their thermally triggered release from the vesicles, the silica nanoparticles should be able to act as an effective adhesive. However, for a useful self-healing system it may be preferable to achieve silica nanoparticle release at higher temperatures than 0 °C. Temperature-dependent DLS studies (seeFigure S9a) indicate the onset of vesicle dissociation at around 10°C, as judged by the reduction in count rate and mean particle diameter (Dh). Time-resolved DLS studies show that the rate of dissociation is significantly faster at lower temperature. For example, Dh decreases from approximately 350 nm to 76 nm after 2 h at 2°C, with a concomitant reduction in count rate from 22 000 to 1000 kcps (seeFigure S9b). TEM images verify release of the encapsulated silica nanoparticles, plus the coexistence of copolymer spheres (seeFigure 8b). After aging at 5°C for 57 h,
Dh increases to 523 nm before decreasing to 284 nm, which
suggests vesicle swelling prior to their dissociation (seeFigure S9c). However, thefinalDhvalue is not consistent with sphere formation. This is confirmed by TEM, which reveals the formation of a complex mixture of lamellae and worm-like micelles under these conditions (seeFigure 8c). Nevertheless, the encapsulated silica nanoparticles are still released (see red circles inFigure 8c). Moreover, aging for 71 h at 10°C, both Dhand the count rate remain constant at around 350 nm and 20 000 kcps, respectively, which atfirst sight suggests that the silica-loaded vesicles are not thermoresponsive under these conditions (see Figure S9d). Indeed, TEM images reveal that some vesicles are still intact, yet at least some originally encapsulated silica nanoparticles were released, indicating that a minor fraction of vesicles undergo dissociation (seeFigure 8d). In summary, both the extent and the rate of release of encapsulated silica nanoparticles can befine-tuned by varying the release temperature and aging time. In principle, it would be desirable to conduct time-resolved SAXS studies of the silica-loaded vesicles at 2, 5, or 10 °C, but the much longer experimental time scales required (days) preclude such experiments.
[image:8.625.61.301.69.232.2]Protein Encapsulation. We wished to examine whether the abovefindings with silica nanoparticles could be extended to include a model globular protein (bovine serum albumin, BSA). Thus, we conducted RAFT aqueous dispersion polymer-ization of HPMA at 37 °C using a low-temperature initiator (VA-044) to obtain G55H270diblock copolymer vesicles. These relatively mild conditions were essential in order to avoid denaturation of the protein cargo. The rate of HPMA polymerization was significantly slower at 37 °C, but never-theless essentially full conversion (>99%) was achieved within 8 h as judged by1H NMR studies (seeFigure S10a). GPC studies Figure 8. TEM images obtained for G58H250 diblock copolymer
vesicles synthesized in the presence of 5% w/w silica nanoparticles (seeFigure 2) after cooling to (a) 0°C for 30 min, (b) 2°C for 3 h, (c) 5°C for 57 h, and (d) 10 °C for 71 h. Cooling results in the release of the encapsulated silica nanoparticles, which are more electron-dense than the copolymer nanoparticles (red circles depict free silica nanoparticles). Cooling to 0 or 2 °C causes vesicles to dissociate to spherical micelles and short worm-like micelles, cooling to 5°C results in jellyfish, worms, and lamellae, and cooling to only 10
°C results in minimal vesicle disintegration.
Figure 9.SAXS patterns obtained for 1.0% w/w aqueous dispersions of G58H250diblock copolymer vesicles (originally prepared via PISA at
10% w/w copolymer in the presence of 5% w/w silica). The excess/ non-encapsulated silica nanoparticles were removed via six centrifu-gation−redispersion cycles. Then the purified silica-loaded G58H250
vesicles were cooled to 0°C for 30 min while scattering patterns were collected every 15 s. Selected SAXS patterns recorded after various times at 0°C are shown (for clarity, these patterns are shifted vertically by an arbitrary scaling factor). Silica-loaded vesicles are present up to 8 min (red circles) but undergo dissociation to form worm-like micelles after 9 min (green circles), followed by further transformation to produce mainly spheres after 12 min (blue circles).
[image:8.625.62.299.345.535.2]confirmed that a near-monodisperse diblock copolymer was obtained with minimal macro-CTA contamination and a high blocking efficiency (Mw/Mn = 1.16; see Figure S10b). TEM images (seeFigure 10a) reveal a pure vesicular morphology, as expected when targeting such an asymmetric G55H270diblock copolymer composition. The vesicles are not affected by this
low-temperature PISA formulation, suggesting that it may be possible to encapsulate proteins or other delicate biomolecules (e.g., DNA, RNA, antibodies, enzymes etc.) intact under mild conditions. To examine this hypothesis, G55H270 diblock copolymer vesicles were synthesized at 37°C in the presence of 5% w/w BSA. GPC studies indicated that near-monodisperse diblock copolymers were obtained with a comparable Mn, minimal macro-CTA contamination, and high blocking efficiencies (Mw/Mn = 1.17; see Figure S10b), despite the presence of BSA. After removal of the non-encapsulated BSA via six centrifugation−redispersion cycles, TEM images confirmed the expected vesicular morphology (see Figure 10b). Moreover, encapsulated BSA is discernible within the vesicle lumen. It should be noted that BSA is a monothiol-functional protein, which in principle can participate in radical-based polymerizations.52−54 However, GPC, TEM, and 1H NMR studies suggest that this 37°C PISA formulation is not adversely affected by the presence of 5% w/w BSA.
Conveniently, BSA is intrinsically fluorescent: it absorbs at 278 nm and emits at 337 nm,50,51 which enables the loading efficiency of BSA within the vesicles (LEBSA) to be calculated. First, the fluorescence emission was obtained for a series of aqueous BSA dispersions, with concentrations ranging from 0.00075% to 0.01% w/w (seeFigure S11a). From these data, a linear calibration plot was constructed (see Figure S11b). Fluorescence spectra were obtained for (i) G55H270 vesicles synthesized in the presence of 5% w/w BSA, (ii) G55H270 vesicles synthesized in the presence of 5% w/w BSA after purification by centrifugation−redispersion, and (iii) for G55H270vesicles synthesized in the absence of BSA (seeFigure 10c). The emission at 337 nm for the latter dispersion was subtracted from that of the former dispersions in order to normalize the data. Using this calibration plot, [BSA]0 was calculated to be 5.19% w/w, whereas the concentration of encapsulated BSA, [BSA]e, was determined to be 0.559% w/w, indicating aLEBSAof 10.8% (seeeqs S11−13). This calculation assumes that all of the non-encapsulated BSA was removed via six centrifugation−redispersion cycles. Analysis of successive supernatants after each centrifugation cycle indicates that most (3.6% w/w) of the non-encapsulated BSA was removed during thefirst centrifugation−redispersion cycle, and the amount of non-encapsulated BSA remaining in the supernatant after six centrifugation-redispersion cycles is negligible (seeFigure S12). During the preparation of this manuscript, Zhang et al.55 reported successful encapsulation of both BSA and silica nanoparticles within PEG−PHPMA vesicles prepared at 20°C using a photoinitiated PISA formulation. However, compared to the present study, only limited characterization of the extent of encapsulation was undertaken.
■
CONCLUSIONS [image:9.625.59.302.144.638.2]In summary, we report the in situ encapsulation of silica nanoparticles within PGMA−PHPMA diblock copolymer vesicles prepared via PISA in concentrated aqueous solution. Excess silica is readily removed via centrifugation−redispersion cycles, and the presence of the silica nanoparticles within the purified vesicles is confirmed by cryo-TEM studies. Thermo-gravimetric analysis enables the loading efficiency to be directly determined, and these results are fully consistent with quantitative data derived from both disk centrifuge sedimen-tometry and small angle X-ray scattering studies. The former technique indicates that silica encapsulation leads to a density distribution being superimposed on the vesicle size distribution, Figure 10. TEM images obtained for G55H270 diblock copolymer
vesicles prepared via PISA at 10% w/w copolymer at 37°C in the (a) absence of BSA and (b) presence of 5% w/w BSA (after six centrifugation−redispersion cycles to remove non-encapsulated BSA). (c) In order to calculate the BSA loading efficiency within the vesicles, fluorescence emission spectra were recorded for both the empty G55H270vesicles and the BSA-loaded G55H270vesicles before and after
centrifugation. The background fluorescence emission spectrum of water was also recorded (the sharp signal at 305 nm is a Raman water band). [N.B. BSA exhibits weak intrinsicfluorescence; absorption at 278 nm and emission at 337 nm].50,51
which results in its artificial broadening. The latter technique required development of a new analytical model to calculate the silica volume fraction within the vesicles. SAXS studies also reveal a silica structure factor, which provides compelling evidence for successful nanoparticle encapsulation within the vesicles. To our knowledge, this is the most detailed study yet of a model vesicle encapsulation system. Moreover, we demonstrate that the encapsulated silica nanoparticles can be released in a controlled manner via thermally triggered vesicle dissociation. Time-resolved SAXS studies indicated that the vesicle-to-sphere morphological transition is complete after 12 min at 0 °C. DLS studies and TEM images show that this morphological transition required much longer time scales (hours/days) when cooling to 2, 5, or 10 °C. Our findings suggest the possibility of a “self-healing” formulation for synthetic hydrogels and perhaps also biological tissue.40 Furthermore, we demonstrate that in situ vesicle loading via PISA formulations is translatable to other cargoes, including biologically relevant species such as proteins.
■
ASSOCIATED CONTENT*
S Supporting InformationThe Supporting Information is available free of charge on the ACS Publications websiteat DOI:10.1021/jacs.5b10415.
Full details of synthetic protocols and characterization techniques, DCP, TGA, and fluorometer calculations, DMF GPC traces, 1H NMR spectra, additional TEM images, TGA traces, [silica]s data, SAXS patterns and datafits for the silica sols and a control sample, summary table of SAXS parameters, DLS data, fluorescence emission spectra and calibration plot, and [BSA]s data (PDF)
■
AUTHOR INFORMATIONCorresponding Authors
*cmable1@sheffield.ac.uk
*o.mykhaylyk@sheffield.ac.uk
*s.p.armes@sheffield.ac.uk Notes
The authors declare no competingfinancial interest.
■
ACKNOWLEDGMENTSWe thank Christopher Hill and Svetomir Tzokov at the University of Sheffield Biomedical Science Electron Microscopy Suite. The authors are grateful to ESRF (Grenoble, France) for providing SAXS beam time, and the personnel of the ID02 station are thanked for help with SAXS experiments. S.P.A. thanks the European Research Council for an ERCAdvanced
Investigator grant (PISA 320372) to support C.J.M., O.O.M.,
B.M. and also EPSRC for a Platform grant (EP/J007846/1) to support O.O.M.
■
REFERENCES(1) Stano, P.; Carrara, P.; Kuruma, Y.; Pereira de Souza, T.; Luisi, P. L.J. Mater. Chem.2011,21, 18887.
(2) Li, M.; Harbron, R. L.; Weaver, J. V. M; Binks, B. P.; Mann, S.
Nat. Chem.2013,5, 529.
(3) Pohorille, A.; Deamer, D.Trends Biotechnol.2002,20, 123. (4) Szostak, J. W.; Bartel, D. P.; Luisi, P. L.Nature2001,409, 387. (5) Stadler, B.; Price, A. D.; Chandrawati, R.; Hosta-Rigau, L.; Zelikin, A. N.; Caruso, F.Nanoscale2009,1, 68.
(6) Nii, T.; Ishii, F.Int. J. Pharm.2005,298, 198.
(7) Schwartz, L.; Wolf, D.; Markus, A.; Wybraniec, S.; Wiesman, Z.J. Agric. Food Chem.2003,51, 5972.
(8) Shirley, I. M.; Scher, H. B.; Perrin, R. M.; Wege, P. J.; Rodson, M.; Chen, J.-L.; Rehmke, A. W.Pest Manage. Sci.2001,57, 129.
(9) Keen, P. H. R.; Slater, N. K. H.; Routh, A. F.Langmuir2014,30, 1939.
(10) Yow, H. N.; Routh, A. F.Langmuir2009,25, 159. (11) Torchilin, V. P.Nat. Rev. Drug Discovery2005,4, 145. (12) Antonietti, M.; Forster, S.Adv. Mater.2003,15, 1323. (13) Discher, B. M.; Won, Y. Y.; Ege, D. S.; Lee, J. C. M.; Bates, F. S.; Discher, D. E.; Hammer, D. A.Science1999,284, 1143.
(14) Checot, F.; Lecommandoux, S.; Gnanou, Y.; Klok, H.-A.́ Angew. Chem., Int. Ed.2002,41, 1339.
(15) Rodríguez-Hernandez, J.; Lecommandoux, S.́ J. Am. Chem. Soc.
2005,127, 2026.
(16) Discher, D. E.; Eisenberg, A.Science2002,297, 967.
(17) Du, J.; Tang, Y.; Lewis, A. L.; Armes, S. P.J. Am. Chem. Soc.
2005,127, 17982.
(18) Wilson, D. A.; Nolte, R. J. M.; van Hest, J. C. M.Nat. Chem.
2012,4, 268.
(19) Napoli, A.; Valentini, M.; Tirelli, N.; Muller, M.; Hubbell, J. A.
Nat. Mater.2004,3, 183.
(20) Photos, P. J.; Bacakova, L.; Discher, B.; Bates, F. S.; Discher, D. E.J. Controlled Release2003,90, 323.
(21) Brinkhuis, R. P.; Rutjes, F.; van Hest, J. C. M.Polym. Chem.
2011,2, 1449.
(22) Pegoraro, C.; Cecchin, D.; Gracia, L. S.; Warren, N.; Madsen, J.; Armes, S. P.; Lewis, A.; MacNeil, S.; Battaglia, G.Cancer Lett. 2013,
334, 328.
(23) Sanson, C.; Schatz, C.; Le Meins, J. F.; Soum, A.; Thevenot, J.; Garanger, E.; Lecommandoux, S.J. Controlled Release2010,147, 428. (24) Ahmed, F.; Pakunlu, R. I.; Srinivas, G.; Brannan, A.; Bates, F.; Klein, M. L.; Minko, T.; Discher, D. E.Mol. Pharmaceutics2006,3, 340.
(25) Christian, D. A.; Cai, S.; Bowen, D. M.; Kim, Y.; Pajerowski, J. D.; Discher, D. E.Eur. J. Pharm. Biopharm.2009,71, 463.
(26) Huang, J.; Bonduelle, C.; Thevenot, J.; Lecommandoux, S.;́ Heise, A.J. Am. Chem. Soc.2012,134, 119.
(27) Lomas, H.; Canton, I.; MacNeil, S.; Du, J.; Armes, S. P.; Ryan, A. J.; Lewis, A. L.; Battaglia, G.Adv. Mater.2007,19, 4238.
(28) van Dongen, S. F. M.; Nallani, M.; Cornelissen, J.; Nolte, R. J. M.; van Hest, J. C. M.Chem. - Eur. J.2009,15, 1107.
(29) Canton, I.; Massignani, M.; Patikarnmonthon, N.; Chierico, L.; Robertson, J.; Renshaw, S. A.; Warren, N. J.; Madsen, J. P.; Armes, S. P.; Lewis, A. L.; Battaglia, G.FASEB J.2013,27, 98.
(30) Lecommandoux, S.; Sandre, O.; Chécot, F.; Rodriguez-Hernandez, J.; Perzynski, R.J. Magn. Magn. Mater.2006,300, 71.
(31) Fielding, L. A.; Derry, M. J.; Ladmiral, V.; Rosselgong, J.; Rodrigues, A. M.; Ratcliffe, L. P. D.; Sugihara, S.; Armes, S. P.Chemical Science2013,4, 2081.
(32) Fielding, L. A.; Lane, J. A.; Derry, M. J.; Mykhaylyk, O. O.; Armes, S. P.J. Am. Chem. Soc.2014,136, 5790.
(33) Gonzato, C.; Semsarilar, M.; Jones, E. R.; Li, F.; Krooshof, G. J. P.; Wyman, P.; Mykhaylyk, O. O.; Tuinier, R.; Armes, S. P. J. Am. Chem. Soc.2014,136, 11100.
(34) Sugihara, S.; Blanazs, A.; Armes, S. P.; Ryan, A. J.; Lewis, A. L.J. Am. Chem. Soc.2011,133, 15707.
(35) Blanazs, A.; Madsen, J.; Battaglia, G.; Ryan, A. J.; Armes, S. P.J. Am. Chem. Soc.2011,133, 16581.
(36) Blanazs, A.; Ryan, A. J.; Armes, S. P.Macromolecules2012,45, 5099.
(37) Warren, N. J.; Armes, S. P.J. Am. Chem. Soc.2014,136, 10174. (38) Warren, N. J.; Mykhaylyk, O. O.; Ryan, A. J.; Williams, M.; Doussineau, T.; Dugourd, P.; Antoine, R.; Portale, G.; Armes, S. P.J. Am. Chem. Soc.2015,137, 1929.
styrene monomer conversions of only 10% were obtained, and this study utilized an alcoholic formulation, which has limited applicability for drug delivery. It was also not clear from the reportedfluorescence spectroscopy data whether some (or all) of the dye was located within the vesicle membrane rather than the vesicle lumen. Moreover, encapsulation efficiencies of up to 120% were claimed, which suggests either an experimental artifact or rather large systematic errors. In contrast, in the present study we focus on an aqueous PISA formulation, achieve very high monomer conversions (99%), and calculate physically realistic encapsulation efficiencies for silica nanoparticles using three analytical techniques.
(40) Rose, S.; Prevoteau, A.; Elziere, P.; Hourdet, D.; Marcellan, A.; Leibler, L.Nature2014,505, 382.
(41) Li, Y.; Armes, S. P.Angew. Chem., Int. Ed.2010,49, 4042. (42) Adams, D. J.; Adams, S.; Atkins, D.; Butler, M. F.; Furzeland, S.
J. Controlled Release2008,128, 165.
(43) Fielding, L. A.; Mykhaylyk, O. O.; Armes, S. P.; Fowler, P. W.; Mittal, V.; Fitzpatrick, S.Langmuir2012,28, 2536.
(44) Balmer, J. A.; Mykhaylyk, O. O.; Schmid, A.; Armes, S. P.; Fairclough, J. P. A.; Ryan, A. J.Langmuir2011,27, 8075.
(45) Bang, J.; Jain, S. M.; Li, Z. B.; Lodge, T. P.; Pedersen, J. S.; Kesselman, E.; Talmon, Y.Macromolecules2006,39, 1199.
(46) Pedersen, J. S.Adv. Colloid Interface Sci.1997,70, 171. (47) Kinning, D. J.; Thomas, E. L.Macromolecules1984,17, 1712. (48) Ilavsky, J.; Jemian, P. R.J. Appl. Crystallogr.2009,42, 347. (49) Fetters, L. J.; Lohse, D. J.; Colby, R. H. InPhysical Properties of Polymers Handbook; Mark, J., Ed.; Springer: New York, 2007; p 447. (50) Papadopoulou, A.; Green, R. J.; Frazier, R. A. J. Agric. Food Chem.2005,53, 158.
(51) Han, X.-L.; Tian, F.-F.; Ge, Y.-S.; Jiang, F.-L.; Lai, L.; Li, D.-W.; Yu, Q.-L.; Wang, J.; Lin, C.; Liu, Y.J. Photochem. Photobiol., B2012,
109, 1.
(52) Bontempo, D.; Heredia, K. L.; Fish, B. A.; Maynard, H. D.J. Am. Chem. Soc.2004,126, 15372.
(53) Mantovani, G.; Lecolley, F.; Tao, L.; Haddleton, D. M.; Clerx, J.; Cornelissen, J. J. L. M.; Velonia, K.J. Am. Chem. Soc.2005,127, 2966. (54) Geng, J.; Mantovani, G.; Tao, L.; Nicolas, J.; Chen, G.; Wallis, R.; Mitchell, D. A.; Johnson, B. R. G.; Evans, S. D.; Haddleton, D. M.J. Am. Chem. Soc.2007,129, 15156.
(55) Tan, J.; Sun, H.; Yu, M.; Sumerlin, B. S.; Zhang, L.ACS Macro Lett.2015,4, 1249.

![Figure 5. Eeduring the in situ loading of silica nanoparticles into Gffect of varying the initial silica concentration, [silica]0,58H250 diblockcopolymer vesicles prepared via RAFT aqueous dispersion polymer-ization at 70 °C](https://thumb-us.123doks.com/thumbv2/123dok_us/7893874.186730/4.625.326.563.57.342/eeduring-nanoparticles-gect-concentration-diblockcopolymer-vesicles-prepared-dispersion.webp)

![Figure 7. Ethe concentration of encapsulated silica, as calculated using SAXS(green triangles, measured at 1.0% w/w copolymer) and TGA (redcircles) for Gffect of varying the initial silica concentration, [silica]0, on58H250 diblock copolymer vesicles prepared at 10% w/win the presence of 0−35% w/w silica nanoparticles (after sixcentrifugation−redispersion cycles).](https://thumb-us.123doks.com/thumbv2/123dok_us/7893874.186730/7.625.62.299.67.200/concentration-encapsulated-calculated-redcircles-concentration-nanoparticles-sixcentrifugation-redispersion.webp)


