eurostat
STATISTICAL OFFICE OF THE EUROPEAN C O M M U N I T I E S OFFICE STATISTIQUE DES C O M M U N A U T E S EUROPEENNES ISTITUTO STATISTICO DELLE C O M U N I T A EUROPEE
BUREAU VOOR DE STATISTIEK DER EUROPESE GEMEENSCHAPPEN
Luxembourg-Kirchberg, BoTte postale 1907 — Tel. 43011, Telex: Comeur Lu 3423
1049 Bruxelles, Batiment Berlaymont, Rue de la Loi 200 (Bureau de liaison) — Tel. 7 35 80 40
Denne publikation kan fas gennem de salgssteder, som er naevnt p§ omslagets tredje side i dette haefte.
Diese Veroffentlichung ist bei den auf der dritten Umschlagseite aufgefiihrten Vertriebsburos erhaltlich.
This publication is obtainable from the sales agents mentioned on the inside back cover.
Pour obtenir cette publication, priere de s'adresser aux bureaux de vente dont les adresses sont indiquees a la troisieme page de la couverture.
Per ottenere questa pubblicazione, si prega di rivolgersi agli uffici di vendita i cui indirizzi sono indicati nella 3a pagina della copertina.
USEFUL ENERGY BALANCE-SHEETS
1975
DE ISBN 9 2 - 8 2 5 - 0 2 0 0 - 7 FR ISBN 9 2 - 8 2 5 - 0 2 0 2 - 5
A bibliographical slip can be found at the end of this volume
For all informations concerning this study, contact: F. DESGARDES - Tel. 4 3 0 1 1 , ext. 3 1 0 2 , Luxembourg
Reproduction of the contents of this publication is subject to acknowledgement of the source
Printed in Belgium 1978
ISBN 9 2 - 8 2 5 - 0 2 0 1 - 5
TABLE OF CONTENTS
PAGES
I INTRODUCTION 5 II PRINCIPLES 6 III PRESENTATION 8 IV BREAKDOWN BY SOURCE OF ENERGY 10
V THE BALANCE-SHEET SYSTEM 13 VI UNITS OF MEASUREMENT 16 VII CONVERSION COEFFICIENTS 18 VIII METHOD OF CONSTRUCTING THE BALANCE-SHEET 19
IX EFFICIENCY AT THE FINAL CONSUMER STAGE 21
X BREAKDOWN OF USEFUL ENERGY 25 XI CALCULATION OF LOSSES .AND ENERGY SECTOR 28
XII FUTURE IMPROVEMENTS AND CONCLUSIONS 30
XIII ANALYSIS OF RESULTS - FRANCE-GERMANY 1975 33
XIV ANALYSIS OF RESULTS - FRANCE 1975 41 XV COMPARISON OF RESULTS - GERMANY-FRANCE 1975 48
TABLES AND GRAPHS - FR. -GERMANY 1975 53
TABLES AND GRAPHS - FRANCE 1975 79
5
-I -INTRODUCT-ION
The energy balance-sheets currently published in the Community are of the
'primary input1 type using coal as a reference* They are drawn up by
converting the various sources of energy into their energy equivalents at
the primary input level• This system means that the quantities consumed
are expressed in terms of the calorific value of the energy needed at the
primary input level to meet final consumption requirements. The result is
that when one form of energy is transformed into another, losses during
transformation are not recorded. Compiling the balance-sheets in this way
no longer seems to meet the needs of economic analysis fully. Recent trends
in energy policy in the wake of the 1973 oil crisis call for a more
detailed knowledge of the amount of energy actually used for transformation
and by final consumers. Work on energy—saving and demand analyses and
fore-casts has made it necessary to know the exact losses of energy which occur
during the various stages of transformation and consumption and thus the
actual energy consumed, i.e. useful energy1.
For these purposes the present balance-sheets - drawn up and valid purely
from the primary input standpoint - have several drawbacks. They tackle the
problem solely from the producers' point of view, thereby failing to take
account of the importance of consumption, obscuring losses, favouring
certain forms of energy because of the equivalence conversion method and
using a unit of measurement of thermal equivalence which has a variable and
non-transitive definition.
An endeavour must therefore be made to improve the above system and to
overcome these drawbacks if the new analysis requirements are to be met
more effectively. The aim is to calculate 'useful energy', i.e. to record
the amount of energy actually used by the final consumer to cover his
requirements.
In order t o achieve t h i s , the present primary input balance-sheets must f i r s t be converted i n t o 'energy supplied' b a l a n c e - s h e e t s , i . e . c a l c u l a t e
energy actually delivered to the final consumers'door. Useful
energy is then calculated by multiplying this quantity by the
efficiency of the final apparatus used by the final consumer.
This entails the observation of a number of principles.
II PRINCIPLES
It is necessary to t
- observe the First Law of Thermodynamics, which states that
the energy in a closed system remains constant, i.e. the
equation : input = output + losses. A consumer cannot obtain
more energy than that contained in the resources placed at
his disposal;
- treat all sources of energy on an equal footing, which means
applying precise equivalents and conversion factors to them
and using the same balance system for all of them in order
to make it possible to add the totals together and to obtain
a better picture of the effects of substitutions;
- use a unit of measure which is neutral, general and
transiti-ve, and therefore suitable for the measurement of all forms
of energy (heat, motion, radiation, etc.) and all energy
sources (coal, oil, gas, electricity, etc.) in order to obtain
addable figures;
- monitor all energy flows from creation to final use, showing
all intermediate operations;
- record, in addition to losses, the quantities of energy
required for all operations throughout the energy flow, in
other words show separately energy used in the extraction,
production, preparation and transformation of energy sources
-
7-- consider operations within given limits of time and space.
This means applying the principle of territoriality,
accor-ding to which operations which take place within the
geo-graphical limits of the country in question are included in
the balance-sheets irrespective of the nationality or
objec-tives of the economic agents. Any loss which occurs before
or after the frontier is crossed is thus not included in the
balance-sheet of the country under consideration.
- consider all the countries on an equal footing so that
compa-risons can be drawn internationally and an overall Community
balance-sheet compiled. This once again means identical
recording of all energy sources (without which comparisons
between two countries with different energy source structures
would be invalid)and also consistency in foreign trade (in
particular, no change in the calorific power of an energy
source when a frontier is crossed);
- obtain a set of statistics which can be computer-processed:
this requires the consistency of all the vertical and
hori-zontal lines of the balance-sheet as well as the elimination
of non-sequiturs and loops, which are often rejected by the
computer.
A balance-sheet based on these principles will make it possible
to :
a) describe the actual situation, without making any a priori
assumptions;
b) proceed from production to final use of the energy by the
final consumer, without gap, and conversely to work
back-wards as far as primary input;
c) calculate the losses for each of the possible sub-flows
throught the energy flow;
d) compare losses and efficiencies at any level and determine
the values of any substitutions;
e) present the results with a view to rational utilization of
energy;
coherence of the system and without requiring any changes
other than in presentation;
g) provide a sort of concrete economic model, thus facilitating
the observation of the effects produced by varying one or
more values.
Ill PRESENTATION
The general presentation of these balance-sheets is modelled on
that of double-entry tables. The columns show the various
sour-ces of energy by type of product. The rows show all the
opera-tions to which these sources are subjected, and thus correspond
to the balance-sheet system, which describes the energy flow.
The number of columns may vary according to the sources of energy
used in a given country, whereas the number of lines is in
prin-ciple constant and corresponds to the system adopted, which is
the same for all the countries.
The results are aggregated in the overall-balance-sheet table,
expressed in a common unit and addable in both directions. This
overall balance-sheet is supplemented by tables in specific units
relating to each source of energy, which can thus be added by
columns only.
Transformations raise a problem of presentation, because, by
definition, the products obtained are different from those fed
in. Inputs and outputs are therefore shown in different columns
of the tables and, as several products may be shown as inputs
and/or outputs, it becomes difficult to reconstruct the
trans-formation process.
The simplest solution is to draw up subsidiary transformation
balance-sheets, one for each transformer of energy. These
balance-sheets show, for each transformer, all inputs and
9
-In addition, the quantities of energy needed for the
transfor-mation process are shown incidentally (this corresponds to a
certain proportion of the consumption of the energy sector).
The transformation balance-sheets are expressed in specific
units and in a common energy unit*
The balance-sheet of the process can only be ensured and checked
and losses calculated on the basis of the energy unit (this again
means using a fully transitive unit). It thus becomes possible
to calculate percentage losses and to obtain a wide variety of
technical coefficients, which will subsequently be very useful
for the purposes of monitoring the various branches in the
ener-gy flow, together with their respective efficiencies.
Other tables derived from the overall balance-sheets are
presen-ted separately for reasons of convenience, e.g. a crossed table
showing the consumption of the energy sector and a table which
gives a detailed breakdown of final consumption. The important
thing is that all these tables fit together to form a coherent
IV BREAKDOWN BY SOURCE OF ENERGY
As the sources of energy have an1 effect on the results,
particu-larly on losses and useful energy, the breakdown must be as
complete and objective as possible*
Initially, the following breakdown is proposed:
- hard coal (including recoveries and low-grade products)
- patent fuel
- coke (hard coke, gas works coke and coke breeze)
- lignite (black lignite or brown coal)
-brown coal briquettes (including lignite coke and dried brown coal)
- tar, pitch and benzol (coking plant by-products)
- crude oil (including semi-refined petroleum)
- refinery gas
- liquefied petroleum gases (propane, butane)
- motor spirits (including aviation spirit)
- kerosines and jet fuels
- naphthas
- gas dieseloiL« 115" Redwood)
- residual fuel oils (^115lf Redwood)
- petroleum coke
- other refined petroleum products (white spirit, industrial spirits, lubricants, bitumen, waxes, paraffins, etc.)
- natural gas (including methane and sewage gas)
- coke-oven gas
- blast-furnace gas
- gasworks gas (including water gas)
- other fuels (household refuse and waste)
- heat
- electricity,
Some of these energy sources are primary sources (as found in
the natural state), others are secondary (the result of a
11
-The distinction between these two categories is shown in the
balance-sheet grid (rows). Some products may be both primary
and secondary; for example, there are natural spirits similar
to those obtained by refining crude oil* Heat can also be
pri-mary, if the source is geothermic, or secondary if steam or hot
water is recovered in a thermal power station. The breakdown
by energy source is based therefore on the nature of the product,
irrespective of its origin or use.
Other sources of energy may subsequently be added to this list,
depending'on the statistical possibilities, e.g. :
- peat
- wood and wood chips
- radioactive ores or nuclear fuel
- hydroelectric power
- geothermal power
etc.
The first four would require additional columns, whereas
geother-mal power would be included as a matter of course in the 'heat1
column. The introduction of the last three sources would mean
that all electieal energy would be considered as a secondary
source, which is in fact the case. In this study, nuclear
energy has been treated in the following way 2
- the gross production of electricity from nuclear reactors is
entered on the appropriate row relating to transformation
output ( in the electricity column)
- the heat released by nuclear fission in the reactors is
recor-ded under transformation input (heat column)
- this same quantity of heat is entered under "resources" in the
"heat11 balance-sheet either as an import or as a primary
pro-duct, depending on the origin of the uranium which has
under-gone fission and from which this energy production in the form
The heat thus entered in the balance corresponds to a quantity
of available energy obtained from the fission of uranium during
the year under consideration. The snag in this procedure is
that it disregards stock variations• Uranium which has been
transformed into electricity via heat might actually have been
produced or imported in a previous year and kept in store until
its use in a nuclear reactor. This procedure, which has the
advantage of simplicity, could be replaced by a more detailed
statistical treatment of nuclear fuels when a solution is found.
The inclusion of one of the new types of energy poses some
problems, however, namely heat pumps, which are likely to be
developed in the near future. A heat pump with a compressor
driven by an electric motor has a mechanical efficiency of 95%
for the motor and 93% for the heat-conveying fluid system, i.e.
88% overall. However, the measured useful energy produced by
the apparatus turns out to be greater than the energy input,
i.e. consumed during operation (Kelvin's paradox). The
coeffi-cient of performance is thus 200-300% (1) , the principle being
based on a transfer of calories between a cold external source
and a hot internal source (thermodynamically, the system is not
closed).
In order to take this into account, it is proposed that the heat
transferred be entered under primary production in the 'heat1
column of the balance-sheet, since it is a calorific energy
drawn from natural sources, i.e. ambient water or air.
(1) A consumption of 100 kj for operation of a heat pump gives
200-300 kj in the form of heat which can be used for
1 3
-V THE BALANCE-SHEET SYSTEM
As stated above, the aim of the balance-sheet system is to make it possible to describe energy flows by enumerating the opera-tions to which the energy sources are subjected. Before going any further, four main functions may be distinguished in this respect :
1) Extraction function : creation of the primary energy sources (drawn from nature)
2) Transformation function : physical or chemical modification of the energy sources to make them more suitable for transport or consumption
3) Distribution f-unction : movement of the energy sources in time and space in order to make them available for use (storage and
transport)
4) Utilization function : final transformation of the energy sources by the final consumer,
On the basis of these functions, the following balance-sheet system was chosen :
- primary production - imports (primary
(secondary - exports
- stocks movements * - transformation input - transformation output - exchanges and transfers - losses during distribution - bunkers
- energy sector consumption - non-energy consumption - final energy consumption
(D
(3) (3) (3)
(2)
(2)
(3) (3) (3) (4)
(4) (4) (4) energy supplied
The results must be inserted in this system according to
func-tional or technical criteria and not institufunc-tional or legal
criteria. It is the actual operation conducted on the energy
source which must serve as a guide and not the nature of the
operator. This means that any quantity of primary source energy
extracted must be entered in the f,primary production11 row, even
if this production is not the work of a professional producer.
In this way, all coking plants and electric power stations, for
example, must be considered as energy transformers (for such is
their technical function), even if the plants themselves belong
to an oil producer, a branch of the steel industry or to any other
private or public undertaking whose main activity is not energy
transformation.
In the overall balance-sheet, production from secondary sources
is entered "under transformation output. In the specific
balance-sheets, secondary production can take the place of the
first row.
Final energy consumption is broken down by major sectors
(indus-try, transport, households and equivalent) and further broken
down by types of appliance or technologies in order to facilitate
calculation of the useful energy.
A variety of intermediate totals are obviously possible, notably
working from the top to obtain "availabilities11 and from the
bottom to obtain fltotal consumption11, any difference between the
two giving the statistical difference.
Losses are shown : 1) by the difference between transformation
inputs and outputs; 2) during distribution; 3) by the
differen-ce between "energy supplied" and useful energy. In addition,
the "energy sector" row shows the energy consumed to produce
or to transform the energy. All the data relating to the energy
budget are thus available.
Transformation inputs and outputs are broken down according
to the number of transformers operating in the country in
15
-Certain rows of the balance-sheet require some explanation.
Primary production means any extraction of energy from natural
sources ; coal, gas or oil deposits, sensible heat contained
in the ground, water or air, radioactive ores, water or tidal
power, wood, wind, solar radiation.
Provisionally, and by way of exception to the definitions,
elec-trical energy of hydraulic, nuclear and geothermal origin is
regarded as primary energy. Recovered waste (e.g. household
refuse) is classed as a primary source, like coal or crude oil,
because it appears in the energy balance for the first time.
Under imports and exports all movements of energy sources across
the frontiers of the country concerned, apart from direct transit
without transformation, are to be recorded. These data refer
therefore to general trade and not to the special trade of
cus-toms statistics.
The "stocks11 row records, as far as possible, the changes in
the stocks held by producers, transformers, importers, dealers
and other agents, and consumers. "Exchanges and transfers"
record mixtures of energy sources without transformation. The
row "available for consumption" is derived from the algebraic
sum of all the above rows. It is calculated excluding
distri-bution losses in the network. It therefore gives the actual
energy made available to consumers.
"Bunkers" refers to the quantities stored on board sea-going
vessels, whatever their flag, for consumption purposes.
Air-craft tanks are included in final energy consumption. The
quan-tities of energy stored in ships1bunkers may, depending on the
point of view, be either regarded as exports or classed as
consumption.
The consumption of the energy sector covers the energy
consump-tion of producers and transformers of energy for operating their
plants; it naturally covers not only the energy produced by
Non-energy consumption eliminates from the balance sheet all
u-ses of a non-energy nature, e.g. lubrication, road surfacing
and charges for chemical synthesis, the efficiency of which is
not calculated because it is regarded as being outside the energy
budget as such. On the other hand, the energy consumption of the
chemical industry is definitely part of the final energy
consump-tion shown in the balance sheet.
The row "final consumption of energy as supplied to the final
consumer" records the energy flow before the final
transforma-tion at final consumer level. The row "final consumptransforma-tion in
terms of useful energy" records the energy obtained after the
final transformation by the final consumer.
In two cases only can there be equilibrium in practice between the
energy supplied to the final consumer and useful energy. These
relate firstly to natural heat (e.g. guothermic heat) used as
such and secondly to heat recovered in electric power stations
and supplied as such to the consumer.
This type of balance sheet system respects the basic principles
set out in chapter II.
VI UNITS OF MEASUREMENT
The specific balance-sheets of energy source are presented in
the unit of measure currently used for commercial transactions,
thus facilitating statistical returns and checking of the
vera-city of the results. Except in rare cases, this should not
in-volve any conversion calculation.
The specific balance-sheets relating to solid or liquid fuels
are thus presented in^metric tonnes, regardless of the quality
of the energy provided by the product. Electricity is recorded:
in kwh and gases should be given in m3. This is very important
from a practical point of view if accurate basic data are to be
obtained. The calculations for conversion to the common unit with a
view to constructing the overall balance-sheet can only be
car-ried out when the specific unit balance-sheet is considered
-
17-This means discontinuing basic balance-sheets expressed in tee
or tpe, which already include conversion calculations and which
are difficult to check and use (in this study it was not
possi-ble to use the coal balance-sheets expressed in tee). Conversion
to the common unit must be carried out from these sound bases.
According to the principles stated in chapter II, the common
unit of energy must be neutral, general and transitive. The
joule fulfils these conditions and also complies with'Council
Directive No 71/354/EEC of 18 October 1971.
The kilojoule ist defined as follows:
the work produced by one sthene when its point of application
moves by 1 m in the axis of the force (1 sthene : force which p
imparts to a mass of 1 t an acceleration of 1 m/sec^) (i.e. 1 joule : 1 watt/sec).
From this the following equivalents may be deduced:
kjoule
kcal
kWh
1 000 kgm
kjoule 1
4.186 3.600 9.81
kcal
0.2390 1 860 2.34
kWh 0.0002777 0.00 116
1 0.00272
1 000 kgm
0.102 0.426 367.20
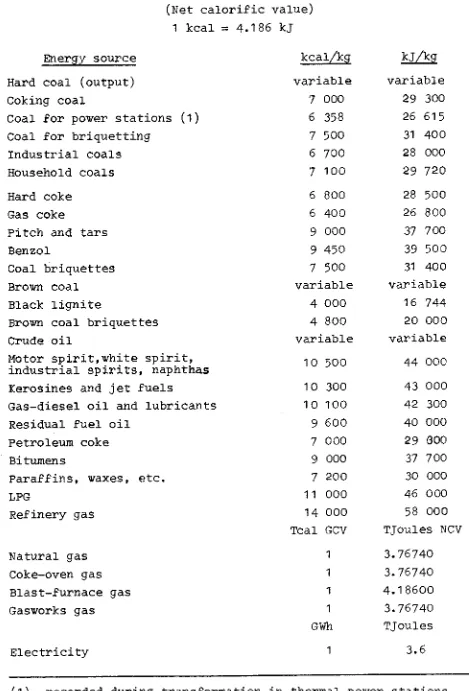
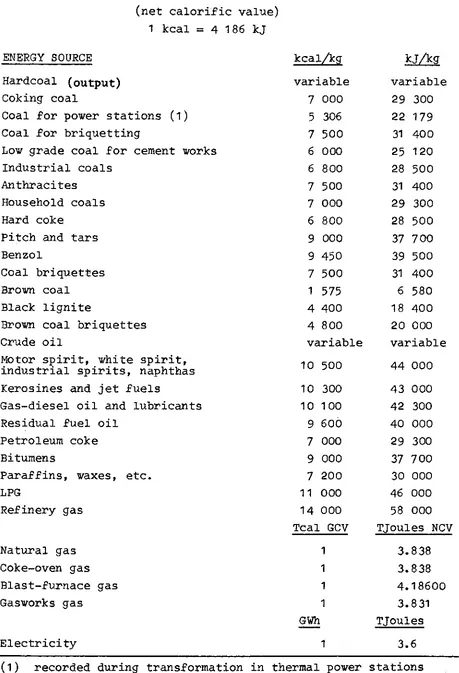
VII CONVERSION COEFFICIENTS
The foregoing shows that the coefficients of conversion from
specific units to the common unit are important for the success
of an overall energy balance-sheet. A table of conversion
coef-ficients is given in the annex* They are calculated in
accor-dance with methods which are outlined briefly below.
The starting point was the actual calorific value of each energy
source at the time of consumption, since the calorific value of
a product is only known at the time it is used, either for
trans-formation or for final consumption. Most analyses are carried
out at this stage* This procedure corresponds to the consumers
viewpoint, which is the most suitable for the purposes of useful
energy. The calorific values recorded reflect therefore the
state in which the product is delivered to the consumer.
It is never therefore a pure product but a commodity containing
water, inert matter and other impurities. This is also in line
with the way in which quantities are measured or weighed in the
basic statistics expressed in specific units.
With the same view in mind, all the conversion coefficients were
calculated on the basis of the net calorific value (NCV), which
is nearer to the energy which can actually be used than the gross
calorific value (GCV). The difference between the two may be as
much as A0%. In the case of coal, the MNCV as delivered" was
used.
Generally speaking, the products have a stable chemical
compo-sition, with a constant calorific value. On the other hand,
certain primary sources (coal, lignite, crude oil) have variable
characteristics and therefore a fluctuating calorific value.
This problem was solved in the simplest and most pragmatic way
-
I9-60 % of coal, 95 % of lignite and 100 % of crude oil are
trans-formed and the calorific value is always monitored during the
transformation operation, either on input of the raw material
or on output of the derived products.
A few additional data are therefore all that is needed to
deter-mine, by weighted average, the calorific value of the primary
sources involved* This does not require a special survey and
ensures the coherence of the balance-sheets (endogenous
varia-ble) . The calorific value of changes in stocks is determined
by the calorific value of the product normally used by the
hol-der* Thus, the calorific value of coking coal is applied to
changes in stocks held at coking plants, etc*
These methods lead, without ambiguity or difficulty, to actual
calorific values for each product and for each type of use in
the case of a primary product of variable quality, and give
conversion coefficients which ensure the coherence of the overall
balance-sheet.
VIII METHOD OF CONSTRUCTING THE BALANCE-SHEET
The balance-sheets in specific units for each energy source
constitute the starting point. These balance-sheets were
checked and considered correct, after the statistical difference
had been reduced to the minimum. In order to complete the next
stage (conversion to the common unit), subsidiary transformation
balance-sheets must first be drawn up. Approximately 80 % of the
energy used is transformed. The drawing up of transformation
balance-sheets therefore provides the essential key to the
subse-quent stages. These balance-sheets make it possible to ensure
that inputs and outputs tally, to check the calorific values and
therefore the conversion coefficients, to calculate losses and
check their accuracy, and to trace the connection between the
This work is of prime importance and points to an important
conclusion regarding methodology: an overall energy
balance-sheet should not be drawn up unless complete and accurate
trans-formation balance-sheets have been drawn up first. It is evident
that current statistical surveys are scarcely conducted along
these lines. They favour information on one source of energy
without relating it to other sources, with the result that it
is very difficult to reconstruct the transformation operations.
In future, priority should be given to returns relating to
trans-formation. Balance-sheets for final consumption cannot be drawn
up until all the transformation balance-sheets have been
comple-ted.
These balance-sheets, drawn up for each transformer, are shown
in tabular form in the annex, with appropriate explanations.
By "transformer" is meant any -undertaking which effects a
phy-sical or chemical change on an energy source before its supply
to the final consumer. Transformers are therefore
intermedia-ries in the energy flow.
Consequently, the final energy transformation which takes place
at final consumer level (coal burnt in a boiler, petrol consumed
in a motor car etc.) is not the intermediate activity of a
"transformer11. This results from the principles and general
de-finitions of the balance sheet and is compatible with the system
described in chapter V.
In order to obtain a coherent result, the following procedure is
therefore followed: specific balance-sheets - transformation
balance-sheets - overall balance-sheet in a common unit. Once
the transformation balance-sheet stage has been completed, the
rest of the work consists mainly in applying the conversion
coef-ficients, a purely arithmetical task which does not present any
difficulty.
As the conversion coefficients are based on the actual energy
content of the products as delivered to the consumer, this gives
21
-Thus, for example, the energy value of 1 t of coke is not equal
to that of 1 t of coal, the energy value of 1 t of fuel oil is
not equal to that of 1 t of crude oil, the energy value of 1 GWh
of electricity is not calculated on the basis of the calories
burnt to produce 1 GWh, etc* It is on this point that the
balance-sheet diverges from those of the primary input type,
which equated the energy value of the derived products with that
of the primary inputs.
Once the Supplied energy1 results have been obtained, the next
stage is to record operations involving the final transformation
of the energy by the final consumer, which means calculating
consumption efficiencies. This is a completely new and difficult
field requiring highly developed methods, which are presented in
the following chapters.
IX EFFICIENCY AT THE FINAL CONSUMER STAGE
Taking account of the precise but fairly restrictive definition
given for useful energy, the efficiency to be calculated and
recorded in the balance sheet will correspond to that of the
final transformation of the energy at final consumer stage.
This study is limited by choice to the energy flows and makes
no attempt to record efficiencies and losses in all the flows
of non-energy goods and services. It is clear that the
effi-ciencies and losses which occur at this later stage influence
the demand and consumption of energy. It is also clear that
energy can also be saved at this stage by improving the systems
of production, distribution and consumption of the non-energy
goods and services. This should be the subject of supplementary
studies, the results of which cannot be included in a true
ener-gy balance sheet. To cite a concrete example, this study takes
account of the efficiency and therefore the losses of heating
boilers since these are quite definitely energy appliances in
influence the demand for energy and can be reduced in order to
economize• Dwellings are not considered as energy-transforming
energy appliances. On the contrary, the dwelling is a
non-ener-gy product and service which consumes enernon-ener-gy by means of
appli-ances such as boilers, motors, electric bulbs etc., in order to
fulfil its function of housing the population.
As the objectives of the balance-sheet are economic and
statis-tical, the energy situation must always be regarded from a
practical and realistic point of view. It is not a question of
applying theoretical efficiencies but of recording actual
effi-ciencies. Having said this, the concept of efficiency is
specifi-cally linked to an fappliance1 which uses energy for a certain
purposea
It is thus the appliance which will have a certain efficiency
and from which it will be possible to measure energy inputs
and outputs. If there is no appliance, the concept of
effi-ciency becomes theoretical, abstract and devoid of economic and
statistical significance. Useful energy is thus the energy
pro-duced by an appliance, recovered by the consumer and used for
the purpose for which the appliance is designed and used.
In order to determine useful energy it is therefore necessary
to :
1) know the main appliances used by final consumers of
energy
2) discern the quantities of energy supplied to each of these
various appliances
3) know the efficiency of these appliances.
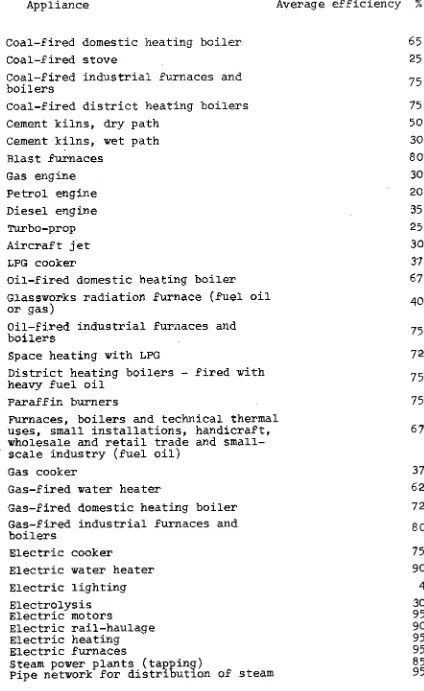
Initially, 30 or so * appliances* may give a good approximation
of the useful energy, without raising too many difficulties
-
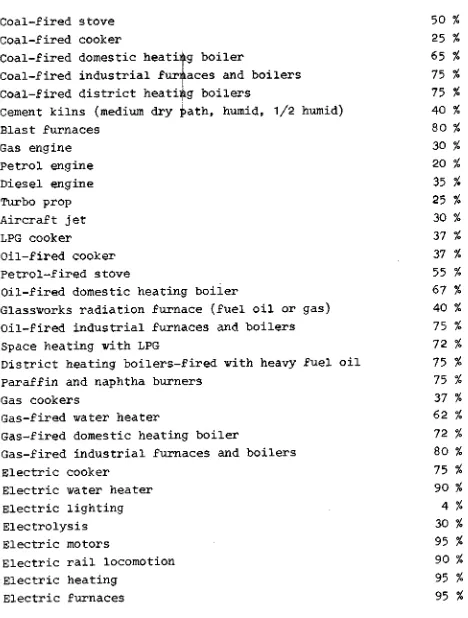
23-The efficiencies selected for these appliances are shown in a table in the annex. They are average efficiencies, valid for the whole of the range, and therefore applicable to the total figure for quantities delivered. The fact that this average ef-ficiency conceals divergencies of varying magnitude does not affect the calculation of useful energy,
These efficiencies allow for the fact that the appliances do not operate continuously at their optimum rating. They are therefore working efficiencies observed during use over a long period of
time and lower than the maximum efficiencies often indicated by manufacturers. This means that losses due to the regulation or faulty adjustment of the appliances have been taken into account.
These efficiencies are the result of studies published recently by energy technicians and engineers. Sensible heat (e,g. of smoke or ash) was included in the losses, and therefore deducted from the efficiency, even though it may be recovered, fFree heat1, as it is frequently called, was not included in useful energy. Free heat means here the heat unavoidably given off by an appli-ance not intended for heating purposes. Three examples will serve to illustrate this point. An electric bulb, the purpose of which is to provide light, also gives off calories. A cooker used for cooking food helps to heat the room. A refrigerator gives off heat in order to be able to produce cold.
It is still extremely difficult to calculate the rate of recovery of
this free heat and this may lead to many argromeaats.However, this rate of
recovery seems low, because firstly, current models are not equip-ped for recovery of this type; secondly, free heat often leads
to unintentional overheating which entails extra ventilation, which in its turn causes a drop in the efficiency of the heating system for the whole of the building; thirdly, free heat often arises at the wrong time, e.g. a refrigerator gives off more heat in summer than in winter.
To give a few examples of practical efficiency, a figure of 65%
was selected for a domestic coal-fired central-heating boiler
(small boiler without automatic adjustment of charging), the los^
ses (35%) coming from:
sensible heat of smoke and ash 10-15%
unburnt residue approx. 1%
radiation 2- 5%
pipes 8-10%
incorrect adjustment approx. 10%
A figure of 95% was chosen for an electric motor-which may appear
to be rather high-the losses coming from the magnetic field,
ventilation, heating of the coils, and friction of the moving
mechanical parts (heating of bearings).
These efficiencies lead to a calculation of the useful energy
yielded by the appliances which in no way prejudges the wastage
which may occur subsequently. The balance-sheets thus give the
results in terms of useful energy in the transport sector as it
is, although a certain amount of transportation may be
super-fluous; similarly, the balance-sheets show the useful energy of
domestic heating installations as they are used, without taking
into account the wastage due to poor insulation of the buildings,
excessive temperatures or losses via fthermal bridges1 or open
windows. Useful energy and wasteful use of energy must not the~
refore be confused. They are two problems to be studies
separate-ly. The problem of the justification of consumption or of the
quest for the optimum economic level of consumption is to a great
-
25-X BREAKDOWN OF USEFUL ENERGY
The way in which useful energy must be calculated automatically i
gives a breakdown by •appliance1, which differs from the
break-down presented in the primary input balance-sheets. This should
not be surprising since the situation is being considered from
a different point of view and a new field is being entered into.
It is an adjustment to a new situation.
In theory, useful energy can also be broken down :
- by technological procedures
- by uses
- by sectors or branches of economic activity.
These breakdowns, however, present considerable difficulties of
practical application which have not yet been solved. It was
not possible to give a breakdown by technological procedure
sin-ce this consin-cept proved difficult to define in concrete terms.
Furthermore, the procedures can be applied only to a part of
industry and the breakdown would not have been homogeneous with
transport and domestic households. Finally, the procedures
often overlap the sectors and branches of economic activity in
industry.
It was not possible to give a breakdown by use or ultimate
in-tended purpose or a breakdown by economic sector or sub-sector.
The reasons for and implications of this are outlined below.
The concept of finality in the use made of an appliance remains
too hazy and is of no help either for understanding useful
ener-gy or for the calculations. An electric motor can obviously be
used for various purposes without any change in its own
effi-ciency. To give a few examples, an electric motor can be used
to drive a machine tool (mechanical work), pull a train
(loco-motion), turn a fan (displacement of air which may be used for
refrigeration), drive a compressor (increase in the pressure of
of ammonia), make a refrigerator work (production of cold),
drive a pump which may in turn feed a burner (for heating), or
make a crusher work (with 5 % mechanical effect and 95 %
ther-mal effect). These examples show that the ultimate uses of an
appliance are many and varied, difficult to classify and
some-times inextricably interlinked.
In particular, it proves to be almost impossible to distinguish
between the apparently simple concepts of thermal use and
mecha-nical use, on account of the laws of thermodynamics. Furthermore,
there are cases where the same appliance serves several purposes
and conversely where the same job is carried out by various
appli-ances: this makes distribution calculations somewhat difficult.
As the efficiencies are linked to the appliances and the
appli-ances are scattered over various economic sectors, it is
imme-diately apparent that a breakdown by sector is difficult and
does not provide any additional information on the useful energy.
It is obvious that the efficiency of motors of the same design or
of electric bulbs remains the same whether they are installed in
a textile mill, a foodstuffs factory, public offices or a private
house. The useful energy or efficiency of an industrial sector
depends on the degree of integration of the installations and on
the often very variable proportion of machines with different
efficiencies. To take just one example, taken from the
best-known and most easily examinable sector, the efficiency of the
iron and steel sector depends on :
1) the level of integration of the various phases which
contri-bute to production : blast furnace, foundry, melting shop,
hot - or cold-rolling mills and possibly ore-sintering plant
and even power station. These last three installations are
not part of the iron and steel sector according to the
nornan-clatures currently in force, but their inclusions in the
production process will modify the overall efficiency of the
iron and steel sector. Thermodynamic systems thus do not
correspond to the economic sectors, which poses problems
2 7
-2) the proportion of the various types of equipment installed and their degree of utilization, when they have different efficiencies. A steelworks installation producing cold-rolled flats obviously has a far larger number of
high-powered electric motors than an installation which produced only non-rolled products. Since the efficiency of electric motors (95 %) is higher than that of all the other types of appliance, the former installation will have a higher useful-energy yield than the latter, although this does not neces-sarily mean greater productivity.
3) the arrangement and combination of the various energy appli-ances. This can vary in terms of the techniques and proce-dures used for manufacturing a non-energy product (e.g. steel sheet). In concrete terms, the overall efficiency of the production installations will clearly differ depending on whether the energy appliances are arranged in series or in parallel.
These observations show that the overall efficiency of the iron and steel sector is obtained from weighted averages for all combinations of installations, taking account of the degrees of utilisation; this involved complicated calculations and leads to results which are difficult to interpret. The statistical
appa-ratus is not geared to deal with such complex and detailed problems.
The useful energy calculated by appliance is thus an analytical and not a synthetic approach to the problem. But at least it constitutes a step forward and does not lead to a dead end. No breakdown of the appliances by use and by procedure has been possible*
However, it has been possible to break down the useful energy by three major consumer sectors :
- industry - transj. jrt
These three sectors correspond to the quantities delivered to
the consumer and form a sort of crossroads* From this point,
two parallel breakdowns are possible : one by sector in terms
of 'energy supplied1, the other by appliance in terms of
•useful energy1.
The limits of these three sectors tally with the definitions
currently in force. •Households and equivalent1 includes, apart
from households as such, wholesale and retail trade, crafts,
ge-neral government and private institutions, small-scale industry,
agriculture and fishing.
This grouping, which poses a difficulty for analyses by economic
sector, is paradoxically an advantage for the calculation of
use-ful energy. The appliances used in small-scale industry are
ge-nerally different in size, technology and efficiency from those
installed in large-scale industry. Their efficiencies, and
therefore the useful energy released, seem more or less on a par
with those of the appliances used in wholesale and retail trade,
crafts and households. Their classification in a single sector
therefore makes the calculations easier.
XI CALCULATION OF LOSSES AND ENERGY SECTOR
One of the advantages of a useful-energy balance-sheet is that
it shows the losses throughout the energy chain. In this
con-nection, it must first be stated that the present balance-sheet
does not take into consideration the possible rate of extraction
of primary energy in relation to the potential (or natural
re-sources) contained in the deposit. Nor does it take account of
reinjections into the deposits (crude oil and natural gas).
The starting point for the balance-sheet is gross actual
produc-tion. In the case of electricity it underestimates the losses,
-29-Despite these shortcomings, which can be remedied in future,
the recording of losses is better than in a primary input
ba-lance-sheet or even in an •energy supplied1 balance-sheet. A
few words of explanation about losses will facilitate better
interpretation and utilization of the balance-sheets.
Transfor-mation losses are, by their very nature, linked to the
transfor-mer and not to the energy sources; this may cause difficulties
if the intention is to ascribe the losses to a certain product
and to analyse a particular branch of the energy flow-chart.
The solution is to apply the appropriate percentage loss as
shown in the transformation balance-sheet so as to make it
pos-sible to deduce correctly the successive links in the chain of
transformation.
Another aspect of losses needs to be noted, namely the losses
occurring during the transportation and distribution of gas and
electricity in particular. Losses during transportation (loss
in weight, leaks, evaporation) of the other energy sources are
negligible and are not shown in the balance. However, an energy
which sustains heavy losses during transport requires
practi-cally no expenditure of energy for transport purposes, whereas
the transport of coal or oil without loss requires a certain
energy consumption. This constitutes a disparity in the
treat-ment of energy sources which ought to be corrected. To do this
properly, it would be necessary to include in the balance-sheet
energy used to transport energy, on the same basis as the energy
used to extract or transform energy. An attempted calculation
along these lines is given below in the analysis of results.
Apart from these considerations, showing the losses as such
fulfils a dual purpose :
1) to show the relationship between useful energy and waste
energy, of interest for various analyses, e.g. comparison
and substitution of different types of energy, energy
saving;
This second concern is of more recent origin. Losses occur most frequently in the form of heat unintentionally dissipated into the environment (radiation, sensible heat of smoke and exhaust gases, burning of flares, hot-water springs, etc*)*
The only exceptions to these heat losses are losses by leakage, • evaporation or loss of weight (as well as magnetic losses). In all cases, the energy lost causes pollution, either thermal or chemical. The total loss, shown in the balance-sheet as waste energy, can thus provide an indication of the pollution caused by energy consumption.
As well as losses, mention must also be made of the consumption of the energy sector, which also represents a reduction in the quantities of energy which reach the final consumer. The cros-sed table given in the annex makes it possible to ascribe either
to each energy source or to each transformer or producer of energy the energy used to produce or transform energy.
This can also play a part in the calculation of energy sub-flows and substitutions (choice between production or imports, for example). Consumption for the transport of energy should be treated, for the purposes of analysis, in the same way as the consumption of the energy sector.
XII FUTURE IMPROVEMENTS AND CONCLUSION
This study, together with a trial useful-energy balance-sheet, was drawn up on the basis of the information available, without the help of a special survey. Progress may be achieved in
future by adapting the statistical apparatus to this new objec-tive. A few guidelines can already be laid down with a view to improving the useful-energy balance-sheets.
31
-A second way of improving the balance-sheets would be to obtain more precise figures for the efficiencies of the appliances by means of technical studies. Another way would be to obtain more information on and to extend the classification of the equipment (or technologies) used in industry,
Obviously, a more detailed classification is only of interest if the efficiencies of the appliances listed differ appreciably. Still in the industrial sector, it might prove useful, for the purposes of economic analysis and forecasting, to separate con-sumption for heating premises from concon-sumption for manufacturing. The function *heating of premises1 depends on the climate, which is an exogenous random variable, independent of the manufacturing process, whereas the energy consumed for manufacturing purposes is independent of the climate but is related to industrial acti-vity (output or hours worked). This would require a number of special surveys, using the sampling method which seems most sui-table for this purpose.
Finally, and this is most important, this balance sheet must be supplemented by studies which further investigate the possibi-lities of energy economy, as indicated in chapter IX.
In order to try and clarify the situation, five topics can be considered in the analysis of energy 2
1) primary input of energy
2) transformation of energy sources
3) consumption of energy as supplied to final consumer
4) useful energy obtained by final consumer
5) energy content of the non-energy goods and services.
It is clear that possible energy savings can come from :
a) improvement of productivity in the energy sector itself,
i.e. by reducing the losses ,and own consumption of the
enBrgy producers, transformers and distributors* In other
words, maximizing the amount of energy supplied to the
final consumer on the basis of a given primary input.
b) from the best use made of the energy appliances at final
consumer level. This means trying to obtain as much useful
energy as possible.
c) from adjusting consumption methods in order to reduce the
energy required for producing, distributing and using the
non-energy goods and services. This means minimizing the
energy content of the non-energy goods and services.
The first two points above can be analyzed using the balance
sheets proposed in this study. The last point depends upon an
analysis of the specific consumption and input-output matrixes:
it therefore goes beyond the framework of the energy
balance-sheets.
One general conclusion emerges from these various guidelines:
balance-sheets of the 'energy supplied1 type constitute the
basis and kingpin of the entire statistical system relating to
energy. Indeed, the 'energy supplied1 balance sheet makes it
possible either to work back to production and primary
resour-ces and make an exact calculation of requirements in terms of
primary input, or to proceed in the direction of consumption,
as far as useful energy, or to compile studies on the
diffe-rent levels of specific consumption.
A balance-sheet of the 'energy supplied' type, possibly
supple-mented by information on useful energy and specific consumption,
constitutes the only correct basis for analyzing energy
consump-tion and thus the only platform on which to base forecast
cal-culations - for forecasts are always based on the projection of
-
33-If no historic basis expressed at 'energy supplied' level is
used, the coefficients of elasticity will be biased, as shown
by past experience in energy forecasting. Finally, it is at
the 'energy supplied' and 'useful energy' levels that valid
price comparisons can be drawn at consumer level and value
studies carried out.
XIII ANALYSIS OF RESULTS - FRANCE-GERMANY 1975
A first attempt at a balance-sheet based on the new methods was
drawn up for the Federal Republic of Germany for the year 1975.
A number of comments may be made on the results. The first
ana-lysis concerns comparison of the results between 'primary input',
•energy supplied' and 'useful-energy' balance-sheets. A table
in the annex shows the extent of the differences, both by major
consumer sector and by energy source.
Compared to the 'energy supplied' balance-sheet, the primary
input balance-sheet overestimates final energy consumption by
23 %, industrial consumption by 33 % and electricity consumption
by 165 %t and it underestmates the transport sector and
petro-leum products (this is particulary apparent in the breakdown of
consumption). The breakdown by energy source is considerably
modified by this, to the advantage of petroleum products and
the detriment of electricity. The difference between these two
types of balance-sheet stems from the losses due to
transfor-mation, distribution and consumption of the energy sector. This
explains indirectly the differences in the breakdown between
industry and transport. The energy content of deliveries to the
transport sector is greater than that of deliveries to industry
(mainly motor spirit as against residual fuel oils), whereas the
primary input balance-sheet equated the grades of products in
terms of crude oil equivalent.
The 'useful-energy' balance-sheet presents another angle by
in-cluding losses occurring during final consumption. This gives
a different picture again, depending on the efficiencies of the
It is no surprise, in view of the low efficiency of internal
combustion engines, to note the considerable reduction in useful
energy in the transport sector. On the other hand, the high
efficiencies generally observed in electric or gas appliances
increase the proportion of useful energy produced by these two
sources.
However, the excellent performance of most electric appliances
does not make up for the losses arising during transformation
in thermal power stations* This shows one of the fundamental
aspects of the German economy, to which hydro-electric power
continues to make a minimal contribution. Losses during final
consumption, expressed as the difference between the1energy
sup-plied1 and useful energy, are as follows:
solid fuels 29%
liquid fuels 44%
gas 26%
electricity 24%
Total for all sources of energy 36%
These general comparisons bring out the extent of losses
throu-ghout the energy chain from extraction (primary input) to final
consumption (useful energy). A graph shows the overall flow of
energy in 1975 in the Federal Republic of Germany. Useful energy
account for 47% and lost energy for 53% of availabilities.
The energy lost is broken down as follows:
50% during consumption
36% during transformation
13% consumption of the energy sector
1% during distribution.
A table in the annex gives a more detailed breakdown of these
losses by energy source. The main losses occur with oil and
electricity, the former because of the considerable volume
con-cerned, the latter because of the low efficiency of
transforma-tions in thermal power statransforma-tions.
-35-It shows that the more transformations of energy there are, the
greater the losses and the more the overall efficiency tends to
decrease. This highlights the advantages of natural gas, a
primary energy source, generally used without intermediate
trans-formation. More accurate determination of the losses throughout
the energy chain is thus of great importance for the purposes of
analysis. Where losses are calculated in the form of percentages,
it is possible to apply various types of "technical coefficients"
to each possible "sub-flow" in the energy flow-chart. The
per-centages of intermediate losses are taken from the subsidiary
transformation balance-sheets; consumption of the energy sector
and any losses during distribution of gas and electricity must
be added to these.
The "technical coefficients" of lost energy may be summarized as
follows :
Losses during transformation :
patent fuel plants
coking plants
brown coal briquette works
blast furnaces
thermal power stations (electricity)
power stations (heat)
nuclear reactors
oil refineries
gas works
9 % of the input
1.5 % 5 . 6 % 3 . 5 % 6 2 . 6 % 15 % 6 5 . 8 % 0 . 6 % 3 . 3 %
ft
II
If
II
fl
II
II
II
Consumptions of producers and transformers of energy :
% input % production
coal mines (with patent fuel plants)
brown coal mines (with briquetting _ works)
production of natural gas
coking plants 9,8 oil refineries 8,6
gasworks 10,8 thermal power stations 2,3
nuclear reactors 1, 8 hydroelectric power stations
2,5 1,1 4,8
13,1 (coke) 8,7
11 ,2 6,3 5,4 1,5
These specific consumptions represent the energy (either from own production or bought) used to extract or transform the energy (1). These percentages were calculated directly from the units in Joules, at fenergy supplied1 level, i.e. without going back to the primary input level (e.g. for electrical energy). Non-energy output (often unavoidable) was not inclu-ded in the losses. It leaves the energy balance-sheet at the line r,non-energy consumption". This is in line with economics, since the non-energy products are transferred to other sectors where they are used.
With the percentage losses or "technical coefficients", it is possible to construct various special sub-flows in the energy flow-chart and to observe the progressive disappearance of the energy up to final consumption. The simplest way of illustra-ting this is in the form of a graph, as given in the annex, showing a few typical examples.
For the heating of domestic and similar premises, the sub-flow-charts show that solid and liquid fuels have the same overall efficiency. The greater efficiency of oil-fired boi-lers offsets the losses or consumption of energy during refi-ning.
-
37-The high efficiency of natural-gas-fired heating is also brought:
out. On the other hand, electric heating with electricity from
thermal sources has an overall efficiency equal to half that
of solid or liquid-fuel types of heating.
As regards motive power, it does not matter, from the point of
view of the overall yields of useful energy, whether a diesel
engine or an electric motor driven by electricity of thermal
ori-gin is used. On the other hand, the sub-flow-charts bring out the
high efficiency of hydroelectricity, but this is the least
com-mon source of energy in Germany. In all cases, lighting has the
lowest efficiency but technologists have, as yet, found no
subs-titute. These sub-flow-charts confirm that transformations
reduce the overall efficiencies, since the increase in
efficien-cy during use brought about by a better developed form of energy
does not offset the losses and consumption of energy during the
transformation operation.
The volume of thermal pollution caused by the production and use
of energy can be estimated on the basis of losses. This gives
a total of the order of 4 300 000 tJoules,not including
distri-bution losses and the consumption of the energy sector. This
figure represents more than 1 million Teal, i.e.a sufficient
quantity of heat to raise the temperature of a voliime of 1QQ 000 Q O
million m°-of water by 10 C. For comparison, this figure is of
the same magnitude as the annual flow of all the surface water
collected in the Federal Republic of Germany.
Moreover, the balance-sheet also makes it possible to obtain a
breakdown of consumption by main types of appliance and by major
sector. A table in the annex gives the percentage breakdown of
consumption, in terms of both fenergy supplied1 and useful energy.
A few comments may be added to this. Lighting always plays a
secondary, even negligible, part. Its poor efficiency has
there-fore practically no effect on the energy budget as a whole. Its
role appears least negligible in the tertiary sector (street
83. 5. 4. 1 . 6.
.3% .4% .2% . 1 %
. 0%
On the other hand, space heating, at around 80% of consumption,
constitutes a major part of the households and equivalent sector,
while the transport sector is dominated to a great extent by
internal-combustion engines with 90% of 'energy supplied1
con-sumption and 80% of the useful-energy concon-sumption. In industry,
the range of appliances appears much wider, although there is a
preponderance of furnaces and boilers. The table also makes it
possible to estimate the distribution of appliances in households
as such. Out of a total of 2 990 992 tjoule ('energy supplied1)
in the sector comprising households, handicraft,
public,autho-rities, small industry, agriculture and fishing, the consumption
of households as such may be put at around 1 680 000 tJoules,as
follows:
1 400 000 tj for space heating
90 000 tj for cooking
70 000 tj for hot water
18 000 tj for lighting
102 000 tj for various electrical appliances
1 00%
These observations give a clear indication of the lines along
which future studies and research should proceed, with a view
both to energy saving and to improving the balance-sheets (better
knowledge of the equipment used in industry, for example).
A final feature of this type of balance-sheet concerns primary
input, the analysis of which can be improved by working upwards
from 'energy supplied'. On the basis of the subsidiary
balance-sheets, i.e. the various transformation losses and the
consump-tion of the energy sector, it is possible to calculate the
actual substitutions between production and imports on the one
hand and primary and secondary energy on the other. Importing
a tonne of coke is not the same as importing a tonne of coal,
nor is producing electricity by thermal means the same as
pro-ducing it from water. The various possible substitutions have
effects which may be shown by the balance-sheet. As it stands
now, the balance-sheet is a sort of practical economic model,
on the basis of which it is possible, hypothetically, to
-39-The scope of this type of calculation is vast. A fAew examples
will suffice to show its potential. What would happen if net
production of hydroelectricity were reduced by 36 000 tjoules
(a reduction of 10 000 GWh) ? As consumption would remain the
same, production of electricity from thermal sources, e.g. based
on fuel oils, would have to be increased. To obtain 36 000
tjoules of net electricity in a conventional thermal power
sta-tion requires a gross output of 38 430 tjoules. This needs a
charge of 102 600 tj, i.e. approximately 2 565 000 t of heavy
fuel oil. This results in an increase in oil refining. Thus,
to obtain 102 600 tj of a petroleum product (fuel oil) requires
an input of 103 215 tj of crude oil, allowing for losses during
refining, to which must be added the refineries1 own consumption
at 8 870 tj (8.6 % of the charge). Altogether, a decrease of
36 000 tjoules in the output of hydroelectricity requires
appro-ximately 112 000 tjoules of alternative energy. This is an
example of substitution at the primary input.
Another example entails examination of the choice between
impor-ting 1 t of coke or the primary equivalent in the form of coal.
The coking plant transformation balance shows that, in terms of
specific units 1.3 t of coal is required to produce 1 t of coke,
allowing for losses and the unavoidable production of gas, benzol,
pitch and tars. In addition, coking requires a specific
consump-tion of around 1 % of the charge. In terms of energy, the
substitution is thus as follows :
1 t of coke
gas
other by-products
losses
charge
consumption of the coking plant (T)
28 500 000 kjoules
7 220 000 w
1 710 000 M
570 000 M
38 000 000 kjoules
(= 1.3 t of coal)
380 000 kjoules
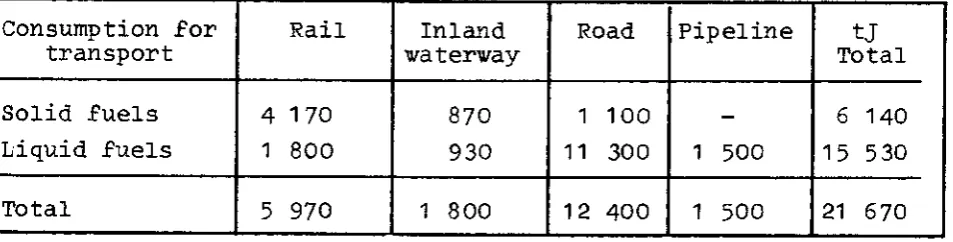
A final point to be clarified concerns the energy required for
the transportation and distribution of solid and liquid fuels•
The energy consumed for this purpose was not shown separately
in the balance-sheet but is included in the final consumption
of the transport sector. For the purposes of the energy budget
it is useful, however, to know this consumption, compared to the
consumption of the energy sector and losses during distribution
of gas and electricity. The transport statistics provide a
ba-sis for calculation (tkm of traffic and specific consumptions).
The following estimate is obtained :
Consumption for transport
Solid fuels
Liquid fuels
Total
Rail
4 170
1 800
5 970
Inland waterway
870
930
1 800 j
'• R o a d
1 100
11 300
12 400
Pipeline
1 500
1 500
tj I Total
6 140
15 530
21 670
These figures are very low, even negligible, compared to the
quantities of fuels transported either to transformers (power
stations, etc.) or to final consumers. The consumption of
ener-gy used to power the lorries, boats, wagons and pipelines may be
[image:42.589.67.544.259.380.2]estimated at 0.3 % of the quantity of energy transported. This
figure is very low in comparison with the distribution losses
for the electricity network (4*8 %).
From the useful-energy point of view it therefore appears more
economical to transport fuels in their natural state to the
points of consumption rather than to convert them on the spot
to electricity and then transport the electrical energy to the
consumers. These calculations also show that it is not
neces-sary to enter the energy required for transport in the 1
distribution losses1 line of the balance-sheet, as this has
41 -XIV ANALYSIS OF RESULTS - FRANCE 1975
A first attempt at an fenergy supplied1 and a useful-energy
balance-sheet was drawn up for France on the basis of the
re-sults for 1975. The same general conclusions may be drawn as
for Germany.
In the first place, the difference in the results obtained with
the three types of energy balance-sheet - primary input, energy
supplied and useful-energy (see table) - is very noticeable.
Compared to the fenergy supplied1 balance-sheet, the primary
input balance-sheet overestimates final energy consumption by
more than 18 %. This also has a considerable effect on the
breakdown by major consumer sector. The primary input
balance-sheet overestimates the final energy consumption of industry by
28 % and that of households by 20 %. On the other hand, it
un-derestimates that of the transport sector. The breakdown by
energy source also appears in a different light when the actual
energy content of deliveries to consumers is taken into account.
Electricity1s share is reduced by half, whereas that of all the
other energy sources is increased (very considerably in the case
of petroleum products). These differences are obviously the
re-sult of transformation and distribution losses. The fenergy
supplied1 balance-sheet gives a better picture of the energy
value which can be used by the final consumer, and forms the
essential basis for the next step, which is to determine the
useful energy produced during final transformation. The
diffe-rent efficiencies of the appliances modify the results
conside-rably. The useful energy produced in industry is far greater
than that produced in the sector comprising households,
whole-sale and retail trade, handicraft, trades and agriculture. The
useful energy produced in the transport sector appears
extreme-ly small. The different efficiencies of the appliances modify
the results by energy source to the advantage of electricity
and gas and to the detriment of petroleum products. However,