Theme 2
ISSN
1011-0844
Economy and finance
Series B
Short-term trends
eurostat
ECU-EMS INFORMATION
7
D
1988
Monthly
LIBRARY
ECU BONDS ISSUES: 10 new issues in June.
The increased issuing activity in the ECU bond market registered during the last months, continued also in
June with ten new issues (including the big Community issue announced last month) amounting to 1530 Mio.
June issues represent more than a third of the total volume of ECU bond issues during the first six months of
1988 and are indicative of the recent momentum in the eurobond market in general and of the ECU bond
market in particular.
A general improvement in the international macroeconomic and financial environment but also factors specific
to the ECU, seem to have contibuted to the said increased activity in the ECU bond sector since last March.
Better than expected real growth rates of the main world economies with inflation under control, combined
with reduced US trade deficits and a firmer dollar, constitute the main elements of this favourable
·
macroeconomic and financial enviroment. The "correction" in the world stock markets of October 1987 which
resulted in more sustainable share prices makes part of this new environment.
Among the favourable, ECU-specific, factors the following appear as being the most important:
the firm political engagement during the European Council of last February towards a unified economic and
financial area gave to the ECU a sense of stability and perspective (this engagement towards a European
Monetary Qnion was corroborated during the recent Hannover Council).
the high rating of the borrowers in the ECU bond market increased the attractiveness of the issues in a period
where a "search of quality" has gained in importance for investors.
the function of the ECU as a "natural hedger" against excessive currency movements, a property inherent to
the construction of the ECU.
To the above should be added the financial innovation and especially the currency and interest rate swaps
which increased the flexibility of the market and its potential to meet the borrowers' needs and investors'
preferences.
Contents
I.
A graph of the bilateral fluctuations of the EMS currencies.
II.
Yearly and monthly issues of ECU-bonds.
III. Interest rates on ECU deposits and yields on ECU bonds.
IV. Latest month's ECU bond issues.
[3?Lj
eurostat
OFICINA ESTADiSTICA DE LAS COMUNIDADES EUROPEAS DE EUROPA:ISKE FA:LLESSKABERS STATISTISKE KONTOR STATISTISCHES AMT DER EUROPAISCHEN GEMEINSCHAFTEN HATIHIKH YnHPEL:IA TON EYPOnAIKON KOINOTHTON STATISTICAL OFFICE OF THE EUROPEAN COMMUNITIES OFFICE STATISTIQUE DES COMMUNAUTES EUROPEENNES ISTITUTO STATISTICO DELLE COMUNITA EUROPEE
BUREAU VOOR DE STATISTIEK DER EUROPESE GEMEENSCHAPPEN SERVl<;::O DE ESTATfSTICA DAS COMUNIDADES EUROPEIAS
L-2920 Luxembourg - Tel. 43011 - Telex: Comeur Lu 3423
B-1049 Bruxelles, batiment Berlaymont, rue de la Loi 200 (bureau de liaison) - Tel. 2351111
Note
For any information on the statistics in this bulletin contact Luxembourg:
tel.: 4301-2022 D. Glatzel
4301-3519 T. Papaspyrou
4301-3288 G. Thouvenin
4301-3417 S. Ansion
© ECSC-EEC-EAEC, Brussels - Luxembourg, 1988
TABLE I
BILATERAL FLUCTUATIONS OF THE EMS CURRENCIES
1.2 ···:..::.:..:.:oKR
0.8 HFL IRL
0.4 ... ····.···.· .. · ... .
™
-0.4
-0.8
~-FBL
-1.2
-1.6
-2
LIT
02
04
06
10
13
17
19
24
26
30
01
03
07
09
13
15
17
21
23
27
29
How to read the graph
1.
The various curves should be compared in pairs. To find the differential between two currencies, subtract the (positive
or negative) values along the y-axis corresponding to each currency.
2. The graph is drawn with the curve of the strongest currency above that of the weakest It shows therefore the relative
position of each currency vis-a-vis the other currencies.
3. When two curves intersect or merge over a period of time there is no differential between the two currencies and their
market exchange rate equals their bilateral central rate.
Construction of the graph
1.
The graph is drawn within a horizontal band corresponding
tothe maximum 2,25% margin of fluctuation applying at
any given moment to market exchange rates and the bilateral central rates of the EMS currencies, with the exception of
the LIT, which has a maximum authorized fluctuation of 6%. This band is divided symmetrically by a horizontal axis
along which the points would
beplotted if all currencies were at their bilateral central rate and there were therefore no
fluctuat
i
ons.
2. The daily market exchange rates of all currencies are compared with the relevant bilateral central rates and the
differentials between the two calculated.
3. The maximum fluctuation between two currencies (with the exception of the
Lm
is shown within the band,
symmetrical with the horizontal axis. The fluctuations of the other currencies in relation to either of the two currencies
in question are shown within the maximum permissible fluctuation.
1982 1983 1984 1985 1986 1987 1987 June July August September October November December 1988 January February March April May June TOTAL 1 892 2 515
4 997 12 295 8 543
8 186
690 565 153 435 295 175 510 350 325 425 650 835 793 Total 1 772
[image:4.614.104.539.62.1001.2]1 980 3 798 8 134 5 830 5 453 450 200 100 150 75 175 250 350 200 250 450 735 320 TABLE II
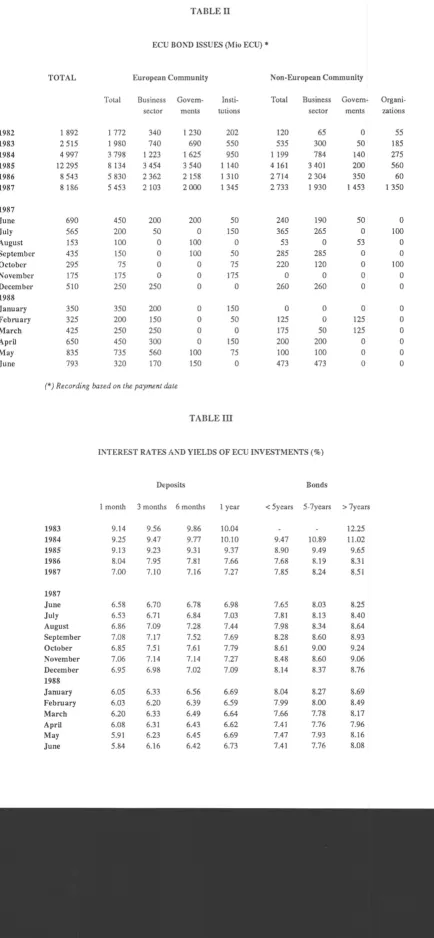
ECU BOND ISSUES (Mio ECU)
*
European Community
Business
Govern-sector 340 740 1 223 3454 2 362 2103 200 50 0 0 0 0 250 200 150 250 300 560 170 ments 1 230 690 1625
3 540 2 158
2000 200 0 100 100 0 0 0 0 0 0 0 100 150 Insti-tutions 202 550 950 1 140 1 310 1 345 50 150 0 50 75 175 0 150 50 0 150 75 0 Non-European Community
Total Business Govern-
Organi-120 535
1199
4 161 2 714 2 733 240 365 53 285 220 0 260 0 125 175 200 100 473 sector 65 300 784 3 401
2 304
1 930
190 265 0 285 120 0 260 0 0 50 200 100 473 ments 0 50 140 200 350 1 453 50 0 53 0 0 0 0 0 125 125 0 0 0 zatious 55 185 275 560 60 1 350 0 100 0 0 100 0 0
(*)Recording based on the payment date
1983 1984 1985 1986 1987 1987 June July August September October November December 1988 January February March April May June TABLE III
INTEREST RATES AND YIELDS OF ECU INVESTMENTS(%)
Deposits
1 month 3 months 6 months 1 year
9.14 9.25 9.13 8.04 7.00 6.58 6.53 6.86 7.08 6.85 7.06 6.95 6.05 6.03 6.20 6.08 5.91 5.84 9.56 9.47 9.23 7.95 7.10 6.70 6.71 7.09 7.17 7.51 7.14 6.98 6.33 6.20 6.33 6.31 6.23 6.16 9.86 9.77 9.31 7.81 7.16 6.78 6.84 7.28 7.52 7.61 7.14 7.02 6.56 6.39 6.49 6.43 6.45 6.42 10.04 10.10 9.37 7.66 7.27 6.98 7.03 7.44 7.69 7.79 7.27 7.09 6.69 6.59 6.64 6.62 6.69 6.73 Bonds
< 5years 5-7years >?years
Issue Pa_ymenl
Date
02/06/88 06/07/88
02/06/88 24/06/88
06/06/88 27/06/88
08/06/88 12/07/88
08/06/88 07/07/88
17/06/88 13/07/88
22/06/88 06/07/88
24/06/88 04/08/88
24/06/88 22/07/88
28/06/88 29/07/88
Borrower (country)
WORLD
BANK
Oiase Manhattan
(U.S.A.)
Credit Foncier de France (FRANCE)
Credit National (FRANCE)
E.C.S.C. E.C.C.
Cltoh (JAPAN)
Swedish Export K.redit (SWEDEN)
Pepsico Inc. (U.S.A.)
Credit Local de France (FRANCE)
Cie Generale d 'Electricite (FRANCE)
Issued (MioECU)
100
60
70
150
500
100
50
100
150
250
Listing: LX =Luxembourg
Issue Price
100.375
100.000
101.875
101.375
101.750
100.000
101.375
101.575
100.500
100.000
TABLE IV
LAST MONTH ECU BONDS ISSUES
Coupon Term Maturity (years)
7 3/8 5 06/07/93
7 3/8 5 24/07/93
7 5/8 6 14/04/94
71/4 3 12/07/91
7 5/8 6 07/07/94
3 1/4 5 13/07/93
7 3/8 4 21/04/92
7 3/8 4 04/10/92
7 5/8 4 12/10/92
5 1/2 8 29/07/96
Yields %
Lead Manager
Listing
7.04 Bank of Tokyo LX
K.reditbank LX
7.21 Nikko LX Sec.
6.73 Paribas LX
7.26 Deutsche Bank LX
Nippon Kangyo LX Kakurnaru
6.97 Merril Lynch LX Cap. Markt
6.91 Morgan Stanley LX Inc.
7.19 Paribas LX
Ste Generale LX
Notice
Swap
Swap
Swap
Swap
Swap Equity Warrants
Swap
Swap
Swap
B
DK
DELL
E F IRL IL
NL
p UKEUR 12
EMS
BDK
D ELL E F IRL LNL
p UKEUR 12
EMS
EUR 12
EMS
EUR 12
EMS
1960 1970
36.5 49.l
22.0 39.2 46.7 61.0
21.4 26.3 13.4 24.1
26.6 39.9 17.5 27.8
18.4 27.1 40.8 52.6
32.3 48.9 11.7 18.2 18.6 27.7
27.0
32.4 39.0
44.7
61-70 71-80
3.0 7.4 6.0 9.8 2.7 5.1 2.1 14.5 6.1 15.4
4.1 9.7 4.8 13.7 4.0 14.1
2.6 6.7 4.2 7.4 4.5 18.7
4.1 13.8
3.7 9.9
3.3 8.4
0.8 1.0 1.7 1.2 3.5 4.0 4.8 3.3
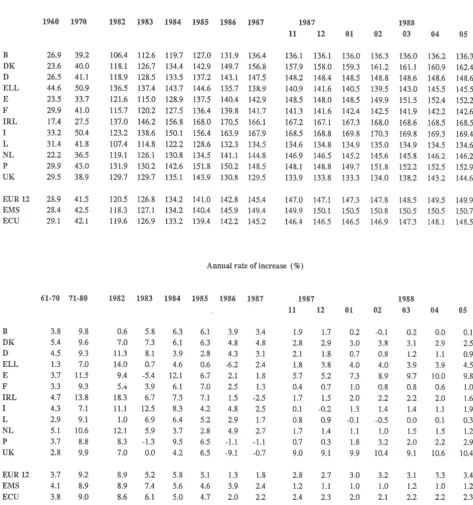
TABLE V
CONSUMER PRICE INDICES IN NATIONAL CURRENCY
1980=100
1982 1983 1984 1985 1986 1987
117.0 126.0 134.0 140.5 142.3 144.5
123.0 131.5 139.8 146.4 151.7 157.8 111.9 115.6 118.4 121.0 120.7 121.0 150.6 181.1 214.5 255.9 314.8 366.3
131.1 147.0 163.5 178.0 193.6 203.8
126.6 138.6 149.2 157.9 161.9 167.2 141.l 155.8 169.2 178.4 185.2 191.0
137.2 157.3 174.3 190.3 201.4 21 l.0 118.2 128.4 136.7 142.3 142.7 142.6 112.8 115.9 119.6 122.3 122.7 122.5
147.3 184.3 237.5 284.1 317.6 347.2 121.5 127.1 133.4 141.5 146.4 152.4
124.2 134.8 144.8 153.7 159.2 164.3
123.0 133.3 142.2 149.9 153.9 158.0
1987
11 12 01 02
1988
03 04 05
144.7 144.7 144.6 145.0 145.1 145.7 145.9
160.5 160.6 161.4 162.6 163.2 163.8 165.4 121.1 121.3 121.5 121.8 121.9 122.2 122.4
386.1 390.9 390.3 388.5 400.3 408.4 409.4 206.8 207.6 208.8 209.5 211.0 210.2 210.1 168.7 192.0 168.8 191.9 169.1 191.9 169.4 193.2 169.9 193.3 170.7 193.3 171.0 193.3
215.4 216.0 217.0 217.5 218.4 219.5 220.2 142.9 143.3 143.4 143.6 143.9 143.8 144.0
123.5 123.2 122.2 122.3 122.7 123.3 123.4 355.6 360.7 364.3 368.7 371.2 372.4 373.5 154.7 154.5 154.5 155. i 155.7 158.2 158.9
165.1
159.7 165.2
159.8 165.5
160.2
166.1 166.7
160.5 161.0 167.6
161.3
168.0 161.6
Annual rate of increase(%)
1982 1983 1984 1985 1986 1987 1987
8.7 7.7 6.3 10.1 6.9 6.3 5.3 3.3 2.4 20.9 20.5 18.3 14.4 12.l 11.2
11.8 9.6 7.3 17.2 10.4 8.6
16.5 14.7 10.8 9.3 8.6 6.5
5.7 2.7 3.2
22.7 25.1 28.9
8.6 4.6 5.0
10.8 8.5 7.4
10.4 8.4 6.7
3.9 4.0
5.5
5.2 4.2
3.9
5.8 5.7 3.3 2.8 5.0 4.2
4.9 1.3 4.7 3.6 2.2 -0.2
19.4 23.1 8.9 8.8 5.9 2.7 5.4 3.8
9.2 5.8 4.1 0.3 2.3 0.3 19.6 11.8
6.1 3.4
6.1 3.6
5.4 2.7
1.6 4.0
0.3 16.1 5.3 3.0 3.1 4.8 -0.l -0.2 9.4 4.2 3.2 2.7 11 1.5 4.0 1.0 15.3 4.7 3.2 3.1 5.5 0.3 0.2 9.3 4.1 3.4 3.1
A vcrage deviation around the mean
2.4 2.3 2.7 2.0 1.9 1.7 1.8 1.7 12 1.4 4.1 1.0 15.7 4.7 3.1 3.1 5.3 0.7 0.2 8.9 3.7 3.3 3.0 1.6 1.5
A vcrage deviation vis-a-vis the minimum
4.0 3.2 3.8 2.9 3.4 2.8 3.2 3.0 3.1 2.8 01 0.9 4.4 0.7 14.3 4.4 2.4 1.2 5.2 0.6 0.7 9.7 3.3 3.0 2.7 1.7 1.6 2.4 2.1 02 1.0 5.2 0.9 13.4 4.4 2.4 1.9 4.9 0.6 0.6 8.9 3.3
3.0 2.7 1.6 1.5 2.4 2.1 1988 03 1.0 4.7 1.0 13.2 4.5 2.5 1.9 5.0 0.8 0.7 8.2 3.5 2.4 2.8 1.6 1.5 1.7 2.1 04 1.0 4.7 1.0 13.0 3.9 2.5 2.0 5.1 1.0 0.8 7.9
B
DK
D
ELL
E F
IRL
I
L
NL
p
UK
EUR12 EMS ECU
B
DK
D
ELL
E F IRL
L
NL
p
UK
EUR 12 EMS ECU
1960 1970
26.9 39.2 23.6 40.0 26.5 41.l 44.6 50.9 23.5 33.7 29.9 41.0 17.4 27.5 33.2 50.4 31.4 41.8 22.2 36.5 29.9 43.0 29.5 38.9 28.9 41.5 28.4 42.5 29.1 42.1
61-70 71-80
[image:7.614.65.538.146.651.2]3.8 9.8 5.4 9.6 4.5 9.3 1.3 7.0 3.7 11.5 3.3 9.3 4.7 13.8 4.3 7.1 2.9 9.1 5.1 10.6 3.7 8.8 2.8 9.9 3.7 9.2 4.1 8.9 3.8 9.0
TABLE VI
CONSUMER PRICE INDICES IN ECU
1980:100
1982 1983 1984 1985 1986 1987
106.4 112.6 119.7 127.0 131.9 136.4 118.1 126.7 134.4 142.9 149.7 156.8 118.9 128.5 133.5 137.2 143.1 147.5 136.5 137.4 143.7 144.6 135.7 138.9 121.6 115.0 128.9 137.5 140.4 142.9 115.7 120.2 127.5 136.4 139.8 141.7 137.0 146.2 156.8 168.0 170.5 166.1 123.2 138.6 150.1 156.4 163.9 167.9 107.4 114.8 122.2 128.6 132.3 134.5 119.1 126.1 130.8 134.5 141.1 144.8 131.9 130.2 142.6 151.8 150.2 148.5 129.7 129.7 135.1 143.9 130.8 129.5 120.5 126.8 134.2 141.0 142.8 145.4 118.3 127.1 134.2 140.4 145.9 149.4 119.6 126.9 133.2 139.4 142.2 145.2
1987 1988
11 12 01 02 03 04 05
136.1 136.1 136.0 136.3 136.0 136.2 136.3 157.9 158.0 159.3 161.2 161.1 160.9 162.4 148.2 148.4 148.5 148.8 148.6 148.6 148.6 140.9 141.6 140.5 139.5 143.0 145.5 145.5 148.5 148.0 148.5 149.9 151.5 152.4 152.2 141.3 141.6 142.4 142.5 141.9 142.2 142.6 167.2 167.l 167.3 168.0 168.6 168.5 168.5 168.5 168.8 169.8 170.3 169.8 169.3 169.4 134.6 134.8 134.9 135.0 134.9 134.5 134.6 146.9 146.5 145.2 145.6 145.8 146.2 146.2 148.1 148.8 149.7 151.8 152.2 152.5 152.9 133.9 133.8 133.3 134.0 138.2 143.2 144.6 147.0 147.1 147.3 147.8 148.5 149.5 149.9 149.9 150.1 150.5 150.8 150.5 150.5 150.7 146.4 146.5 146.5 146.9 147.3 148.1 148.5
Annual rate of increase ( % )
1982 1983 1984 1985 1986 1987 1987 1988
11 12 01 02 03 04 05
0.6 5.8 6.3 6.1 3.9 3.4 1.9 1.7 0.2 -0.1 0.2 0.0 0.1 7.0 7.3 6.1 6.3 4.8 4.8 2.8 2.9 3.0 3.8 3.1 2.9 2.5 11.3 8.1 3.9 2.8 4.3 3.1 2.1 1.8 0.7 0.8 1.2 1.1 0.9 14.0 0.7 4.6 0.6 -6.2 2.4 1.8 3.8 4.0 4.0 3.9 3.9 4.5 9.4 -5.4 12.1 6.7 2.1 1.8 5~ 52 7.3 89 9.7 10.0 9.8
5A 3.9 6.1 7.0 2.5 1.3 0.4 0.7 1.0 0.8 0.8 0.6 1.0
18.3 6.7 7.3 7.1 1.5 -2.5 1.7 1.5 2.0 2.2 2.2 2.0 l.6
TABLEVIl
ECU EXCHANGE RATES
B/LFR DM HFL DKR FF LIT IRL
UKL
DRAPTA
ESCUSD
YENYearly averages
1980 40.5979 2.52421 2.76027 7.82736 5.86895 1189.21 0.675997 0.598488 59.323 99.702 69.552 1.392330 315.044
1981 41.2946 2.51390 2.77510 7.92255 6.03992 1263.18 0.691021 0.553110 61.624 102.676 68.495 1.116450 245.379
1982 44.7115 2.37599 2.61390 8.15687 6.43117 1323.78 0.689605 0.560454 65.342 107.558 78.007 0.979710 243.545
1983 45.4380 2.27052 2.53720 8.13188 6.77078 1349.92 0.714956 0.587014 78.088 127.503 98.689 0.890220 211.354
1984 45.4420 2.23811 2.52334 8.14647 6.87165 1381.38 0.725942 0.590626 88.340 126.569 115.680 0.789030 187.089
1985 44.9136 2.22632 2.51101 8.01876 6.79502 1447.99 0.715167 0.588977 105.739 129.165 130.252 0.763090 180.559
1986 43.7978 2.12819 2.40089 7.93565 6.79976 1461.87 0.733526 0.671542 137.425 137.456 147.088 0.984170 164.997
1987 43.0576 2.07219 2.33554 7.88139 6.92139 1490.69 0.774616 0.706526 155.451 142.119 162.003 1.145876 166.811
Monthly averages
87/06 43.0146 2.07477 2.33711 7.81273 6.92874 1501.44 0.774584 0.700039 155.393 144.062 161.936 1.140930 164.875
87/07 43.0534 2.07626 2.33783 7.87767 6.91271 1502.80 0.774874 0.698384 156.444 142.602 162.355 1.123840 168.901
87/08 43.0611 2.07348 2.33586 7.95023 6.92144 1501.98 0.775117 0.698723 157.210 140.209 162.574 1.116418 164.711
87/09 43.0897 2.07474 2.33528 7.99240 6.92753 1499.73 0.775882 0.696019 158.519 138.852 163.519 1.144620 163.887
87/10 43.2081 2.07502 2.33506 7.97168 6.93368 1500.35 0.774812 0.693330 159.839 136.594 164.407 1.151836 164.990
87/11 43.1654 2.06273 2.32143 7.95899 7.00652 1520.00 0.776040 0.690998 162.301 138.783 166.949 1.227408 165.984
87/12 43.1814 2.06351 2.32193 7.95511 6.99592 1520.66 0.776453 0.691061 163.507 139.825 168.523 1.263718 162.033
88/01 43.1875 2.06544 2.32084 7.93137 6.97147 1518.96 0.777322 0.693743 164.621 140.242 168.861 1.250105 159.425
88/02 43.1964 2.06569 2.31942 7.89605 6.97891 1521.14 0.776031 0.692657 165.021 139.293 168.802 1.216868 157.260
88/03 43.3184 2.07067 2.32565 7.92892 7.02774 1531.89 0.775096 0.674299 165.849 138.806 169.534 1.234324 156.932
88/04 43.4379 2.07588 2.32885 7.96902 7.04638 1541.71 0.777073 0.661370 166.255 137.513 169.730 1.240661 155.145
88/05 43.4419 2.07994 2.33047 7.96536 7.04184 1545.69 0.778260 0.657166 166.741 137.590 169.847 1.228336 153.210
88/06 43.4527 2.07709 2.33513 7.89805 7.00860 1542.35 0.774772 0.664982 166.195 137.350 169.550 1.184238 150.680
Daily rates: June
06/01 43.4535 2.07935 2.33012 7.92342 7.02453 1546.89 0.777399 0.660239 165.870 137.581 169.646 1.207380 151.043
06/02 43.4121 2.07619 2.32992 7.91031 7.01991 1545.44 0.776216 0.664714 165.735 137.132 169.374 1.200810 151.422
06/03 43.3790 2.07413 2.32891 7.89694 7.01583 1542.10 0.775755 0.668827 165.866 137.069 169.734 1.202890 151.347
06/06 43.3807 2.07429 2.32911 7.89929 7.01155 1541.65 0.775148 0.669270 166.218 137.061 169.818 1.205350 152.321
06/07 43.3951 2.07478 2.32983 7.90515 7.01321 1542.16 0.775571 0.667983 166.399 137.055 169.939 1.211050 152.169
06/08 43.4232 2.07758 2.33168 7.90200 7.01465 1542.51 0.776306 0.664601 166.345 137.133 169.877 1.210570 151.563
06/09 43.4314 2.07744 2.33231 7.89645 7.00767 1542.97 0.776103 0.665360 166.533 137.209 169.900 1.206760 151.026
06/10 43.4311 2.07710 2.33217 7.90251 7.01357 1544.34 0.775981 0.664420 166.371 137.272 169.891 1.209440 150.999
06/13 43.4621 2.07852 2.33312 7.89837 7.02117 1544.97 0.776828 0.661508 166.390 137.279 169.896 1.204940 150.858
06/14 43.4501 2.07866 2.33333 7.89341 7.01383 1543.93 0.776669 0.662866 166.273 137.198 169.715 1.202440 150.726
06/15 43.4335 2.07811 2.33342 7.88075 7.00597 1542.74 0.776088 0.665144 166.268 137.211 169.560 1.186950 149.912
06/16 43.4525 2.07689 2.33298 7.90571 7.01143 1543.72 0.775390 0.664540 166.861 137.230 169.652 1.189990 149.784
06/17 43.4405 2.07737 2.33428 7.90656 7.00593 1541.91 0.774584 0.665377 166.355 137.227 169.545 1.185040 149.078
06/20 43.4920 2.07793 2.33781 7.90161 7.00774 1542.08 0.773261 0.663457 166.249 137.183 169.436 1.183940 149.354
06/21 43.5010 2.07832 2.33783 7.90120 7.01114 1542.39 0.773435 0.662456 166.387 137.289 169.516 1.182810 149.508
06/22 43.5323 2.07984 2.34143 7.90526 7.00493 1541.99 0.773685 0.661066 165.578 137.670 169.375 1.173060 150.738
06/23 43.5203 2.07889 2.34160 7.90443 7.00319 1542.15 0.773333 0.662064 166.021 137.428 169.176 1.161390 149.587
06/24 43.5071 2.07862 2.34218 7.90392 6.99645 1540.85 0.773671 0.663508 166.262 137.452 169.456 1.157490 150.242
06/27 43.4442 2.07517 2.33861 7.87577 6.99329 1537.37 0.771860 0.670094 165.902 137.237 168.959 1.137950 149.243
06/28 43.4627 2.07514 2.33949 7.87747 6.99611 1539.93 0.772381 0.668516 165.781 137.374 169.222 1.152860 150.448
06/29 43.4814 2.07645 2.34244 7.88578 6.99838 1539.79 0.772935 0.665976 166.202 137.723 169.083 1.139150 151.393
EXPLANATORY NOTES
ECU exchange rates.
The exchange rates for the ECU against the national currencies of the Member States of the Community, the United
States (USD) and Japan (YEN) are shown as monthly averages and daily rates for the latest available month.
The ECU basket, dating from 17 September 1984, is currently made up as follows:
DM FF HFL BfR LFR LIT DKR IRL UKL
*
DRA*
1 ECU = 0,719 + 1,31 + 0,256 + 3,71 + 0,14 + 140 + 0,219 + 0,00871 + 0,0878 + 1,15
ECU central rates since 12 January 1987
DM FF HFL B/LFR LIT DKR IRL UKL
*
DRA*
2,05853 6,90403 2,31943 42,4582 1483,58 7,85212 0,768411 0,739615 150,792
Weights of currencies in the ECU basket (based on new central rates from 12 January 1987), in%.
DM FF HFL B/LfR LIT DKR IRL UKL
*
DRA*
100 = 34,93 18,97 11,04 9,07 9,44 2,79 1,13 11,87 0,76
*
= Does not participate in the exchange rate mechanismConsumer price indices in national currency
The consumer price indices in the national currency of each country measure changes in the purchasing power of one unit
of national currency spent in the country concerned.
Two composite indices are calculated, covering all the Member States of the Community (EUR 12) and the eight Member
States with currencies participating in the European Monetary System exchange rate mechanism (EMS).
These indices are calculated as weighted arithmetic means (chain indices) of the national indices, the weighting for each
Member State being its relative share in the final consumption of households of the group of countries in question (EUR
12, EMS), expressed in purchasing power standards, at current prices and purchasing power parities.
At the foot of the table, the average weighted fluctuations around the mean and the minimum are given for the same
groups of countries, with the same weightings. (These are calculated as weighted averages of the absolute fluctuations
in
relation to the mean and the minimum respectively). They show the degree to which price movements in the Member
States in the Community converge.
Consumer price indices in ECU
For each country the index of consumer prices in ECU is calculated by dividing the national consumer price index by the
average movement of the national currency in relation to the ECU during the month. It measures the change in the
purchasing power of one ECU in the country concerned.
Three composite indices are calculated, covering all the Member States of the Community (EUR 12), the eight Member
States participating in the European Monetary System exchange rate mechanism (EMS) and the ten Member States whose
currencies go to make up the ECU (ECU). These indices are calculated as weighted arithmetic means (chain indices) of
the consumer price indices expressed in ECU as mentioned above.
The weightings are defined as follows:
. for the EUR 12 and EMS indices, the relative share of each Member State in
the final consumption of households
for the group of countries in question (EUR 12 or EMS), expressed in ECU at current prices and exchange rates
(annual weighting) .
ECU bond issues
All ECU-denominated bond issues, both national and international, are covered, together with ECU issues offering the
option of conversion into other currencies. Main source: International Financing Review
Table II shows, under the headings:
_ Business sector and Governments: national issuers, both private and public.
_ Institutions: the European Investment Bank and the Commission of the European Communities (EEC, ECSC,
Euratom).
_ Organizations: the specialist institutions of the United Nations, the World Bank, the Council of Europe, etc ...
The issues are recorded as at the payment date.
Interest rates and yields on ECU investments
The interest rates for 1, 3 and 6 month and 1 year deposits are calculated on the basis of the Friday London market rates
(source: Financial Times).
The bonds are classified according to three types of terms: under 5 years, from 5 to 7 years and more than 7 years. The
redemption yields of ECU bonds are calculated each Wednesday from a sample of fixed interest bonds, denominated in
ECU and listed on the Luxemburg Stock Exchange. These yields are weighted by amounts in circulation. (source:
Luxemburg Stock Exchange).
Venta
y
suscripciones · Salg og abonnement • Verkauf und Abonnement · nwAr;ottc; Kat ouvOpoµtc;
Sales and subscriptions · Vente et abonnements · Vendita e abbonamenti
Verkoop en abonnementen · Venda e assinaturns
BELGIQUE I BELGIE
Moniteur beige / Belgisch Staatsblad
Rue de Lowain 4042 I Lewerisestraat 4042
1000 Bruxelles I 1000 Brussel
Tel. 512 00 26
CCP / Postrekening 000-2005502-27
Sous-depots I Agentschappen:
Librairie europeenne / Europese Boekhandel
Rue de la Loi 244 / Wetstraat 244
1040 Bruxelles I 1040 Brussel
CREDOC
Rue de la Montagne 34 I Bergstraat 34
Bte 11 I Bus 11
1000 Bruxelles I 1000 Brussel
DANMARK
Schultz EF-publikationer
M0ntergade 19 1116 K0benhavn K Tlf (01) 14 11 95
T elecopier (01) 32 75 11
BR DEUTSCHLAND
Bundesanzeiger Verlag Bre1te StraP..e
Postfach 10 80 06 5000 Kain 1 Tel. (02 21) 20 29-0
Fernschreiber ANZEIGER BONN 8 882 595
Telecopierer: 20 29.278
GREECE
G.C. Eleftheroudakis SA International Bookstore 4 Nikis Street
105 63 Athens
Tel. 322 22 55 Telex 219410 ELEF
Sub-agent for Northern Greece
Molho's Bookstore The Business Bookshop 10 Ts1m1sk1 Street Thessaloniki Tel. 275 271 Telex 412885 LIMO
ESPANA
Boletin Oficial del Estado Trafalgar 27
28010 Madrid
Tel. (91) 446 60 00
Mundi-Prensa Libros, S.A.
Castello 37 28001 Madrid
Tel. (91) 431 33 99 (Libros)
431 32 22 (Suscripciones)
435 36 37 (Direcci6n)
Telex 49370-MPLl-E
FRANCE
Journal officiel
Service des publications des Communautes europeennes 26, rue Desaix
75727 Paris Cedex 15
Tel. (1) 45 78 61 39
IRELAND
Government Publications Sales Office
Sun Alliance House Molesworth Street Dublin 2
Tel. 710309
or by post
Government Stationery Off ice
EEC Section 6th floor Bishop Street Dublin 8
Tel. 78 16 66
ITALIA
Licosa Spa
Via Lamarmora. 45
Casella postale 552 50 121 Firenze Tel. 57 97 51
Telex 5 70466 LICOSA I
CCP 343 509
Subagent1
Libreria scientifica Lucio de Biasio -AEIOU
Via Merav1gli. 16
20 123 Mil<mo
Tel 80 76 79
Herder Editrice e Libreria
Piazza Montec1tor10, 117-120
00 186 Roma
Tel 67 94 628/67 95 304
Libreria giuridica Via 120ttobre. 172/R
16 121 Genova
Tel 59 56 93
GRAND-DUCHE DE LUXEMBOURG
et autres pays I and other countries
Office des publications officielles des Communautes europeennes
2. rue Mercier L-2985 Luxembourg Tel. 49 92 81
Telex PUBOF LU 1324 b
CCP 19190-81
CC bancaire BIL 8-109/6003/200
Sogenal 61-490226-96-26
Abonnements I Subscriptions
Messageries Paul Kraus
11, rue Christophe Plantin
L-2339 Luxembourg Tel. 49 98 881
Telex 2515 CCP 49242-63
NEDERLAND
Staatsdrukkerij- en uitgeverijbedrijf Christottel Plantijnstraat
Postbus 20014
2500 EA ·s-Gravenhage
Tel. (070) 78 98 80 (bestellingen)
PORTUGAL
lmprensa Nacional Casa da Moeda, E. P.
Rua D Francisco Manuel de Melo, 5
1092 Lisboa Codex Tel. 69 34 14 Telex 15328 INCM
Distribuidora Livros Bertrand Lda.
Grupo Bertrand, SARL Rua das Terras dos Vales, 4-A Apart 37
2700 Amadora CODEX
Tel. 493 90 50 -494 87 88
Telex 15798 BERDIS
UNITED KINGDOM
HMSO Books (PC 16) HMSO Publications Centre
51 ·Nine Elms Lane
London SW8 5DR
Tel. (01) 211 77 02
Sub-agent
Alan Armstrong & Associates Ltd
Arkwright Road
Reading, Berks RG2 OSO
Tel. (0734) 75 17 69
Telex 849937 AAALTD G
TURKIYE
Dunya super veb ofset A.~.
Narilbahc;;e Sokak No 15
Cagaloglu
Istanbul
Tel 512 01 90
Telex 23822 dsvo-tr
UNITED STATES OF AMERICA
European Community Information Service
2100 M Street. NW
Suite 707
Washington. DC 20037 Tel (202) 862 9500
- -- -··- - - -- - -
-CANADA
Renouf Publishing Co., Ltd 61 Sparks Street
Ottawa
Ontario K 1P 5R1
Tel. Toll Free 1 (800) 267 4164
Ottawa Region (613) 238 8985-6
Telex 053-4936
JAPAN
Kinokuniya Company Ltd
17- 7 Shin1uku 3-Chome Shiniuku-ku
Tokyo 160-91 Tel (03) 354 0131
Journal Department PO Box 55 Chitose Tokyo 156
Price (excluding VAT) in Luxembourg
ECU BFR IRL
Single copy 4 175 3, 10
Subscription 35 1 500 27
• • • OFICINA DE PUBLICACIONES OFICIALES DE LAS COMUNIDADES EUROPEAS
·.
·
ot>:
~~~TF~RREl~~~lg~EE~:~6~~SNKAi~~L~~~~A~
EE~
~S
~6
1~
iT~~~:~~L~~~i~
0s~~~FTrn
YnHPEl:IA EnlLHMON EKt.OLEON TON EYPOnAIKON KOINOTHTON
OFFICE FOR OFFICIAL PUBLICATIONS OF THE EUROPEAN COMMUNITIES
OFFICE DES PUBLICATIONS OFFICIELLES DES COMMUNAUTES EUROPEENNES
UFFICIO DELLE PUBBLICAZIONI UFFICIALI DELLE COMUNITA EUROPEE
BUREAU VOOR OFFICIELE PUBLIKATIES DER EUROPESE GEMEENSCHAPPEN
SERVICO DAS PUBLICA<;:OES OFICIAIS DAS COMUNIDADES EIJROPEIAS
I
UKL USD2.80 4.80
24.70 41.50