This is a repository copy of
Characterization of Ordering in A-Site Deficient Perovskite
Ca1-xLa2x/3TiO3 Using STEM/EELS
.
White Rose Research Online URL for this paper:
http://eprints.whiterose.ac.uk/125391/
Version: Published Version
Article:
Danaie, Mohsen, Kepaptsoglou, Demie orcid.org/0000-0003-0499-0470, Ramasse,
Quentin M et al. (7 more authors) (2016) Characterization of Ordering in A-Site Deficient
Perovskite Ca1-xLa2x/3TiO3 Using STEM/EELS. Inorganic Chemistry. pp. 9937-9948.
ISSN 0020-1669
https://doi.org/10.1021/acs.inorgchem.6b02087
[email protected] https://eprints.whiterose.ac.uk/ Reuse
This article is distributed under the terms of the Creative Commons Attribution (CC BY) licence. This licence allows you to distribute, remix, tweak, and build upon the work, even commercially, as long as you credit the authors for the original work. More information and the full terms of the licence here:
https://creativecommons.org/licenses/
Takedown
If you consider content in White Rose Research Online to be in breach of UK law, please notify us by
Characterization of Ordering in A
‑
Site De
fi
cient Perovskite
Ca
1
−
x
La
2
x
/3
TiO
3
Using STEM/EELS
Mohsen Danaie,
*
,†Demie Kepaptsoglou,
‡Quentin M. Ramasse,
‡Colin Ophus,
§Karl R. Whittle,
∥,⊥Sebastian M. Lawson,
∥Stella Pedrazzini,
†Neil P. Young,
†Paul A. J. Bagot,
†and Philip D. Edmondson
#†
University of Oxford, Department of Materials, Parks Road, Oxford OX1 3PH, U.K.
‡
SuperSTEM Laboratory, SciTech Daresbury Campus, Keckwick Ln, Warrington WA4 4AD, U.K.
§
National Center for Electron Microscopy, Molecular Foundry, Lawrence Berkeley National Laboratory, 67 Cyclotron Road, Berkeley, California 94720, United States
∥
University of Sheffield, Department of Materials Science & Engineering, Immobilisation Science Laboratory, Mappin Street, Sheffield
S1 3JD, U.K. ⊥
School of Engineering, University of Liverpool, Brownlow Hill, Liverpool L69 3GH, U.K.
#
Materials Science & Technology Division, Oak Ridge National Laboratory, 1 Bethel Valley Road, Oak Ridge, Tennessee 37831, United States
*
S Supporting InformationABSTRACT: The vacancy ordering behavior of an A-site deficient perovskite system, Ca
1−xLa2x/3TiO3, was studied
using atomic resolution scanning transmission electron microscopy (STEM) in conjunction with electron energy-loss spectroscopy (EELS), with the aim of determining the role of A-site composition changes. At low La content (x = 0.2), adopting Pbnm symmetry, there was no indication of long-range ordering. Domains, with clear boundaries, were observed in bright-field (BF) imaging, but were not
immediately visible in the corresponding high-angle annular dark-field (HAADF) image. These boundaries, with the aid of
displacement maps from A-site cations in the HAADF signal, are shown to be tilt boundaries. At the La-rich end of the
composition (x= 0.9), adoptingCmmmsymmetry, long-range ordering of vacancies and La3+ions was observed, with alternating
La-rich and La-poor layers on (001)pplanes, creating a double perovskite lattice along thecaxis. These highly ordered domains
can be found isolated within a random distribution of vacancies/La3+, or within a large population, encompassing a large volume.
In regions with a high number density of double perovskite domains, these highly ordered domains were separated by twin boundaries, with 90°or 180°lattice rotations across boundaries. The occurrence and characteristics of these ordered structures are discussed and compared with similar perovskite systems.
1. INTRODUCTION
Perovskite structures based on the formulation Ca1−xLa2x/3TiO3
have been studied extensively for use across a wide range of possible applications, such as anodes for solid oxide fuel cells (SOFCs),1 as dielectric resonators,2 as high-density memory storage devices,3as host matrices for inert matrix nuclear fuels, and as containment media for high-level nuclear waste forms.4−6
Understanding the crystallographic ordering at the atomic scale and the nature of defects is essential in order to successfully utilize this class of perovskites across the multitude of applications.
The crystal structure of CaTiO3 at room temperature is
known to be orthorhombic, adoptingPbnmsymmetry, similar to GdFeO3.7 On heating, there are two phase transitions:first
to tetragonalI4/mcmat 1523 K and cubicPm-3mat 1647 K.7 The high-temperature cubic phase adopts the prototypical
perovskite structure, ABO3, with B cations within BO6
octahedral units and A cations at the center of a cube with cuboctahedral coordination with O ions, i.e. AO12. In contrast,
the structures found at lower temperatures have lower symmetry, corresponding to changes in BO6octahedral tilting,
distortions in octahedral spaces, or off-center B cation.8 Using
Glazer notation,9 widely used to represent tilts in octahedra within perovskite structures, the high-temperature structure is a0a0a0, whereasI4/mcmis a0a0c−
, andPbnmis a−
a−
c+.
As this paper concerns the structural characterization of Ca1−xLa2x/3TiO3, it is instructive to probe the existing literature
on the other end member of this compound perovskite as well, i.e. La2/3TiO3. The formation of A-site deficient perovskite in
Received: August 30, 2016 Published: September 15, 2016
Article
pubs.acs.org/IC License, which permit s unrest rict ed use, dist ribut ion and reproduct ion in any medium,
the La−Ti−O system, with Ti in the +4 oxidation state, was
first reported by Kestigian and Ward.10[With Ti in the purely
+3 oxidation state, LaTiO3 is formed with Pbnm symmetry,
witha = 5.63 Å, b= 5.61 Å, and c = 7.94 Å.11,12] Abe and Uchino were the first to synthesize La
2/3TiO3−λ as a single
phase, with the suggested ionic arrangement of
La2/33+Ti14+−2λTi2λ3+Ti32−−λ and demonstrating with XRD that with a
small amount of O deficiency (λ= 0.007) the {002} line is split
into three peaks. This is interpreted as doubling of the unit cell along thec-axis, resulting from a more facile formation of the perovskite phase with vacancy ordering on the A-sites.13 Critical in attracting attention to this system was the report of high ionic conductivity in Li0.34La0.51TiO2.94, due to a large
number of available vacant sites to diffusing Li ions.14 Other
studies report that pure La2/3TiO3 (also written as La2Ti3O9)
could not be stabilized,15,16or have indexed this structure as tetragonal (I4/mmm) witha=b= 3.856 Å, andc= 24.6 Å.17 The latter structure corresponds to a layered ordering configuration along [001]
p with 2 layers filled and one layer
vacant A-sites, hence the relatively largecaxis for this unit cell. Previous structure determinations of Ca1−xLa2x/3TiO3
perov-skites have used X-ray and neutron diffraction. Vashook et al.1
examined the phase transitions within the Ca1−xLa2x/3TiO3
series using X-ray diffraction, showing that for the Ca-rich
composition (x= 0.2) the structure adoptedPbnmsymmetry, changing to a body-centered orthorhombic symmetry (Imma) atx= 0.4. At the La-rich composition (x= 0.9) two structures were equally possible, monoclinic (P2/m) and orthorhombic (Cm2m). Vashook et al.1 highlighted the peculiarity of the La(Ca) cation ordering and the A-site vacancies in La0.6Ca0.1TiO3, which were absent in both La0.13Ca0.8TiO3
and La0.4Ca0.4TiO3. More recently,18 using synchrotron
X-rays, the symmetries in Ca1−xLa2x/3TiO3 were identified as Pbnm(x= 0.0−0.3),Imma(x= 0.4−0.6),I4/mcm(x= 0.7−
0.75), andfinallyCmmmfor the La-rich extreme case (x= 0.8−
0.98). For this La-rich phase, an ordered perovskite structure with alternating fully and partially (40%) occupied layers of A-site cations was observed. Zhang et al.19combined neutron and synchrotron X-ray structural refinements on nominally the
same system, showing the following phase stability regions: (i) 0 ≤x≤0.5;Pbnmsymmetry
(ii) 0.5 < x < 0.7;Ibmmsymmetry (iii) 0.7≤x< 0.9;I4/mcmsymmetry
(iv) x≥0.9;Cmmm, with long-range ordering found atx= 0.9
[image:3.625.325.566.93.395.2]While these techniques provide atomic scale information on both the unit cell and lattice, they are averaged over the entire volume examined. As such, they can be less sensitive to atomic scale segregation or ordering within the lattice. Aberration-corrected scanning transmission electron microscopy (STEM) in conjunction with electron energy-loss spectroscopy (EELS), provides an alternative approach to resolve atomic-scale segregation and/or ordering in such systems.
Table 1presents an overview of the space groups occurring in the CLTO system across the full-range of composition, using data provided by Zhang et al.19The TiO
6octahedra tilts in each
case are shown in the crystal models, also provided in Glazer’s notation in the third column.19,20 In the case of the
Cmmm
space group, besides the tilt in octahedra, there is significant
displacement of the B-site cation (Ti) within the octahedral space (the difference between maximum and minimum Ti−O
bond lengths accounts for 9.66%), concurrent with distortions
in the TiO6octahedral space, i.e.∼5.5% of the maximum O−O
bond length disparity. There are small distortions present in the B-site within the other space groups, but the Ti−O bond length differences are very small (<0.7%) and, at least in the context of
the present study, can be ignored.
In the present study we performed detailed atomic scale characterization using scanning transmission electron micros-copy concurrent with electron energy-loss spectrosmicros-copy (STEM/EELS), taking advantage of the different modes of
STEM high-resolution imaging and spectroscopy, and through computational electron microscopy. Using this approach, we elucidate the localized characteristics of ordering within the Ca1−xLa2x/3TiO3system, with variation inx, and identify a high
number density of various types of tilt boundaries. These atomic scale features are inaccessible in volume-averaged X-ray or neutron diffraction experiments performed in the past,19
upon which we are building up the present investigation.
2. EXPERIMENTAL SECTION
The Ca1−xLa2x/3TiO3specimens (x= 0.0, 0.1, ..., 0.9) were prepared by solid-state calcination of mixed oxides. Stoichiometric amounts of La2O3 (Alfa Aesar 99.99%), were dried at 1073 K for 24 h, TiO2 (Sigma-Aldrich≥99%) and CaCO3(Alfa Aesar 99.5%) were dried at 453 K for 24 h, prior to weighing, then all were milled with isopropanol in a planetary ball-mill. Once dried, the powders were sieved, pressed into pellets, and heated to 1573 K in air for 24 h, with a ramp rate of 5 K min−1. Following this, they were reground, sieved, and pressed once more before sintering at 1673 K in air for a further 48 h, achieving a relative sample density of >95% of the theoretical value, determined via the Archimedes method. Thefinal pellets were Table 1. Crystal Structures Reported11in the CLTO System along the Pseudocubic Directions [001]pand [100]p
a
aThe third column provides the relationships between the
ground with silicon carbide and polished to a 1 μm finish with diamond suspension (MatPrep) prior to thermal etching at 1523 K for 2 h in air. X-ray diffraction patterns were recorded using a STOE STADI P image plate diffractometer with a Cu Kα1 (λ= 1.5406 Å) beam, at 40 kV, 35 mA. The patterns were collected between 0°and 100°with an integrated step size of 0.03° and an average counting time of 1 s per point. The alignment was checked using an independent silicon calibration run.
Samples for transmission electron microscopy were prepared both using the focused-ion beam (FIB) lift-out technique21(Zeiss-NVision 40) and by grinding the pellets into electron-transparent particles, subsequently suspended in high-purity chloroform, dispersed onto a gold-supported lacey carbon network (Agar Lacey carbon film, H7 Au), and then dried in air. Samples prepared via FIB lift-out were initially coated with a thin layer of gold for better conductivity. To ensure minimal Ga-beam damage, the TEM lamellae were polished with gradually decreasing beam accelerating voltage and current, with a final cleaning done with a 2 kV Ga beam. All samples were stored under vacuum after preparation.
Preliminary TEM characterization was performed using a JEOL 2100 microscope, operated at accelerating voltages of 80 kV and at 200 kV. The lower voltage was aimed at screening suitable regions for subsequent STEM/EELS analysis. STEM/EELS analysis was performed using a Nion UltraSTEM 100 dedicated ultrahigh-vacuum scanning transmission electron microscope, equipped with a Gatan Enfina EELS spectrometer (SuperSTEM, Daresbury) operated at 100 kV accelerating voltage, with ∼0.3 eV native energy resolution, measured at full-width at half-maximum of the zero-loss peak. The effective energy resolution for the experiments was limited by the spectrometer detector point spread function, which is dependent on the dispersion chosen. The probe-forming optics were adjusted to provide a beam of∼100 pA with a convergence semiangle of 32 mrad, corresponding to a 0.9 Å probe size. The high-angle annular dark-field detector used to record the images had a semiangular range of 85−190 mrad, while the bright-field detector covered a semiangular range of 3.4 mrad; annular bright-field (ABF) images were also acquired, with a detector adjusted to cover a semiangular range of 15−32 mrad. At these settings, a second annular detector can record simultaneously a low-angle annular dark-field (LAADF) signal over a 35−190 mrad semiangular range. Energy loss spectra were acquired using a collection semiangle of 36 mrad. High-angle annular dark-field (HAADF) and bright-field (BF) images were acquired simultaneously. The BF signal is largely dominated by phase contrast (similar to high-resolution TEM imaging by the reciprocity principle), whereas the HAADF signal is largely due to thermal diffuse scattering; hence, it is incoherent and sensitive to atomic number (Z).22 These two imaging signals are complementary in detecting variations in the octahedral tilting (BF23,24 and ABF25) versus the distribution of heavier elements, i.e. Ti, Ca, and La (HAADF). As a rule of thumb, in order for the ADF image to be interpretable as Z-contrast, the inner collection angle of the detector has to be around three times the probe half angle.26With the angular values stated as above, this is satisfied for the HAADF signal presented. For simulation of the selected area diffraction patterns, the JEMS software was used.27Throughout this paper, unless specified, plane/ orientation indices are provided with respect to the pseudocubic unit cell, emphasized with the subscript “p”. To perform accurate image analysis on STEM micrographs, two techniques were utilized to enhance signal-to-noise ratio: (i) fast (typically 5 μs per pixel) acquisition of multiple frames, which were then aligned and summed using the Digital Micrograph software suite, and (ii) nonlinear drift correction using 0°and 90°scan rotation pairs acquired at slower rates (typically 150μs per pixel).28For a number of drift-corrected data sets, using a peak-finding algorithm implemented in a MATLAB code, where a five-parameter Gaussian function was fitted to the peak positions, mean“unit cells”were constructed by averaging along an axis of interest in the HAADF images. These were then utilized to plot displacement maps of the cations along different zone axes. Multislice STEM image simulations with 8 frozen phonon configurations were performed with custom written Matlab code, using the methods and
potentials outlined by E. J. Kirkland.29Simulation parameters were set to match the experimental conditions.
3. RESULTS
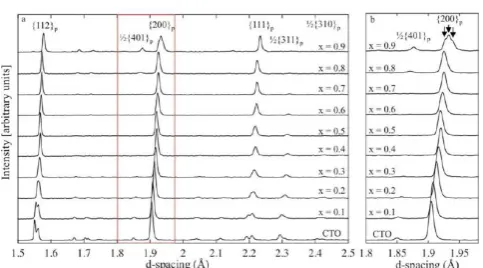
3-1. X-ray Diffraction.X-ray diffraction patterns across the
compositional range of the as-prepared Ca1−xLa2x/3TiO3system
are shown inFigure 1. All plots were normalized to the peak
intensity for the {110}p pseudocubic reflection, the strongest
reflection in all cases. It can be seen that the main pseudocubic
reflections shift toward largerd-spacing values with increasing
La content. This can be attributed to the slightly larger size of the La3+ion (electronic structure of La is [Xe] 5d16s2, rarely
adopting oxidation states other than 3+)30compared to Ca2+
(117.2 pm versus 114 pm31). This shift agrees with the neutron diffraction analysis performed by Zhang et al.19 Using X-ray
diffraction alone, it is difficult to determine the composition at
which the transition fromPbnm(a−a−c+) toIbmm(a−a−c0), i.e.
the disappearance of the 1/2{310} peak corresponding to the in-phase c+tilt,32
occurs. In contrast, using neutron diffraction,
it is clear this takes place atx= 0.6 CLTO composition.19 Given the limitations of X-ray diffraction, it is difficult to
definitively ascertain the formation of theIbmm and the I4/ mcm space groups. In contrast, the formation of the Cmmm
space group byx= 0.9 is evident in our data. This is highlighted by the splitting of the {200}ppeak into a triplet,Figure 1(b),
suggesting a transition to orthorhombic symmetry, coupled with the emergence of a peak at 1/2{401}p. The tilt system for Cmmmis a−b0c0, so we expect to see a reflection at 1/2{311},32 as also seen using neutron diffraction.19The data here shows
the peak at 1/2{311} strongly present in the Pbnm (a−a−c+)
space group, but gradually diminishing at higherxvalues. This is likely to arise from the different scattering parameters for
X-rays and neutrons. The peak at 1/2{401}, given the tilt system of a−b0c0for this space group, would not normally be expected
to be associated with octahedral tilting and most likely corresponds to an off-center Ti position within the octahedron.
As the presence of theIbmmandI4/mcmsymmetries could not be confirmed by XRD, TEM characterization was limited to
[image:4.625.324.566.153.287.2](Pbnm) and La-rich (Cmmm) space groups for electron microscopy characterization.
3-2. Electron Microscopy CharacterizationCLTO
with Low La Content (x = 0.1−0.5). Low magnification
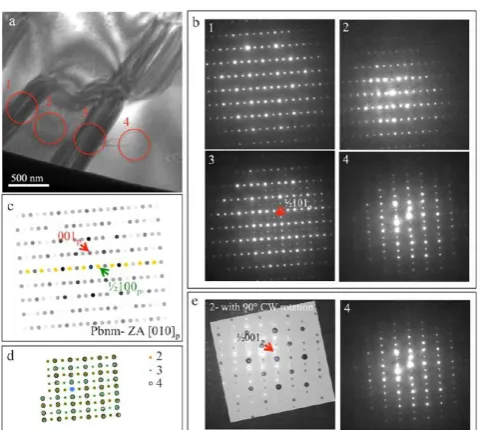
TEM observations of the low La-content CLTO samples reveal relatively large (>0.5μm in size) domains separated with wide defect structures.Figure 2 shows the case forx = 0.1 CLTO
[image:5.625.60.301.154.369.2]using a FIB-prepared sample. A series of selected area diffraction patterns were acquired across the region shown in Figure 2(a), with the numbered circles indicating the regions corresponding to the experimental electron diffraction patterns,
presented inFigure 2(b). In pattern 1, there is a good match with the simulated kinematical pattern (using the structure reported by Zhang et al.19), with the reflection at 1/2100
p
present. Pattern 2 shows a similar configuration, whereas in
pattern 3 the coexistence of 1/2100p, 1/2101p, and 1/2001pis
observed. In pattern 4, if the same zone axis and in-plane orientation is assumed, 1/2001p gains intensity whereas 1/
2100pvanishes. From this, we infer that the reflection observed
at 1/2100pcannot be due to double diffraction, as in that case it
would be expected to exist across all patterns. Furthermore, close inspection of patterns 2 and 4 indicates that they differ
through a 90°rotation, demonstrated inFigure 2(c).
From prior neutron diffraction analysis,19it is known that the Pbnm symmetry within the CLTO system corresponds to a−a−c+ tilting. Woodward and Reaney32suggest this gives rise to the presence of 1/2(eeo) reflections (e: even; o: odd) on
[100] or [010] zone axis patterns. Since this is a mix of in-phase and antiphase tilts, we can expect to observe 1/2{oee} reflections; however, these reflections can also indicate
antiparallel cation displacement. Hence, the presence of 1/ 2001p and 1/2101p can correlate to mixed octahedral tilting.
The presence of 1/2100pin patterns 1 and 2 seems to be an
outlier, which could be resolved by indexing these two patterns in the same zone axis but with a 90°in-plane rotation,Figure 2(c). This suggests that, in the region shown, when passing across the band highlighted in#3, the crystal rotates 90°; that is, the region in#3 is a 90°[010]ptilt boundary, with the beam incident along the tilt axis. Note that the diffraction peaks in#3 can be accounted for by superimposing the two patterns in#2 and#4, except the 1/2101ppeaks (See schematic in panel (d)). It is possible that this boundary in#3 is inclined to the incident electron beam. In that case, it is expected to merely observe superposition of patterns from the adjoining grains in the region of the boundary. The presence of the 1/2101p peaks
seems to reject this scenario. The appearance of this reflection
suggests a mechanism that accommodates changes in tilt directions of the octahedra. From a broader perspective, it can be seen that the tilting of the TiO6octahedra is clearly not the
same across the bulk with regions separated by transition bands/defects. A similar observation of such lattice tilt rotation inx= 0.1 CLTO is presented in Figure S1 in the Supporting Information.
In order to examine different zone axes, crushed powder
samples were prepared and Figure 3 shows high-resolution images fromx= 0.2 with the electron beam incident along the [010]p direction (Similar to Figure 2). Pairs of HAADF/BF
STEM micrographs are shown in panels (a) and (b), with a low magnification image of the particle included as an insert in (a)
(a selected area diffraction pattern collected at low magnifi
ca-tion is presented in the Supporting Information, Figure S2). The variations in intensity in HAADF images correspond to varying distributions of La versus Ca in A-site positions, with La-rich columns appearing brighter in intensity. Atomically resolved core-loss electron energy-loss spectra were gathered along this zone axis to directly map the distribution of Ca versus La-rich columns. The area marked in the HAADF micrograph inFigure 3(c), acquired along the same zone axis as abovewith only a scan rotation, is representative of such
EELS measurements. The sum of the electron energy-loss spectrum across the entire spectrum image area, Figure 3(d), shows the characteristic Ca-L2,3, Ti-L2,3, O−K, and La-M4,5
excitation edges. InFigure 3(e), along with the HAADF signal gathered during the spectrum image acquisition, elemental intensity maps, after background subtraction, are shown. The intensity maps of Ca and La in panel (e) show their respective distributions on the A-site, with high occupancy of one species resulting in lower intensity of the other. Domain boundaries, previously observed inFigure 2, were not encountered during high-magnification STEM/EELS examination along this zone
axis. Given the large size and low number density of such domains, this is not surprising.
Other boundaries indicating octahedral tilting were never-theless observed at other zone axes, as described later in this section.
Thex= 0.2 CLTO perovskite along the [001]pzone axis was
examined across different particles (Figures 4and5). InFigure 4, the HAADF signal again shows variations in intensity, due to variations in La/Ca and A-site vacancy distribution. The concurrently acquired BF signal, panel (b), shows a single domain, indicating no alteration in octahedral tilting within this region. Multislice simulations of expected HAADF and BF images, shown as lower insets in both panels, show a close Figure 2.CLTOx= 0.1 specimen (prepared via FIB) (a) showing the
match at a crystal thickness of 20 unit cells. The contrast observed in BF could only be reproduced assuming a small tilt
in the electron probe with respect to the sample, possibly due to local sample bending (here the case for 4 mrad tilt is presented). We recognize that the fit between the simulated
and experimental BF is not ideal. This is due to the small size of the BF detector (3.4 mrad half-angle) compared to the probe convergence semiangle (32 mrad), potentially resulting in misalignment. Nevertheless, we can show that the elongated features in the BF image can result from beam tilt. A matrix of BF and HAADF image simulations with varying sample thickness and probe tilts is shown in Figure S4 in the Supporting Information. The HAADF signal was not as affected
by the probe tilt compared to the BF signal. In fact, several publications, e.g. Yamazaki et al.,33have previously shown that crystal tilt does not significantly move peak intensities in
HAADF, and just alters their relative intensities.
In Figure 5, projecting along a similar zone axis but from a different particle, a generally similar HAADF contrast is
observed, panel (a); however, the simultaneously acquired BF signal, panel (b), shows domains. These domains, as they only appear in the BF image, can be related to changes in the tilt orientation of the TiO6octahedra. Using the routine described
in theExperimental Section, mean“unit cells”were constructed by averaging along the vertical axes of the HAADF and BF images, shown in panels (c) and (d). Since the variance in peak intensity for the B-sites (Ti) is much lower compared to the shared A-sites (Ca/La), these two positions could be readily identified after applying the peak-finding routine. Using a
matrix of fitted peak positions from the HAADF signal, the
[image:6.625.324.566.66.260.2]deviation from the mean position can be mapped across the image, panel (e). The A-sites are colored according to the provided legend on the right-hand side, depending on the magnitude and the direction of displacement, relative to the neighboring B-sites. The B-site positions (shown in smaller gray circles) were not included in the displacement map. The nominal displacement of the A-sites along the [100]p and
Figure 3.CLTO x = 0.2 specimen (crushed grain sample) viewed along [010]pZAthe low magnification image of the particle used for
[image:6.625.60.300.69.416.2]these data sets is included as the inset in (a) the HAADF image. (b) BF signal acquired simultaneously with (a). (c) HAADF image close to the area in (a) with applied scan rotation. The region in the red frame was selected for EELS spectrum imaging. (d) EELS sum spectrum of the region in (c). (e) HAADF duringSIacquisition image along with elemental intensity maps.
Figure 4.CLTO x = 0.2 specimen (crushed grain sample) viewed along the [001]p zone axisthe low magnification image of the
particle used is shown as the upper inset in (a). (a) HAADF and (b) BF signal pairs acquired simultaneously. Lower insets are multislice simulations of HAADF and BF signals with 4 mrad probe tilt at 20 unit cells crystal thickness. An array of simulations for the BF signal, with changes in crystal thickness and probe tilt, is presented in the
[image:6.625.60.300.513.637.2]Supporting Information.
[001]p directions is also shown. The boundary evident in the
BF signal coincides with the change in A-site displacement, as measured from the HAADF image. On the right section of the displacement map in panel (e) the displacement matches closely the nominal configuration along [001]
p. On the
opposite side of the boundary, however, this configuration is
completely changed, appearing closer to the [100]p confi
g-uration, indicating a 90°[010]ptilt boundary.
To highlight the changes in octahedral tilts, STEM measurements along the [110]pzone axis were undertaken, as
shown in Figure 6. Along this axis, similar boundarieswith
pronounced presence in BF, panel (b) inFigure 6, as opposed to a less obvious presence in the HAADF signal, panel (a)
were observed. Windowed Fast Fourier transformations (FFT) of the marked areas in (b) are shown in panels (c) and (d). The differences between the two FFTs are the presence of the 1/
2111pspot in (c) (marked with arrow) and its absence in (d).
This can be explained by indexing the FFT in (c) as the [010]Pbnmzone axis and the FFT in (d) as [100]Pbnm(Note that
these would correspond to the [110]p/[-110]pdirections in a
pseudocubic cell). Simulations of diffraction patterns along
those two zone axes are shown in panels (c) and (d) for clarity. In the case of [010]Pbnm, the mixed tilt system (a−a−c+) gives
rise to the appearance of the 1/2111preflection. Crystal models
along the two directions are presented in both cases, signifying that the atomic positions, aside from the O2− ions, are very
similar. This provides an explanation for the observed HAADF signal, showing only one single domain inFigure 6(a), since this signal is not affected by the O2−ions. Superimposed on the
HAADF micrograph (panel (a)) is the averaged unit cell, along with the A-site displacement map, with the legend provided.
The upper right corner of the image matches closely in A-site displacement with the nominalPbnm configuration along the
[100]Pbnm zone axis (note the ideal crystal structure shown
below). However, in the lower left section we observe a more random displacement, in-line with the [010]Pbnmzone axis. This agrees with the observation from the FFT of the BF signal, as shown in panels (c) and (d). Given the above, the boundary observed in the BF signal, panel (b), comprises a tilt boundary with 90°rotation around the [001]paxis, i.e. 90°[001]p, imaged with the electron beam incident perpendicular to the tilt axis.
3-3. Electron Microscopy CharacterizationCLTO
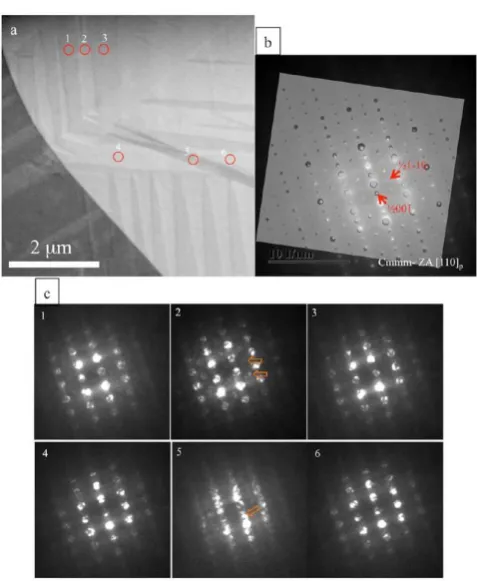
with High La Content (x = 0.9). For the La-rich CLTO sample (x = 0.9), X-ray diffraction identified the structure as
orthorhombic, adoptingCmmmsymmetry.Figure 7(a) presents
a low magnification STEM-DF image from such a composition,
prepared via the FIB lift-out procedure. The orientation of the grain on the right-hand side of the image was adjusted in parallel beam illumination (TEM) mode to be along the [110]p
zone axis. The TEM-BF image taken from the same zone axis is presented in the Supporting Information (Figure S6). The corresponding selected area diffraction pattern, along with a
simulation, is shown in panel (b). It can be observed here that the 1/2001, 1/21−10, and 1/21−11 peaks are also present in this pattern. Each grain, as evident in panel (a), consists of twin-like domains. Since the small size of these domains made it difficult to capture isolated electron diffraction patterns in
[image:7.625.61.301.201.404.2]TEM mode, we acquired small convergence angle electron diffraction (CBED) patterns in STEM mode instead, which has
Figure 6.CLTOx= 0.2 along the [110]pzone axis: (a) HAADF and (b) BF images acquired simultaneously. The window over panel (a) contains both the averaged unit cell (measured along the shown direction from the HAADF image) and the A-site displacement map (B-sites appear as gray). Below panel (a) a legend for the map is provided, along with nominal displacement states along the [010]Pbnm and [100]Pbnm directions. Frames in (b) mark the locations corresponding to fast Fourier transforms in panels (c) and (d), respectively. In each case, a diffraction simulation is presented. (The low magnification image of the particle used and the corresponding SAD is shown inFigure S5.)
[image:7.625.325.564.229.520.2]afiner spatial resolution. The spots marked in the STEM-DF
image, with numbers 1 through 6, designate the locations of the probe corresponding to the CBED patterns shown in panel (c). Here, it can be observed that the appearance of the fractional diffraction peaks does not occur evenly across the domain
structure within this grain. For instance, comparing#1,#2, and #3, 1/2111 peaks seem to be present in#2, but absent in cases of#1 and#3 (note arrows in#2). More drastically, this can be recognized for the case of patterns#4,#5, and#6, where the 1/ 2001 spot is strongly present in#5 and absent in the other two (arrowed). A lower intensity can also be discerned where 1/ 21−10 reflections are expected to be present. This clearly
demonstrates that the TEM selected-area diffraction pattern
(Figure 7(b)) is an averaged diffraction signal with
contribu-tions from all of the subdomains, averaged across the entire grain. STEM/CBED measurements show that each domain is associated with a slightly modified symmetry: with 1/2001
pointing toward doubling of the caxis and 1/2111 indicating deviation from a−
b0c0 tilt system for the Cmmm symmetry
(Cm2m symmetry with a−b0c+ tilt could explain this
super-structure reflection).34What is important to note here is the
smaller scale, and consequently higher number density, of such domains compared to those observed earlier in low La-content CLTO samples (Figure 2).
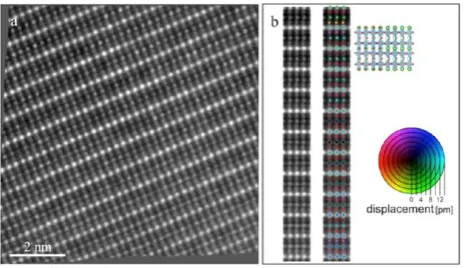
For a more detailed analysis on the nature of the observed domains above, crushed powder samples were studied using aberration-corrected STEM/EELS. One CLTOx= 0.9 particle oriented along the [100]pzone axis, imaged using the HAADF
detector, is shown in Figure 8. In the upper region of the HAADF image in panel (a), lines of higher intensity, distributed with no long-range ordering, are observed. Core-loss EELS spectrum imaging from a selected region, shown on the right-hand side of panel (a), indicates that the line formations with higher HAADF intensity are comprised of La-rich columns. The Ca signal is noisier than the La signal due to the proximity to the C−K edge (and resulting difficulties in
obtaining a good background subtraction), but does not indicate any ordering. This regime was not persistent across the entire particle. In the lower half section of the same image, the
“random” perovskite structurethis is not entirely random,
given the presence of line clusters of La described above
transforms into a double perovskite structure, with doubling of thecaxis. The La-M4,5map highlights this transition, with the
[image:8.625.149.477.62.441.2]upper half corresponding to the primitive pseudocubic perovskite unit cell and the lower half demonstrating condensation of La ions on alternating (001) planes, doubling thecaxis in the cubic unit cell. The arrows beside the HAADF, acquired during spectrum imaging, and the La map point Figure 8.CLTOx= 0.9 specimen (same particle as in Figure9) along the [100]pzone axis. (a) HAADF image of an area with transition from single perovskite structure (top half) to double-layered perovskite (bottom halfthe arrows roughly point to the transition region); on the right, the
roughly to where the transition takes place.Figure 8(b) shows an area away from the transition zone and entirely showing the double-perovskite ordering regime. Here the La-M4,5 map, in
confirmation of the observed HAADF intensity variations,
shows a doubling of the primitive c-axis and preferential ordering of La ions and vacancies. It should be noted that the 001 planes with less intensity in the HAADF signal are not fully devoid of La, as is evidenced by the occasional high-intensity column on the vacancy-rich planes (also observed in the La map).
Within the particle above with long-range La3+/V
Ca
2−ordering,
twins were also encountered.Figure 9(a) and9(b) are HAADF
and BF pair images showing a twin boundary, with a low magnification view of the corresponding region presented as
the inset in panel (a) (arrowed). The twin boundary corresponds to∼90°rotation in the lattice (∼0.6°deviation); hence, the twin can be identified as a 90°[100]ptilt boundary.
The core-loss EELS spectrum image, shown in theSupporting Information(Figure S7), confirms a direct correlation between
the columns with high intensity to higher concentrations of La. Alongside this rotation in the double-perovskite structure, evident in the HAADF image, the BF signal indicates a change moving across the twin boundary. In the same particle, another boundary configuration of two meeting ordered double
perovskite domains was observed. In this case, as shown in panels (c) and (d) inFigure 9(pair HAADF/BF images), the La-rich planes in the first domain, upon passing through a
transitional boundary, turn into vacancy-rich planes in the second domain and vice versa. This boundary can be identified
as an 180°[100]ptilt boundary.
In order to better resolve the changes in the octahedral tilts and investigate the ordering behavior of the vacancies at a different projection, STEM analysis was performed along the
[110]pzone axis of theCmmmstructure, shown inFigure 10. In
panel (a) the HAADF signal at relatively low magnification (20
nm field of view) shows an area, which includes both the “random” single unit cell perovskite structure and a highly ordered double perovskite region. Two regions, falling into the random and the ordered domains, are marked in (a), with corresponding FFTs shown in panel (b). It can be seen that 1/ 2001p peaks are present in the ordered region (#2) that are
absent in the single perovskite domain (#1).
This observation is in-line with Figure 7, comparing point diffraction patterns#4,#5, and#6, with location corresponding to #5 marker having a double perovskite ordered structure. Similar bands of double perovskite domains were observed in the same particle as shown inFigure 10. Panels (c) and (d) present LAADF (low-angle annular dark-field)/ABF (annular
bright-field) images highlighting the transition from a single to
a double perovskite structure. High-magnification LAADF/ABF
micrographs from the ordered domain, panels (e) and (f), point to variations in La3+ occupancy on the (001)
p planes.
[image:9.625.324.566.99.459.2]Crystal models along the same zone axis are superimposed in Figure 9.CLTOx= 0.9 specimen (same particle and zone axis as the
previousfigure) (a) HAADF and (b) BF pair images showing a twin-like boundary. The inset in panel a shows the region with the twin at low magnification. (c and d) HAADF/BF image pair within the same particle showing another type of boundary between two double perovskite domains.
[image:9.625.62.301.207.455.2]panels (c) and (d), highlighting the feature of this zone axis that neighboring atomic planes, perpendicular to [001]p, alternate
between (Ca,La)/O planes and Ti/O planes. It can be observed in panel (f) that O sites within the double perovskite domain do not show deviation from the crystal model. In contrast, close inspection of the single perovskite region, highlighted area in panel (d), clearly shows distortions in the O lattice (examples marked by arrows). In order to accurately map the displace-ment of the cations along this zone axis, an HAADF image
after applying nonlinear scanning drift correctionwas used, as
shown in Figure 11(a). In panel (b), an averaged unit cell,
based on the HAADF image, along with a displacement map of the cationic sites is presented. Compared to the crystal model along the same zone axis, it appears that the Ti4+cations are
displaced toward the left-hand side of the octahedral spaces. This observation is discussed in the following sections.
4. DISCUSSION
Comparing the two extremes in La composition within Ca1−xLa2x/3TiO3 perovskites, there is a strong tendency for
the La-rich compositions to exhibit long-range vacancy ordering, while, on the La-lean side, large domains were identified with extended defect structures, some of which are
tilt boundaries. Observation of boundaries that were more prominently visible in the BF signal, and less so in HAADF, was recurrent. Analysis of the A-site displacement, mapped using the HAADF signal, was essential in identifying the nature of these boundaries. Even though the presence of these boundaries was readily recognized in the BF image, due to sensitivity to both thickness and probe tilt, this signal was not suitable for quantifying atomic site positions. These boundaries proved to be tilt boundaries in all cases observed. In thePbnm
space group we have identified the following tilt boundaries:
90°[010]p (twice) and 90°[001]p. In the Pbnm case,
identification of such boundaries was not trivial and required
access to both HAADF and BF (or ABF) signals, whereas, for
Cmmm symmetry, discussed below, the tilt boundary was readily evident in the HAADF signal, as is highlighted by change in the La3+/V
Ca
2−ordering direction.
In the La-rich perovskite (x = 0.9), Ca0.1La0.6TiO3,
long-range ordering in vacancies versus La3+cations, with doubling
of the [001]paxis of the pseudocubic unit cell was observed, in
accordance with previous diffraction studies.19 Our
observa-tions clearly demonstrate though that this doubling of the cp
axis cannot describe the entire microstructure. These double perovskite regions either emerge from regions with random vacancy distribution (as shown earlier, along both [100]pand
[110]p) or are separated from other double perovskite regions
by tilt boundaries. In the Cmmm case, two of the following boundaries were observed: 90°[001]p and 180°[001]p. The boundaries within double perovskite domains were most prevalent in a FIB-prepared sample directly from the surface of the pellet. This could be due to higher vacancy concentrations closer to the surface, resulting in a higher number density of double-perovskite domains. Domains corresponding to octahedral tilt geometries different from the
a−b0c0system, anticipated for the Cmmmsymmetry based on
the structure proposed by Zhang et al.,19 were also observed (i.e., 1/2111 reflection observed in panel (c) ofFigure 7). It is
known that thermal history plays an important role in the appearance or suppression of long-range vacancy/cation ordering in A-site deficient perovskites, with fast cooling rates
arresting the necessary diffusional processes conducive to such
ordering.35,36 Given that the specimens examined here share the same thermal history, it strongly indicates that the observed disparity in ordering behavior ofVCa2−/ La3+across the two ends
of La compositions is a direct consequence of changes in chemistry.
A-site cation ordering in AA′BO3perovskites, as observed for
x= 0.9 CLTO, is far less common than B-site cation ordering in ABB′O3perovskites;37but if present, A-site ordering almost exclusively adopts a layered ordering configuration.38 Some
other cases of columnar A-site ordering,39 or a complex interplay between microtwinning and columnar ordering,40 have also been reported. The more prevalent layered ordering results in differences of environment for anions; that is,
one-sixth of the anions are surrounded by four A cations while another one-sixth are surrounded by four A′ cations. This bonding discrepancy is relieved, in perovskites with a highly charged d0cation on the B-site like Ti4+, most preferably by the
displacement of B-site cation toward the A-site cation layer with higher concentration of vacancies (this is known as second order Jahn−Teller (SOJT) distortion).38,41In our observations along the [110]pzone axis of thex= 0.9 CLTO, mapping the
cationic displacements as presented inFigure 11, a shift in the Ti4+position toward the low occupancy (001)
pplane was not
observed, indicating that the SOJT mechanism suggested above is not active in this perovskite. Instead, a lateral shift in Ti within the octahedral spaces is observed,Figure 11(b).Ab initio
calculations are needed to investigate the energetic favorability of this distortion mechanism versus the SOJT distortion suggested in other perovskites.
Layered ordering at the La-rich end of the Ca1−xLa2x/3TiO3
series has been observed in similar systems, e.g. Sr1−xLa2x/3TiO3,42and also in La2/3TiO3‑λ,13with small oxygen
deficiency (λclose to 0.007), as previously mentioned in the Introduction. A layered ordering is also suggested to be present in La2/3‑xLi3xTiO3 (LLTO) and La1/3‑xLi3xNbO3 (LLNO)
perovskites, with La-rich and La-poor planes alternating along the [001]p direction similar to the x = 0.9 composition of
CLTO.43−45
A combination of ab initio and Monte Carlo simulations on Sr1−xLa2x/3TiO3suggests long-range ordering of
the A-site as the contribution of vacant sites increases (largerx
[image:10.625.66.300.200.334.2]values).46 According to this study, at low vacancy concen-trations (VSr2−) the electrostatic affinity between La3+ andVSr2− Figure 11.CLTOx= 0.9, along the [110]pzone axis: (a) HAADF
dominates and these form neutral arrangements, e.g. linear or bent trimers, to minimize energy. In the presence of high vacancy concentration, the strain energy, favoring columns of neighboring vacancies, outweighs the electrostatic interactions and leads to long-range ordering. This is suggested to arise from interplay between electrostatic forces (i.e., between La3+
andVCa2−) and strain energy, with the latter being dominant for the case of long-range ordering of vacancy-La pairs at largex
values. Nominally, in the x = 0.2 perovskite (with Pbnm symmetry) we expect around 7% vacancies on A sites, whereas, in x = 0.9 this amounts to 30%. Similar arguments could potentially apply for the CLTO system. An alternative crystal structure proposed for La2/3TiO3entails layered ordering with
2 layers of high La occupancy and 1 layer of vacancy-rich configuration withI4/mmmsymmetry and a = b = 3.856 Å and
c = 24.6 Å.17Given our HAADF and EELS observations, we can safely rule out the occurrence of similar ordering in La-rich CLTO perovskite.
Inx= 0.9 CLTO, diffraction evidence was observed pointing
to a modified tilting configuration, deviating from the a−b0c0
regime expected fromCmmmsymmetry (Table 1), i.e. 1/2111 peak presence inFigure 7. A similar observation was reported for low Li-content La2/3−xLi3xTiO3,47with the presence of the
1/2111 peak indicating rhombohedral symmetry, where prior diffraction data suggested Pm-3− and P4/mmm symmetries
with no octahedral tilting and hence requiring the absence of a peak at the 1/2111 position. Regions with modified Ti−O
tilting were shown to be responsible for this peak’s presence. The same appears to be the case forx= 0.9 CLTO, as shown in Figures 10(d) and11(b), with evidence of distortions in O and Ti lattices giving rise to the 1/2111 peak. This is another aspect of the microstructure that was not detectable via volume-averaged diffraction measurements.19
A recent study on the similar A-site deficient perovskite
system Ca0.1Nd0.6TiO3 observed an incommensurate
super-lattice structure.48 Taking up a morphology described as
“nanochessboard”, these domains were shown to correspond to strain arising from modulations in the octahedral titling, and not from chemical segregation, as suggested in earlier studies on similar systems.49,50 In Nd2/3−xLi3xTiO3 perovskites,
analogous features in the microstructure, i.e. one- or two-dimensional stripe patterns and nanochessboard arrangements, were correlated with parallel ordering and spinodal decom-position along different crystallographic directions.51 Similar
behavior was not encountered in CLTO. Instead, the common structural feature in both extreme cases of composition in CLTO appeared to be the development of tilt boundaries, as was documented throughout this study. The prevalence of twinning and twin-like boundaries in perovskites was recognized from the very early days of optical crystallography investigations of natural CaTiO3minerals.52In thefirst detailed
electron microscopy characterization of CaTiO3, White et al.
identified two types of tilt boundary systems (See Supporting Information, Figure S8, for conversion from reported Pcmn
indices53to pseudocubic):54 90°and 180°rotation about the normal to (100)p. The former case was one of the boundary
types observed in the present study. Interestingly, the LLTO system also demonstrated a high number density of 90° rotation boundaries, varying in size depending on the composition.55 Similarly, doubling of the unit cell along with appearance of twinning with 90° rotation of the lattice was reported in LaAlO3-stabilized La2/3TiO3.56 A follow-up study
on this system linked a higher number density of twins to faster
cooling rates,57postulating that the occurrence of these defects points to a mechanism that accommodates the induced strains through the phase transformations. Although we have not investigated the effect of cooling rate on the twinning domains
in CLTO, it is safe to infer the same trend. It is also possible that strain does not play a major role and we are observing the effect of change in space groups, modifying a crystallographic
direction with high symmetry at elevated temperatures to a number of nonequivalent directions at a lower temperature, lower symmetry space group in neighboring domains. More work is required to unequivocally resolve the above distinction. Since the tilt boundaries observed in CLTO are accom-modated by subtle changes in the octahedral spaces, they were not accompanied by complex boundary structures, such as those reported for SrTiO3.58,59In those cases, as the boundary
structure involved repeating patterns of Sr and Ti, they were readily recognizable in the HAADF signal. A twin boundary in CaTiO3 in one experimental study was associated with
polarization in Ti, with 3 to 6 pm deviation from the zero-polarity position,60 pointing to a very localized ferroelectric domain with a nonpolar matrix. However, this was not observed in the boundaries examined here; namely, the polarization in Ti was close to or smaller than our peak position precision of 3 pm.
5. CONCLUSIONS
Ordering in the A-site occupancy and the nature of the domain boundaries were characterized in the Ca1−xLa2x/3TiO3
perov-skite structure using atomically resolved STEM/EELS analysis. In the low La-content regime, with Pbnm space group and examined along [010]p, [001]p, and [110]p zone axes,
long-range ordering in La3+ or vacancies were not observed.
Micrographs of the HAADF signal pointed to occasional linear configuration of La3+ ions. Tilt boundaries, with prominent
contrast in BF images but almost invisible in the HAADF signal, were commonly observed. In this composition range, we identified the following tilt boundaries: 90°[010]p(twice) and
90°[001]p. Successful characterization of these boundaries was only possible through simultaneous access to both BF and HAADF signals, and applying a detailed peak-finding and
displacement-mapping routine to the HAADF image.
At the La-rich end of the composition, with Cmmm space group and examined along the [100]p and [110]p zone axes,
long-range ordering of vacancies and La3+ ions was observed.
This was demonstrated with alternating La-rich and La-poor layers on (001)pplanes, effectively creating a double perovskite
lattice along the c axis. These highly ordered domains were observed to be either isolated within a “matrix” of random distribution of vacancies/La3+, or found with a high number
density, covering nearly an entire particle. In regions with a high population of double perovskite domains, these ordered regions were separated from each other by tilt boundaries, with 90°or 180°misorientation across the two neighboring grains. Observation of the 1/2111ppeak in the high-La-content CLTO
electron diffraction patterns was correlated to regions with
distortions in O−Ti bonds.
■
ASSOCIATED CONTENT*
S Supporting InformationSecond example of tilt boundary observed in x = 0.1 CLTO. Low magnification images of the particles used
forFigures 3,4,6, and7along with corresponding SAD patterns. Array of multislice simulations for BF and HAADF signals, CLTO x = 0.2, with changes in thickness and probe tilt. EELS map of area shown in Figure 9(a). Comparing Pbnm and Pcmn unit cells. (PDF)
■
AUTHOR INFORMATIONCorresponding Author
*E-mail: [email protected], danaie.mohsen@ gmail.com.
Notes
The authors declare no competingfinancial interest.
■
ACKNOWLEDGMENTSFunding is acknowledged from the UK’s Engineering and Physical Sciences Research Council (EPSRC) under grants EP/ K029770/1 and EP/L005581/1. PDE acknowledges support from the U.S. Department of Energy, Office of Science, Fusion
Energy Sciences. SML acknowledges funding from the EPSRC grant EP/G037140/1. SuperSTEM is the UK National Facility for Aberration-Corrected STEM, supported by EPSRC. Work at the Molecular Foundry was supported by the Office of
Science, Office of Basic Energy Sciences, of the U.S.
Department of Energy under Contract No. DE-AC02-05CH11231. Guidance in sample preparation from Amy Gandy is gratefully acknowledged.
■
REFERENCES(1) Vashook, V.; Vasylechko, L.; Knapp, M.; Ullmann, H.; Guth, U. Lanthanum Doped Calcium Titanates: Synthesis, Crystal Structure, Thermal Expansion and Transport Properties.J. Alloys Compd.2003,
354, 13−23.
(2) Kim, I.-S.; Jung, W.-H.; Inaguma, Y.; Nakamura, T.; Itoh, M. Dielectric Properties of a-Site Deficient Perovskite-Type Lanthanum-Calcium-Titanium Oxide Solid Solution System [(1−x)La2/3TiO3−
xCaTiO3(0.1≤X≤0.96)].Mater. Res. Bull.1995,30, 307−316. (3) Salje, E.; Zhang, H. Domain Boundary Engineering. Phase Transitions2009,82, 452−469.
(4) Howard, C. J.; Lumpkin, G. R.; Smith, R. I.; Zhang, Z. Crystal Structures and Phase Transition in the System SrTiO3−La2/3TiO3.J. Solid State Chem.2004,177, 2726−2732.
(5) Smith, K. L.; Lumpkin, G. R.; Blackford, M. G.; Colella, M.; Zaluzec, N. J. In Situ Radiation Damage Studies of LaxSr1−3x/2TiO3 Perovskites.J. Appl. Phys.2008,103, 83531.
(6) Ringwood, A. E.; Kesson, S. E.; Ware, N. G.; Hibberson, W.; Major, A. Immobilisation of High Level Nuclear Reactor Wastes in SYNROC.Nature1979,278, 219−223.
(7) Ali, R.; Yashima, M. Space Group and Crystal Structure of the Perovskite CaTiO3from 296 to 1720 K.J. Solid State Chem.2005,178, 2867−2872.
(8) Megaw, H. D.Crystal Structures: A Working Approach; Studies in physics and chemistry, no. 10; Saunders: Philadelphia; London, 1973. (9) Glazer, A. Simple Ways of Determining Perovskite Structures.
Acta Crystallogr., Sect. A: Cryst. Phys., Diffr., Theor. Gen. Crystallogr. 1975,31, 756−762.
(10) Kestigian, M.; Ward, R. The Lanthanum-Titanium-Oxygen System.J. Am. Chem. Soc.1955,77, 6199−6200.
(11) MacLean, D. A.; Ng, H.-N.; Greedan, J. E. Crystal Structures and Crystal Chemistry of the RETiO3Perovskites: RE = La, Nd, Sm, Gd, Y.J. Solid State Chem.1979,30, 35−44.
(12) Eitel, M.; Greedan, J. E. A High Resolution Neutron Diffraction Study of the Perovskite LaTiO3.J. Less-Common Met.1986,116, 95−
104.
(13) Abe, M.; Uchino, K. X-Ray Study of the Deficient Perovskite.
Mater. Res. Bull.1974,9, 147−155.
(14) Inaguma, Y.; Liquan, C.; Itoh, M.; Nakamura, T.; Uchida, T.; Ikuta, H.; Wakihara, M. High Ionic Conductivity in Lithium Lanthanum Titanate.Solid State Commun.1993,86, 689−693.
(15) MacChesney, J. B.; Sauer, H. A. The System La2O3TiO5; Phase Equilibria and Electrical Properties.J. Am. Ceram. Soc.1962,45, 416−422.
(16) Lee, H. J.; Park, H. M.; Cho, Y. K.; Nahm, S. Microstructure Characterization of the (1−x)La 2/3TiO3· xLaAlO3 System. J. Am. Ceram. Soc.2003,86, 1395−1400.
(17) Gönen, Z. S.; Paluchowski, D.; Zavalij, P.; Eichhorn, B. W.; Gopalakrishnan, J. Reversible Cation/Anion Extraction from K2La2Ti3O10: Formation of New Layered Titanates, KLa2Ti3O9.5and La2Ti3O9.Inorg. Chem.2006,45, 8736−8742.
(18) Vashook, V.; Vasylechko, L.; Trofimenko, N.; Kuznecov, M.; Otchik, P.; Zosel, J.; Guth, U. A-Site Deficient Perovskite-Type Compounds in the Ternary CaTiO3-LaCrO3-La2/3TiO3 System. J. Alloys Compd.2006,419, 271−280.
(19) Zhang, Z.; Lumpkin, G. R.; Howard, C. J.; Knight, K. S.; Whittle, K. R.; Osaka, K. Structures and Phase Diagram for the System CaTiO3−La2/3TiO3.J. Solid State Chem.2007,180, 1083−1092.
(20) Aleksandrov, K. S.; BartolomÉ, J. Structural Distortions in Families of Perovskite-like Crystals.Phase Transitions2001,74, 255−
335.
(21) Giannuzzi, L. A.; Stevie, F. A. A Review of Focused Ion Beam Milling Techniques for TEM Specimen Preparation.Micron1999,30, 197−204.
(22) Pennycook, S. J.; Nellist, P. D.Scanning Transmission Electron Microscopy: Imaging and Analysis; Springer Science & Business Media: 2011.
(23) Kim, Y.; Pennycook, S. j.; Kalinin, S. v.; Borisevich, A. y.; Yu, P.; Ramesh, R.; Chu, Y. Direct Mapping of Octahedral Tilts in Perovskite Oxide Materials Using Bright Field Scanning Transmission Electron Microscopy.Microsc. Microanal.2012,18(Supplement S2), 420−421. (24) Zhu, Y.; Withers, R. L.; Bourgeois, L.; Dwyer, C.; Etheridge, J. Direct Mapping of Li-Enabled Octahedral Tilt Ordering and Associated Strain in Nanostructured Perovskites. Nat. Mater. 2015,
14, 1142−1149.
(25) Aso, R.; Kan, D.; Shimakawa, Y.; Kurata, H. Octahedral Tilt Propagation Controlled by A-Site Cation Size at Perovskite Oxide Heterointerfaces.Cryst. Growth Des.2014,14, 2128−2132.
(26) James, E. M.; Browning, N. D. Practical Aspects of Atomic Resolution Imaging and Analysis in STEM.Ultramicroscopy1999,78, 125−139.
(27) Stadelmann, P. JEMS JAVA electron microscopy software;
http://www.jems-saas.ch/(accessed Dec 17, 2015).
(28) Ophus, C.; Ciston, J.; Nelson, C. T. Correcting Nonlinear Drift Distortion of Scanning Probe and Scanning Transmission Electron Microscopies from Image Pairs with Orthogonal Scan Directions.
Ultramicroscopy2016,162, 1−9.
(29) Kirkland, E. J. Advanced Computing in Electron Microscopy; Springer Science & Business Media: 2010.
(30) Hitchcock, P. B.; Lappert, M. F.; Maron, L.; Protchenko, A. V. Lanthanum Does Form Stable Molecular Compounds in the + 2 Oxidation State.Angew. Chem., Int. Ed.2008,47, 1488−1491.
(31) Shannon, R. D. Revised Effective Ionic Radii and Systematic Studies of Interatomic Distances in Halides and Chalcogenides.Acta Crystallogr., Sect. A: Cryst. Phys., Diffr., Theor. Gen. Crystallogr.1976,32, 751−767.
(32) Woodward, D. I.; Reaney, I. M. Electron Diffraction of Tilted Perovskites.Acta Crystallogr., Sect. B: Struct. Sci.2005,61, 387−399.
(34) Kishida, K.; Goto, K.; Inui, H. Electron Diffraction of ABX3 Perovskites with Both Layered Ordering of A Cations and Tilting of BX6Octahedra.Acta Crystallogr., Sect. B: Struct. Sci. 2009,65, 405−
415.
(35) Howard, C. J.; Zhang, Z.; Carpenter, M. A.; Knight, K. S. Suppression of Strain Coupling in Perovskite La0.6Sr0.1TiO3by Cation Disorder.Phys. Rev. B: Condens. Matter Mater. Phys.2007,76, 54108. (36) Labeauu, M.; Grey, I. E.; Joubert, J. C.; Vincent, H.; Alario-Franco, M. A. Structural Studies on A-Cation-Deficient Perovskite-Related Phases. II. Microdomain Formation in ThNb4O12. Acta Crystallogr., Sect. A: Cryst. Phys., Diffr., Theor. Gen. Crystallogr.1982,38, 753−761.
(37) Davies, P. K. Cation Ordering in Complex Oxides.Curr. Opin. Solid State Mater. Sci.1999,4, 467−471.
(38) King, G.; Woodward, P. M. Cation Ordering in Perovskites.J. Mater. Chem.2010,20, 5785−5796.
(39) Aimi, A.; Mori, D.; Hiraki, K.; Takahashi, T.; Shan, Y. J.; Shirako, Y.; Zhou, J.; Inaguma, Y. High-Pressure Synthesis of A-Site Ordered Double Perovskite CaMnTi2O6 and Ferroelectricity Driven by Coupling of A-Site Ordering and the Second-Order Jahn−Teller Effect.Chem. Mater.2014,26, 2601−2608.
(40) Labeau, M.; Grey, I. E.; Joubert, J. C.; Chenevas, J.; Collomb, A.; Guitel, J. C. The Structure of the A-Cation-Deficient Perovskite UNb4O12.Acta Crystallogr., Sect. B: Struct. Sci.1985,41, 33−41.
(41) Knapp, M. C.; Woodward, P. M. A-Site Cation Ordering in AA′BB′O6Perovskites.J. Solid State Chem.2006,179, 1076−1085.
(42) Howard, C. J.; Zhang, Z. Structures and Phase Transition in the Layered Perovskite La0.6Sr0.1TiO3: A New Orthorhombic Structure Solved from High-Resolution Diffraction in Combination with Group Theoretical Analysis.J. Phys.: Condens. Matter2003,15, 4543.
(43) Catti, M. Ion Mobility Pathways of the Li+ Conductor Li0.125La0.625TiO3 by Ab Initio Simulations. J. Phys. Chem. C 2008,
112, 11068−11074.
(44) Gao, X.; Fisher, C. A. J.; Ikuhara, Y. H.; Fujiwara, Y.; Kobayashi, S.; Moriwake, H.; Kuwabara, A.; Hoshikawa, K.; Kohama, K.; Iba, H.; Ikuhara, Y. Cation Ordering in A-Site-Deficient Li-Ion Conducting Perovskites La(1−x)/3LiXNbO3.J. Mater. Chem. A2015,3, 3351− 3359.
(45) García-Martín, S.; Alario-Franco, M. A.; Ehrenberg, H.; Rodríguez-Carvajal, J.; Amador, U. Crystal Structure and Micro-structure of Some La 2/ 3‑X Li 3X TiO3 Oxides: An Example of the Complementary Use of Electron Diffraction and Microscopy and Synchrotron X-Ray Diffraction To Study Complex Materials.J. Am. Chem. Soc.2004,126, 3587−3596.
(46) Thomas, B. S.; Marks, N. A.; Harrowell, P. Inversion of Defect Interactions due to Ordering in Sr1−3x/2LaxTiO3 Perovskites: An Atomistic Simulation Study.Phys. Rev. B: Condens. Matter Mater. Phys. 2006,74, 214109.
(47) García-Gonzalez, E.; Urones-Garrote, E.; Vá rez, A.; Sanz, J.́
Unravelling the Complex Nanostructure of La0.5−xLi0.5−xSr2xTiO3 Li Ionic Conductors.Dalton Trans.2016,45, 7148−7157.
(48) Azough, F.; Kepaptsoglou, D.; Ramasse, Q. M.; Schaffer, B.; Freer, R. On the Origin of Nanochessboard Superlattices in A-Site-Deficient Ca-Stabilized Nd2/3TiO3.Chem. Mater.2015,27, 497−507. (49) Guiton, B. S.; Davies, P. K. Nano-Chessboard Superlattices Formed by Spontaneous Phase Separation in Oxides. Nat. Mater. 2007,6, 586−591.
(50) Withers, R. L.; Bourgeois, L.; Snashall, A.; Liu, Y.; Norén, L.; Dwyer, C.; Etheridge, J. Chessboard/Diamond Nanostructures and the A-Site Deficient, Li1/2−3xNd1/2+xTiO3, Defect Perovskite Solid Solution.Chem. Mater.2013,25, 190−201.
(51) Lu, J. B.; Yang, H. X.; Li, Z. A.; Ma, C.; Shi, H. L.; Zeng, L. J.; Li, J. Q. Phase Separation, Cation Ordering and Nano-Structural Complexities in Nd2/3−xLi3xTiO3 with x = 0.14.J. Solid State Chem. 2008,181, 3194−3199.
(52) Bowman, H. L. On the Structure of Perovskite from the Burgumer Alp, Pfitschthal, Tyrol.Mineral. Mag.1908,15, 156−176.
(53) Kay, H. F.; Bailey, P. C. Structure and Properties of CaTiO3.
Acta Crystallogr.1957,10, 219−226.
(54) White, T. J.; Segall, R. L.; Barry, J. C.; Hutchison, J. L. Twin Boundaries in Perovskite.Acta Crystallogr., Sect. B: Struct. Sci.1985,41, 93−98.
(55) Fourquet, J. L.; Duroy, H.; Crosnier-Lopez, M. P. Structural and Microstructural Studies of the Series La2/3−xLi3x□1/3−2xTiO3.J. Solid State Chem.1996,127, 283−294.
(56) Azough, F.; Wang, W.; Freer, R. The Crystal Structure of LaAlO3-Stabilized La2/3TiO3Ceramics: An HRTEM Investigation.J.
Am. Ceram. Soc.2009,92, 2093−2098.
(57) Azough, F.; Freer, R.; Schaffer, B. Direct Observation of A-Site Vacancies and a Twin Boundary Structure in La2/3TiO3-Based Ceramics Using HAADF/STEM. J. Am. Ceram. Soc. 2010, 93, 1237−1240.
(58) Browning, N. D.; Pennycook, S. J.; Chisholm, M. F.; McGibbon, M. M.; McGibbon, A. J. Observation of Structural Units at Symmetric [001] Tilt Boundaries in SrTiO3.Interface Sci.1995,2, 397−423.
(59) Browning, N. D.; Pennycook, S. J. Direct Experimental Determination of the Atomic Structure at Internal Interfaces.J. Phys. D: Appl. Phys.1996,29, 1779.
(60) Van Aert, S.; Turner, S.; Delville, R.; Schryvers, D.; Van Tendeloo, G.; Salje, E. K. H. Direct Observation of Ferrielectricity at Ferroelastic Domain Boundaries in CaTiO3by Electron Microscopy.
![Table 1. Crystal Structures Reported11along the Pseudocubic Directions [001] in the CLTO Systemp and [100]pa](https://thumb-us.123doks.com/thumbv2/123dok_us/7827300.174385/3.625.325.566.93.395/table-crystal-structures-reported-along-pseudocubic-directions-systemp.webp)
![Figure 4. CLTOSupporting Information x = 0.2 specimen (crushed grain sample) viewedalong the [001]p zone axisthe low magnification image of theparticle used is shown as the upper inset in (a)](https://thumb-us.123doks.com/thumbv2/123dok_us/7827300.174385/6.625.60.300.69.416/figure-cltosupporting-information-specimen-crushed-viewedalong-magnication-theparticle.webp)
![Figure 8. CLTOperovskite structure (top half) to double-layered perovskite (bottom halfHAADF signal gathered during x = 0.9 specimen (same particle as in Figure 9) along the [100]p zone axis](https://thumb-us.123doks.com/thumbv2/123dok_us/7827300.174385/8.625.149.477.62.441/figure-cltoperovskite-structure-perovskite-halfhaadf-gathered-specimen-particle.webp)