City, University of London Institutional Repository
Citation
:
Huo, J., Zhang, J., Liu, Y. & Fu, F. (2017). Dynamic Behaviour and Catenary Action of Axially-restrained Steel Beam Under Impact Loading. Structures, doi:10.1016/j.istruc.2017.04.005
This is the accepted version of the paper.
This version of the publication may differ from the final published
version.
Permanent repository link:
http://openaccess.city.ac.uk/17324/Link to published version
:
http://dx.doi.org/10.1016/j.istruc.2017.04.005Copyright and reuse:
City Research Online aims to make research
outputs of City, University of London available to a wider audience.
Copyright and Moral Rights remain with the author(s) and/or copyright
holders. URLs from City Research Online may be freely distributed and
linked to.
City Research Online: http://openaccess.city.ac.uk/ [email protected]
ACCEPTED MANUSCRIPT
Dynamic Behaviour and Catenary Action of Axially-restrained Steel
Beam Under Impact Loading
**Jingsi Huoa,b; Jinqing Zhang b; Yanzhi Liu b; Feng Fuc
a
College of Civil Engineering, Huaqiao University, 361021, Xiamen, China.
b
China Ministry of Education Key Laboratory of Building Safety and Energy Efficiency, College of Civil Engineering, Hunan University,
c
School of Engineering and Mathematical Sciences, City University London, Northampton Square, London, EC1V 0HB
Abstract: In this paper, the dynamic behaviour and catenary action of axially restrained
steel beam under impact loadings is examined through a combination of experimental
and numerical investigations. It describes and discusses the results of six impact tests on
the axially restrained welded H-beams by means of the drop hammer test machine. The
main behavioural patterns and the key response characteristics including the
development of impact force, deformation and strain, as well as failure modes are
examined, with emphasis on the effect of impact energy and the width to thickness ratio
of beam flange. Finite element models are also developed and validated against the
available testing results. It is demonstrated that the detailed FE model can capture the
response of the welded H-beams under impact loadings. Moreover, the mechanism of
catenary action was identified based on the development of the internal force in the
welded H-beams.
Keywords: restrained steel beam; impact test; finite element simulation; catenary action
ACCEPTED MANUSCRIPT
Introduction
Along with the development of high-rise buildings and long span structures, designers
and researchers pay more and more attention to structure’s progressive collapse caused
by the extreme loading such as blast, impact and earthquake action. Based on the
investigation of the collapse mechanism due to the terrorist attack, various design
guidance has been proposed in many countries. The main mitigating method in these
design guidance is suggested to provide redundant alternative path for force transfer [1],
while some other approaches are proposed to utilize the catenary actions [2-4]. However,
the resistance to the progressive collapse of frame structure is not clear. The way to
utilize the catenary action is still needed to be studied experimentally and numerically.
Some researchers [5-7] performed non-linear finite element modeling for frame
structures and investigated their capacities under the event of progressive collapse.
Simplified methods was also proposed to strengthen the structure and mitigate the
development of progressive collapse [8-9].
In the idealized situations of progressive collapse, the effect of the sudden removal of a
column is similar to the instantaneous application of gravity loads to the floor system. In
such a case, connections within the removed column zone could be subjected to
significant bending moment as well as tensile force. Gradually, the force mechanism
changes into pure tension, which is so-called catenary actions. This is a resisting
ACCEPTED MANUSCRIPT
the ultimate bending state has been reached in the critical sections. In catenary action,
elements (e.g., beams and slabs) that are intended to support flexural loadings undergo
large deformation and have sufficiently stiff and strong anchorages to take on load as
tension members [10]. Kim et al [10] applied non-linear static and dynamic analysis
method to study the advantage of catenary action in resisting progressive collapse of
framed buildings. It was found that in the development of the catenary action, the
bending moment of the connection reduced, while axial force arise gradually with the
vertical displacement increasing.
Many experimental studies and finite element simulations have been performed on the
catenary effect [11-16]. Liu et al [11,12] studied the behaviour of the catenary action in
the beam after the loss of the column. It was concluded that the catenary action can
reduce the bending moment of the beam and effectively resist the progressive collapse
of the structure. He et al [13] carried out experimental studies on concrete frame to
investigate the catenary effect. Testing results stated that the arch action and the
catenary action were formed consecutively. It is also pointed out that the maximum
deformation capacity and tensile capacity are two key factors in resisting the
progressive collapse. Sadek et al [14] also investigated the performance of steel and
reinforced concrete beam-column connection under monotonic vertical displacement of
a center column through an experimental and computational assessment. Huo et al [15]
ACCEPTED MANUSCRIPT
The development of the internal force and the catenary action during the impact testing
were deeply studied. Recently, Li et al [16] examined the catenary behaviour of welded
unreinforced flange bolted web connections under static pushing-down column
displacement by means of full-scale testing and numerical simulation. The bolted
connections have shown robust in withstanding large deformations whilst the resistance
mechanism transitioned to a catenary action phase.
It can be noted from the above literature review that catenary action plays an important
role in resisting the progressive collapse of the frame. However, most of the research
concentrated on the performance of catenary action under static loading conditions.
There is also a clear need for experimental investigation to examine the structure’s
dynamic behaviour and characterize the mechanism of catenary action. Therefore, this
paper deals with the dynamic behaviour and catenary action of axially restrained steel
beam under impact loadings through a combination of experimental and numerical
investigations. It describes and discusses the results of six impact tests on the axially
restrained welded H-beams by means of the drop hammer test machine. The main
behavioural patterns and the key response characteristics including the development of
impact force, deformation and strain, as well as failure modes are examined, with
emphasis on the effect of the width to thickness ratio of beam flange and impact energy.
Finite element models are developed and validated against the available testing data.
ACCEPTED MANUSCRIPT
of the internal force in the welded H-beams.
2.
Experimental programme
2.1Testing set-up and specimen details
Six impact tests on the axially restrained welded H-beams were carried out by means of
the drop hammer test machine at the Center for Integrated Protection Research of
Engineering Structures (CIPRES ) in Hunan University. The testing set-up is depicted in
Fig. 1, where a drop hammer impact force was applied at the mid-span of the steel beam,
and the beam ends were simplified. The drop hammer test equipment was designed with
a maximum drop weight of 980 kg and a maximum drop height of 16 m. The hammer
with certain weight was released at a given height, and fell down along the guide rails to
impact on the middle section of the steel beams. Meanwhile, a high-frequency data
acquisition system was used to record the testing response, including the impact force,
beam deflections and strains at a 5 mHz sampling rate. Fig. 2 shows the location for the
strain gauges. Nine strain gauges were arranged in the flange and the web of the testing
beam. Moreover, a high-speed video camera was employed to capture the beam
deformation from the lateral side within a frequency of 1000 times per second.
In accordance to GB50017-2003, Code for Design of Steel Structures[17], the impact
zone in the steel beam was strengthened by a 10mm thick plate on the upper flange and
ACCEPTED MANUSCRIPT
beam were also stiffened with side plates to avoid the local buckling and fracture. Since
the main investigation in this paper focuses on the effect of width to thickness ratio of
the beam flange as well as the impact energy on the progressive collapse resistance of
the beam, six testing specimens with different bf/tf ratios at different impact loadings
were designed followed by the requirement in the code for Design of Steel Structures
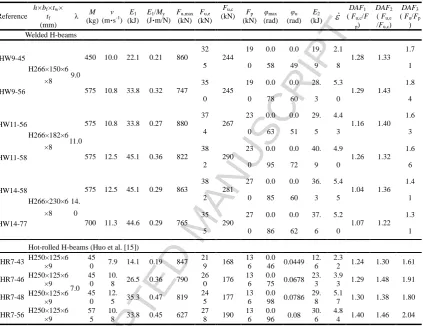
[17]. The designing details were demonstrated in Huo et al. [15]. The details of the
specimens are summarized in Table 1, where HW in the reference stands for welded H
shape section, followed by the width to thickness ratio, the weight of the hammer
(where the number '4' '5' '7' stands for 450 kg, 575 kg and 700 kg, respectively), as well
as the dropping height (where the number '5' '6' '8' '7' stands for 5.0 m, 6.0 m, 8.0 m and
6.5 m, respectively. λ is the width to thickness ratio (bf/tf). M and v are the mass of the
hammer and the velocity of the hammer, respectively. In addition, as depicted in Table 1,
other four impact tests on the hot-rolled H-beams completed by the authors [15] were
also drawn into this paper as comparative data, but the details were presented in Huo et
al. [15]. In the reference of these four beams, HR stands for hot-rolled H shape section,
other items are taken similar to that of welded H-beams.
Furthermore, the corresponding testing results are presented in Table 1, where the
impact energy E1 is obtained from the equation Mv2/2, while E2 is the energy dissipated
by the beams, which can be evaluated by the area below the impact force versus
ACCEPTED MANUSCRIPT
dynamic behavior of steel beams under impact loading, the impact energy is normalized
by the beam yield moment according to the work by Jones and Shen [18].The
normalized impact energy E1/My is also summarized as the ratio between applied impact
energy and beam yield moment. Fu,max is the ultimate impact force taken as the peak
value on the time history curve of impact force. Fu,e is the averaged plateau impact force
which is evaluated by averaging the impact forces at the starting points of the stable
stalemate stage in its time history curve, while Fu,c is the predicted quasi-static
concentrated force based on the testing strain development in the stable stalemate stage
through force balance equation. Whereas, Fp is the plastic capacity of the beam
calculated by the equation Fp=4Mp/l (where Mp is the beam plastic bending capacity,
and l is the beam span). Herein, the ratio of Fu/Fp (or Fu,e/ Fu,c) is defined as the
amplification factor (DAF), where DAF1, DAF2 andDAF3 are presented in Table 1.
is the strain rate equal to the maximum stain εmaxovertime t. The maximum rotation at
the mid-span of the beam φmax and the residual rotation φu are calculated by the
equations φmax=2δmax/l and φu=2δu/l, respectively (δmaxis the maximum deflection of the
beam, and δuis the beam residual deflection).
The beams were all made of Grade Q235 steel. The material properties for the beam
flange and web components as obtained from coupon tests are presented in Table 2.
ACCEPTED MANUSCRIPT
Table 1 summarizes the main response parameters obtained from the impact tests on the
axially restrained welded H-beams, while Figures 3-9 present the deformation patterns
as well as the impact force and displacement relationships. In subsequent sections, the
experimental results and observations from the six welded H-beam specimens are
presented and discussed by considering the influence of the width to thickness ratio and
impact energy on the beam behaviour.
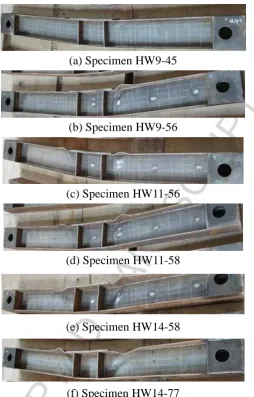
2.2.1 Deformation mode
Fig. 3 shows the deformation patterns observed for the six testing specimens. It can be
observed from Table 1 and Fig. 3 that larger deformation took place when the increasing
impact energy was employed. Moreover, due to the higher width to thickness ratio, the
local deformation for the welded section is larger than that of the hot-rolled section as
described in Huo et al. [15].
Fig. 4 presents the residual deflection shapes of the testing beams in comparison with
the corresponding half-sinusoid curves. It can be observed that the deflection curve
matched well the corresponding half-sinusoid curve. Importantly, the residual
deformation of Specimen HR7-46 is also depicted in Fig. 4 for comparison. It is
obvious that the deflection of Specimen HR11-58 is much larger than that of Specimen
HR7-46, although the same normalized impact energy E1/My was applied. This can be
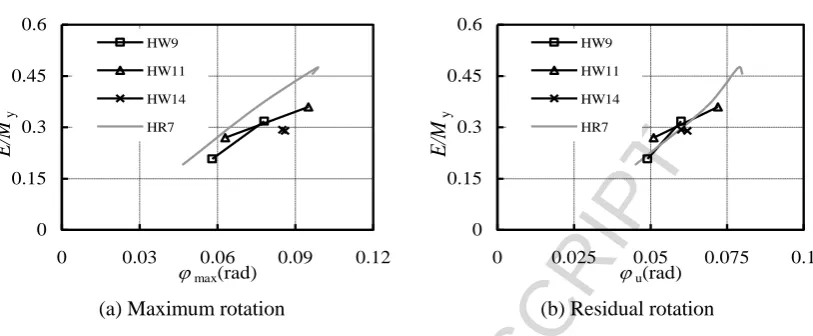
ACCEPTED MANUSCRIPT
further demonstrated in Fig. 5. It is observed from the normalized impact energy-beam
rotation (including the peak and residual rotation at the mid-span) curves that higher
normalized impact energy leaded to larger bending deformation, while less rotation took
place on the beams with lower width to thickness ratio when the same normalized
impact energy was employed.
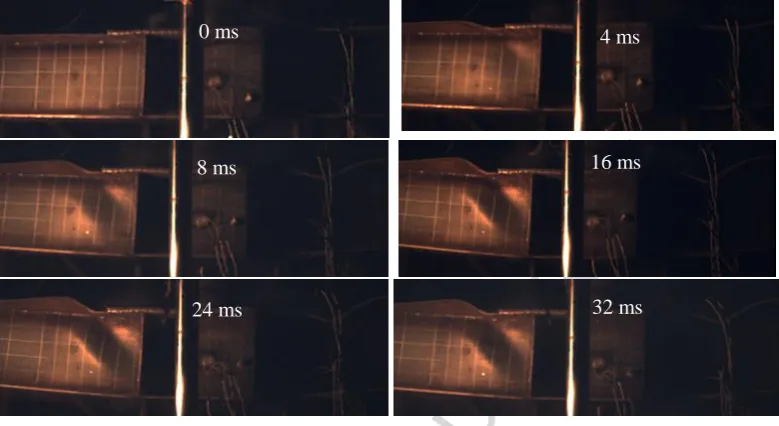
The development of the plastic deformation for the welded beam under impact force
was also recorded by a high speed camera. The captured pictures of the deformation
development for Specimen HW14-76 from 0 ms to 32 ms are illustrated in Fig. 6. It is
observed that the local deformation of the flange and web occurred together with the
beam bending deformation, but the local deformation grew faster and more evident. At
the time of 4 ms, some deformation can be observed near the web stiffener, but slight
beam global deformation happened. In the next 4-ms step, local buckling occurred at the
top flange in the middle beam, while shear deformation was observed at the web near
the web stiffener with little global deformation. Afterwards, beam global deformation
started to develop rapidly and reached its maximum rotation value at the time of around
24 ms. The beam bending then rebounded as the impact force descended till the end of
the testing. These are discussed in more detail in subsequent sections through the impact
force and deformation relationships.
ACCEPTED MANUSCRIPT
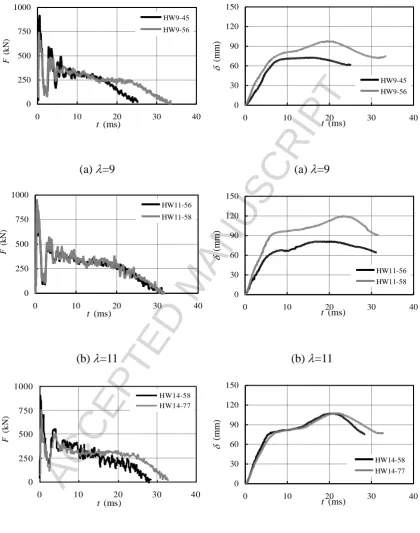
The time history curves of impact force as well as the mid-span displacement for six
welded H-beams are depicted in Fig. 7 and Fig. 8, respectively. According to their
dynamic response in Fig. 7, three stages can be divided in the time history curve of
impact force, including the impact stage, stable stalemate stage and the decaying stage.
In the first stage, impact force reached to its maximum value in a very short period of
time mostly attributed to the presence of inertia force. A fluctuant descending segment
then took place as a result of the complex contact condition between the impact hammer
and the beam, followed by an about 18 ms platform. The plateau impact force, Fu,e as
depicted in Tabel 1, was evaluated by averaging the impact forces at the starting points
of this platform, which was assumed as the value of impact load without considering the
effect of inertia force. And in the final stage, the impact force declined slowly as the
impact hammer left from the beam. The similar trend was also described for the
hot-rolled beams elsewhere [15,19].
Meanwhile, Fig. 8 illustrates the time history curves of the mid-span displacement for
all specimens in correspondence to the impact force-time relationships. Herein four
stages were involved in the displacement-time history curves, the elastic deformation,
inelastic deformation, constant deformation and rebound deformation. It is observed
from Fig. 7 and Fig. 8 that the beam displacement remained elastic in the initial
fluctuation, while the plastic displacement developed rapidly when the impact force
ACCEPTED MANUSCRIPT
displacement grew up gently and gradually kept in a short platform. Afterwards, the
beam displacement fell down with the impact force decreasing.
Furthermore, it is very important to note from Fig. 7 and Fig. 8 that the influence of the
impact energy on the peak impact force and the development of the impact force can be
negligible, but the larger impact energy results in higher impact duration and beam
deformation. Also, the welded H-beam with larger width to thickness ratio generated
lower mid-span displacement subjected to the same applied impact energy in
comparison to the specimen with less width to thickness ratio, as illustrated between
Specimens HW9-56 and HW11-56 as well as between Specimens HW11-58 and HW
14-58 in Fig. 8. It can be also further confirmed from the definition of normalized
impact energy. As depicted in Fig. 5, the ultimate and residual rotation of Specimen
HW9-56 was larger than that of Specimen HW11-56, as the normalized impact energy
of the former was evaluated higher than the latter when considering the effect of width
to thickness ratio. It is also stated that the resistance to the impact loadings of the
welded H-beam can be improved with the decreasing width to thickness ratio. But the
larger beam flange width led to the relatively obviously local buckling deformation, as
depicted in Fig. 3. Correspondingly, the mechanism of catenary action was developed
more difficultly for the welded H-section beams with larger width to thickness ratio, in
comparison with that for the hot-rolled H-section examined by Huo et al. [15].
ACCEPTED MANUSCRIPT
The impact force-rotation relationships for six testing beams are shown in Fig. 9, where
the beam rotation φ is obtained from the mid-span displacement δ by means of the
equation φ=2δ/l (l is the span of the testing beam). Similar to the time history of impact
force, the impact force-rotation curves can also be featured as an initial fluctuation and a
platform before the rebound of the hammer. In the initial stage, one prompt wave can be
observed, but the slope of the descending segment was much less than that of the
ascending one. It is indicated that the large rotation occurred on the beam after the peak
point. It is also found that in the initial stage the total rotation of the beams with the
same section size increased with the higher employed impact energy. In the second
stage, the rotation continued to develop. After some relatively gentle fluctuations, the
curve came into a plateau. As viewed in Fig. 9, the impact force and the rotation of the
beam then started to rebound due to the leave of the hammer from the beam surface.
2.2.4 Analysis of internal force
Fig. 10 presents the time history of strain at the mid-span section for Specimens
HW11-56 and HW11-58 under impact, while Fig. 11 summarizes the development of
axial strain along the height of the mid-span section for Specimens HW11-56 and
HW11-58 during the test according to the strain values at the location of S1, S3, S5, S2,
respectively, where η stands for the relative position of the strain along the height of the
cross section (η=h′/h). In addition, due to accident of the data logger system during the
ACCEPTED MANUSCRIPT
the value of S2 after this moment in Fig. 10(b) makes no sense. It can be seen from Fig.
6 that in initial 1 ms the beam is still in the elastic stage, where the elastic moment Me
can be calculated by Me=σ∙Wx (σ can be derived from the mid-section strain through a
hardening stress-strain model without considering the strain-rate effect, Wx is the
bending modulus of welded H-beam section). Afterwards, the strain at the beam flange
increased dramatically to the yield point. But the neutral axis was still kept at the middle
of the mid-span section, as indicated in Fig. 11(a) at the rotation of 0.007 rad and 0.020
rad for Specimen HW11-56, and Fig. 11(b) at the rotation of 0.011 rad and 0.025 rad for
Specimen HW11-58. As the plastic moment capacity Mp equates to fy∙Wxp, the yield load
Fp can be work out through Equation Fp=4Mp/l based on bending mechanism. This
calculation approach takes no consideration on the effect of catenary action, which
resulted in lower estimation than the value Fu,e obtained from testing data. In the stable
stage, S5 increased quickly and S3 changed from compression into tension as observed
in Fig. 10. Moreover, Fig. 11 demonstrated that the neutral axis positioned higher at the
rotation of 0.045 rad and 0.052 rad for Specimen HW11-56, and 0.057 rad and 0.074
rad for Specimen HW11-58. It can be concluded that axial force developed on the beam
at this stage.
Based on the strain values (Gauges S1, S2, S3 and S5) in the mid-section of the beam,
the developed moment M and axial force N was integrated through the condition of
internal force equivalence. Eventually, the relationship of the moment and axial force at
ACCEPTED MANUSCRIPT
18 in the comparison with the numerical results, which will be further described and
discussed in Section 4. Moreover, as the impact force remained plateau in the stable
stage, a quasi-static impact force, Fu,c, was derived from Equation Mu=(Fu-2Niφi)∙L/4
corresponding to the plateau impact force Fu,e. It is found that herein the predicted
concentrated load, Fu,c, was determined without considering the dynamic loading effect,
i.e. the strain-rate effect.
In a whole, the yield load Fp, the impact plateau force Fu,e and the predicted
concentrated load Fu,c are clearly stated in above discussion, and summarized in Table 1.
Evidently, the amplification factor DAF1, Fu,c/Fp depicted in Table 1,indicates the effect
of the catenary action on the load-carrying capacity of the axially restrained steel beams.
It is shown from the amplification factor DAF1 that the load-carrying capacities was
increased by an average of 18% for the welded H-steel beams and 30% for the
hot-rolled H-steel beams due to the effect of the catenary action. The amplification
factor DAF2, Fu,e/Fu,c, considers the effect of the dynamic load on the load-carrying
capacity of the axially restrained steel beams. The beam load-carrying capacities was
increased by an average of 34% for the welded H-steel beams and 40% for the
hot-rolled H-steel beams due to dynamic effect and strain hardening. The amplification
factor DAF3, Fu,e/Fp,is the ratio of the impact loads and the plastic loads based on
bending mechanism. In comparison with the static flexural resistance, the anti-impact
loads was increased by an average of 60% and 71% for the welded and hot-rolled
ACCEPTED MANUSCRIPT
beams was obviously deteriorated with the increase of the ratio of flange width to
thickness. It can be attributed to the premature local buckling of beam flange.
3.
Numerical assessment
This section describes a detailed finite element model for welded H-beam under impact,
as assessing their behaviour based on experimental investigations is a cost-prohibitive
and time-consuming task. The proposed continuum finite element models were
developed by means of the commercial FE software ABAQUS [20]. The model
characteristics are described below. These models are then validated against the
experimental results and observations presented above. Particular emphasis is given in
the discussion presented below to aspects related to the development of the inner forces
and the energy dissipation.
3.1Finite element modelling
3.1.1 Modelling details
A three-dimensional finite element was developed herein for six impact tests on the
axially restrained welded H-beams, as depicted in Fig. 12. The impacted beam as well
as the hammer were conducted by means of different elements. It has been pointed out
in Reference [21] that beam element cannot accurately simulate the detailed response of
ACCEPTED MANUSCRIPT
shear stress caused by the blast and fire, and the numerical models with beam elements
led to the overestimated resistance of the beam subjected to the impact loading.
Therefore, the proposed models in this paper make use of the eight-node brick solid
elements of Type C3D8R available in the ABAQUS library [20] to represent the
impacted beam and the drop hammer, as shown in Fig. 12. In order to simplify the FE
model and improve the convergence, the length of the beam was set as 2500 mm (the
distance between hole centers of the tested beam), and the ends of the beam model were
strengthened with endplates but without the holes, as shown in Fig.12. Meanwhile, the
translational displacement of both beam end sections was constrained, but the rotation
was free. A number of mesh sensitivity studies were also carried out in order to arrive at
an optimum representation, which involves a comparatively finer mesh for mid-span
beam part in contact with the drop hammer and the hammer, whereas a relatively
coarser mesh was employed elsewhere.
In addition, as no tearing displacement was observed around the welds during the
impact test, welds between the beam flanges and webs as well as those between the
beam and stiffeners were modeled by tying together providing an all-freedom coupling
of the contact surfaces. Importantly, the contact between the hammer and beam surface
was considered by means of explicit ABAQUS contact definitions, named as ‘General
contact’, where a ‘hard’ surface contact was defined in the normal direction, while a
ACCEPTED MANUSCRIPT
0.2 according to the corresponding research on the dynamic friction factors [22]. The
boundary conditions and loading procedure adopted in the numerical analyses replicated
those used in the experimental studies described in previous sections. The impact energy
was achieved through the application of impact velocity on the hammer with mass
definition at the moment that the hammer contact the beam surface.
3.1.2 Material property
The static stress-strain relationships for all the beam components were defined by a
bilinear plastic hardening rule with an elastic modulus of 1.80×10⁷ MPa and a poison’s
ratio of 0.3, as illustrated in Fig. 13. Table 2 provides the static mechanical properties of
the beam flange and beam web. However, the true stress and strain in material model
were converted from the engineering stress and strain in Table 2 based on Eq. 1 and Eq.
2, respectively. As described in Section 2, the specimens herein suffered from high
impact loadings, the strain rate effect was also taken into account in these models.
ABAQUS library [20] offers two constitutive models to consider the strain rate effect,
the Johnson-Cook model [23] and the Cowper-Symonds model [24]. Herein the
Cowper-Symonds model was employed to simulate the strain rate effect. Eq. 3
demonstrates the constitutive equation of Cowper-Symonds model, where 'o is the
dynamic stress at a uniaxial strain rate , o is the static stress. D and q are two
constants defined for one material. For the mild steel, the value of D and q was
ACCEPTED MANUSCRIPT
reasonable agreements with the experimental data [21,25-27]. However, these two
values are defined at very small strains [28]. For material under large plastic strains, D
and q are usually evaluated as 6844 and 3.91 [28], respectively. In this paper, the latter
was chosen for beam components with severe local buckling under impact.
trueeng(1eng) (1)
trueln(1true) (2)
q
D
/ 1
0 0
1
(3)
3.2Validation of FE models
The developed FE model above was employed to simulate the tests from the
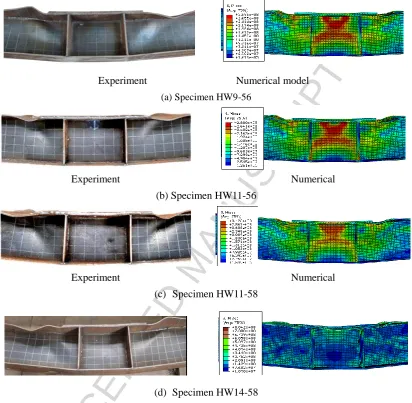
experimental programme described in Section 2. The comparisons of deformation
patterns observed in experimental and numerical models are described for selected
specimens in Fig. 14. It is shown that the deformations and plastic mechanisms are
replicated by the proposed FE model. Moreover, the experimental and numerical impact
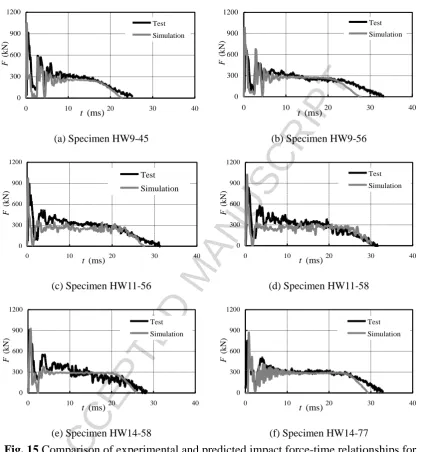
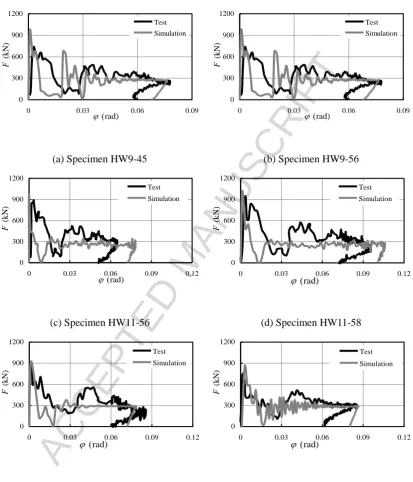
force-time relationships as well as impact force-rotation curves are presented in Figs.
15-16, respectively. As demonstrated in Fig. 15, the peak impact force and plateau force,
as well as impact period match reasonably well the experimental behaviour for all
specimens. In the case of Specimens HW11-56, HW11-58, HW14-58 and HW14-77,
ACCEPTED MANUSCRIPT
this stage, contact between impact hammer and the beam was complex, which led to the
difference for FE model to capture. Furthermore, close correlation is also observed in
the impact force- rotation curves from experimental and numerical models as shown in
Fig. 16. It is evident from the comparisons that the FE models provide a good prediction
of the experimental behaviour in all cases. This good agreement between the FE
simulations and the test results shows that the detailed FE model can capture the
response of the welded H-beams under impact loadings.
Having gained confidence in the reliability of the detailed FE model, this is used in
subsequent sections to investigate the development of the internal force and dissipated
energy in comparison with the corresponding testing results, as depicted in Fig. 17 and
Fig. 18, respectively. The development of internal force simulated by FE models will be
described and discussed in details in Section 4.
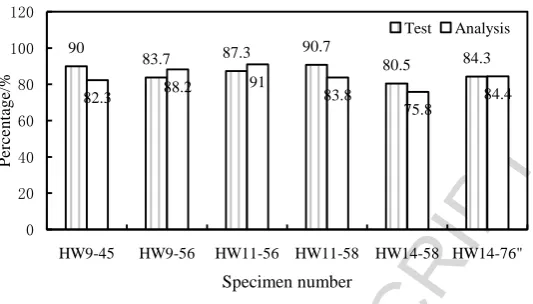
In order to investigate the energy dissipation under the impact loading, the dissipated
energy obtained from experiment and FE models was evaluated by calculating the area
of impact force-rotation curves shown in Fig. 16 multiplied by half length of the beam.
It can be seen from Fig. 17 that the dissipation ratio for all specimens is around 80%~
90%. It is also observed from the comparison between experimental and FE results that
reasonable estimates were obtained in all cases. The slight differences can be attributed
to the idealized simulation of the friction between the hammer and the dropping rail as
ACCEPTED MANUSCRIPT
4.
Discussion of Catenary action
The main behavioural patterns and the key response characteristics including the
development of impact force, deformation and strain, as well as failure modes were
examined above through experimental and numerical investigation. This section further
describes and discusses the development of internal force as well as catenary action for
all the specimens.
Fig. 18 depicts the relationship of the moment and axial force at the mid-span section to
the rotation obtained from experimental and numerical results for all specimens, where
Mp and Np was the plastic bending and axial capacity, respectively. The testing values of
M and N were integrated by the derived stress corresponding to the testing strain in the
mid-span section (including S1, S3, S5 and S2 as summarized in Fig.10), while
numerical M and N were then adopted directly from the FE models.
It is evident from the experimental M-N curves in Fig. 18 that the beam axial force
developed gradually after the beam yield due to the bending force. This can be further
confirmed from the strain distribution of mid-span section at the rotation of 0.056 rad
and 0.063 rad for Specimen HW11-56, and 0.078 rad and 0.095 rad for Specimen
HW11-58 in Fig. 10, where the tension strain located at most of the mid-span section
but with development of a little compression strain. As expected, the axial force may
ACCEPTED MANUSCRIPT
internal force of the beam sections may be developed mostly from the axial force, which
is known as catenary action. Due to the limited impact energy, the developed axial force
of all specimens were lower than its plastic capacity as shown in Fig. 18, but the
maximum rotation of the beam specimens was nearly close to 0.1 rad. It is shown that
the welded H-beam was strong enough to develop catenary action. Furthermore, it is
found that the development tendency of catenary action for the welded H-beams was
consistent with the conclusion in other similar researches [5,10].
The interaction trend obtained from numerical simulations was similar to the testing
results. The axial force developed gradually in the beam. This can be also confirmed
from the FE deformation modes with stress nephogram in Fig. 19, as further discussed
below.
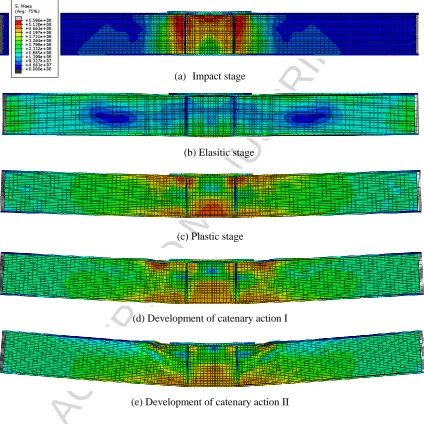
Fig.19 depicts the distribution of Von Misses stress for Specimen HW11-56 at four
significant stages. Herein, Specimen HW11-56 is taken as a typical example for a more
detailed discussion on the development of catenary action. It is evidently observed from
the identification of the key deformation stages that the development of catenary action
was happening in the welded H-beam. At the impact instant, the maximum impact force
was achieved as discussed from the testing results. Moreover, it is observed from the
Von Misses stress distribution in Fig. 19(a) that the compression stress developed in the
mid-span beam due to the inverted arch effect under suddenly applied impact load. It is
ACCEPTED MANUSCRIPT
beam in the sudden impact, as the large impact forces were mainly undertook by the
inertia of the structure before the forces reached the beam supports. Saatci and Vecchio
[29] also performed an experimental programme on the reinforced concrete beam under
impact loads, and the same conclusion was drawn that negative bending moment
formed at the initial stage of impact response through experimental observation and
theoretical analysis. After the peak impact force, the beam rebounded and worked
normally like a static structure. Initially, the beam deformation remained elastic as
shown in Fig. 19(b). Afterwards, a fluctuant descending impact force took place, but the
beam bending moment grew rapidly in order to resist the impact energy. It is also stated
from the deformation patterns and stress distribution in the mid-span beam in Fig. 19(c)
that the plasticity occurred at this stage. When the impact force tended to be stable, the
beam moment also kept unchanged. However, the tension force then raised gradually in
the specimen. It can be clearly shown from Fig. 19(d) and (e) that the beam deformation
shape was gradually close to catenary line, and the tension stress took over most of the
beam middle sections. It is stated that the catenary mechanism took place at the welded
H-beam.
Based on the testing and numerical result, it can be concluded that the internal force of
beam changed from pure bending into combination of bending and axial force during
the impact procedure. This development of the catenary action was clearly described
ACCEPTED MANUSCRIPT
5.
Conclusion
The dynamic behaviour and catenary action of axially restrained steel beam under
impact loadings have been examined by means of experimental and numerical studies.
An experimental program comprising six impact tests on the axially restrained welded
H-beams has been described in details. The main behavioural patterns and the key
response characteristics including the development of impact force, deformation and
strain, as well as failure modes are examined.
It was shown that higher impact energy resulted in more obvious local buckling
deformation, especially for the welded H-beams with larger width to thickness ratio.
Importantly, it was noted that the influence of impact energy on the peak impact force
and the development of the impact force can be negligible, but the larger impact energy
results in higher impact duration. When the effect of width to thickness ratio was taken
into account, beam deflection was proportionally related to the corresponding
normalized impact energy. The increasing ratio of flange width to thickness remarkably
deteriorated the impact resistance of steel beams. Moreover, it is shown that the beam
load-carrying capacity was significantly improved when considering the effect of
catenary action and dynamic effect.
Nonlinear finite element models have been also developed and calibrated against the
experimental results. In general, the numerical estimations were found to correlate well
ACCEPTED MANUSCRIPT
impact force. It is demonstrated that the detailed FE model can capture the response of
the welded H-beams under impact loadings.
Furthermore, the mechanism of catenary action was also identified based on the
development of the internal force for the welded H-beams through a combination of
experimental and numerical investigation. It is shown that the development tendency of
catenary action for the welded H-beams was consistent with the conclusion in other
similar researches.
Acknowledgement
The financial support of National Natural Science Foundation for the project (51078139)
research described in this paper is gratefully acknowledged. The authors would also like
to thank the support of the Program for New Century Excellent Talents in University
(NCET-11-0123). Additionally, the authors are grateful to the support with the
experimental work at the Center for Integrated Protection Research of Engineering
Structures (CIPRES), as well as Ministry of Education Key Laboratory of Building
Safety and Efficiency in Hunan University.
Reference
[1] ASCE. Minimum Design Loads for Buildings and Other Structures. Reston,
ACCEPTED MANUSCRIPT
[2] Unified Facilities Criteria (UFC). Design of Buildings to Resist Progressive
Collapse. 2005.
[3] National Institute of Standard and Technology (NIST). Best Practices for Reducing
the Potential for Progressive Collapse in Buildings. 2007.
[4] Fu F. Progressive collapse analysis of high-rise building with 3-D finite element
modeling method. Journal of Constructional Steel Research, 2009, 65(6):
1269-1278.
[5] Lee C, Kim S, Han K, et al. Simplified nonlinear progressive collapse analysis of
welded steel moment frames. Journal of Constructional Steel Research, 2009, 65(5):
1130-1137.
[6] Yu M, Zha X X, Ye J Q. The influence of joints and composite floor slabs on
effective tying of steel structures in preventing progressive collapse. Journal of
Constructional Steel Research, 2010, 66(3): 442-451.
[7] Wang K Q, Li G Q, Yang T C. A study of restrained steel beams with catenary
action under distributed load—Part I: theoretical model. China Civil Engineering
Journal, 2010, 43(1): 1-7.
[8] Valipour HR, Bradford M. An efficient compound-element for potential progressive
collapse analysis of steel frames with semi-rigid connections. Finite Elements in
Analysis and Design, 2012, 60: 35-48.
ACCEPTED MANUSCRIPT
multi-storey buildings due to sudden column loss – part I: simplified assessment
framework. Engineering Structure, 2008, 30:1308–18.
[10]Kim J, An D. Evaluation of progressive collapse potential of steel moment frames
considering catenary action. The Structure Design of Tall and Special Buildings,
2009, 18(4): 455-465.
[11]Liu J L. Preventing progressive collapse through strengthening beam-to-column
connection, Part 1: Theoretical analysis. Journal of Constructional Steel Research,
2010, 66 (2): 229-237.
[12]Liu J L. Preventing progressive collapse through strengthening beam-to-column
connection, Part 2: Finite element analysis. Journal of Constructional Steel
Research, 2010, 66(2): 238-247.
[13]He Q F, Yi W J. Experimental study of the collapse-resistant behavior of RC
beam-column sub-structures considering catenary action. China Civil Engineering
Journal, 2011, 44(4): 52-59.
[14]Sadek F, Main JA, Lew HS, Bao YH. Testing and analysis of steel and concrete
beam-column assemblies under a column removal scenario. Journal of Structural
Engineering, 2011, 137: 881-892.
[15]Huo J S, Zhang J Q, Chen B S, et al. Dynamic behaviours of hot-rolled steel bemas
under drop weight impact loading. Journal of Building Structures, 2011, 32(12):
ACCEPTED MANUSCRIPT
[16]Li L, Wang W, Chen Y, Lu Y. Effect of beam web bolt arrangement on catenary
behaviour of moment connections. Journal of Constructional Steel Research, 2015,
104: 22-36.
[17]GB50017—2003. Code for design of steel structures. Beijing: China Planning Press,
2003. (in Chinese))
[18]Jones N, Shen WQ. A theoretical study of the lateral impact of fully clamped
pipelines. Proc Inst Mech Eng Part E J Process Mech Eng, 1992, Vol.206: 129-46.
[19]Fujikake K, Li B, Soeun S. Impact response of reinforced concrete beam and its
analytical evaluation. Journal of Structure Engineer, 2009,135(8), 938-950.
[20]ABAQUS. ABAQUS theory manual, version 6.7. Hibbit. Karlsson and Sorensen.
Inc.; 2003.
[21]Symonds P S. Survey of methods of analysis for plastic deformation of structures
under dynamic loading. Brown University, Division of Engineering Report,
BU/NSRDC, 1967, 1-67.
[22]Munoz-Garcia E, Davison J B, Tyas. An analysis of the response of structural bolts
subjected to rapid rates of loading. In: Euro steel Conference on Steel and
Composite Structures, Maastricht, The Netherlands, 2005.
[23]Johnson, G.R. and Cook, W.H. A constitutive model and data for metals subjected to
large strains, high strain rates and high temperatures. Proceeding of the seventh
ACCEPTED MANUSCRIPT
541-547.
[24]Cowper, G.R. and Symonds, P.S. Strain hardening and strain-rate effects in the
impact loading of cantilever beams. Brown University Division of Applied
Mathematics Report No. 28, 1957.
[25]Izzuddin B A, Song L, Elnashi A S, Dowling P J. An integrated adaptive
environment for fire and explosion analysis of steel frame, Part Ⅱ: Verification
and application. Journal of Constructional Steel Research, 2000, 53(1): 87-111.
[26]Liew R, Chen H. Inelastic transient analysis of steel frame subjected to explosion
and fire. Department of Civil Engineering, National University of Singapore. 2002.
[27]Chen H, Liew R. Explosion and fire analysis of steel frame using mixed element
approach. Journal of Engineering Mechanics, 2005, 131(6): 606-616.
[28]Jones, N. Structural Impact, Cambridge University Press, Cambridge,1989,
411-441.
[29]Saatci S and Vecchio FJ. Effects of shear mechanisms on impact behavior of
ACCEPTED MANUSCRIPT
Figures
(a) Schematic representation
(b) General view of impact test
Fig. 1 Impact test setup for axially restrained steel beam (Unit: mm) 2000 8 50 Steel beam H382×350×16×16 H 3 8 2 × 3 5 0 × 16 × 16
8.8 high strength bolt, d=24mm H 3 8 2 × 3 5 0 × 16 × 16 4200
H282×250×16×16 H282×250×16×16
ACCEPTED MANUSCRIPT
Fig. 2 Details of restrained steel beam and location of the strain gauges
1000 300 1000
150
2500 2800
100 100 150
S1
S2
h
tf
tw
S1 S3 S5 S8
300 tf
S4 S7
300
S2 S5
S8 S6 S9 S3
ACCEPTED MANUSCRIPT
(a) Specimen HW9-45
(b) Specimen HW9-56
(c) Specimen HW11-56
(d) Specimen HW11-58
(e) Specimen HW14-58
(f) Specimen HW14-77
[image:32.595.174.429.116.514.2]ACCEPTED MANUSCRIPT
-120 -90 -60 -30 0
0 500 1000 1500 2000 2500
Span(mm)
Lat
er
al
def
lect
ion (
m
m
) HW9-45 HW9-56
HW11-56 HW11-58
HW14-58 HW14-77
HR7-46
ACCEPTED MANUSCRIPT
00.15 0.3 0.45 0.6
0 0.03 0.06 0.09 0.12
jmax(rad)
E/M
y
HW9 HW11 HW14 HR7
0 0.15 0.3 0.45 0.6
0 0.025 0.05 0.075 0.1
ju(rad)
E/M
y
HW9 HW11 HW14 HR7
(a) Maximum rotation (b) Residual rotation
Fig.5 Normalized impact energy-beam rotation curves for all specimens divided by width-thickness ratio
[image:34.595.94.501.143.311.2]ACCEPTED MANUSCRIPT
Fig. 6 Deformation development for Specimen HW14-76 from 0 ms to 32 ms
8 ms 16 ms
0 ms 4 ms
[image:35.595.102.492.135.348.2]ACCEPTED MANUSCRIPT
0 250 500 750 10000 10 20 30 40
t (ms)
F (k N ) HW9-45 HW9-56 0 30 60 90 120 150
0 10 20 30 40
t (ms)
d (m m ) HW9-45 HW9-56
(a) =9 (a) =9
0 250 500 750 1000
0 10 20 30 40
t (ms)
F ( k N ) HW11-56 HW11-58 0 30 60 90 120 150
0 10 20 30 40
t (ms)
d
(mm
)
HW11-56
HW11-58
(b) =11 (b) =11
0 250 500 750 1000
0 10 20 30 40
t (ms)
F (k N ) HW14-58 HW14-77 0 30 60 90 120 150
0 10 20 30 40
t (ms)
d (m m ) HW14-58 HW14-77
(c) =14 (c) =14
Fig. 7 Time history curves of impact force for all specimens
[image:36.595.92.513.131.665.2]ACCEPTED MANUSCRIPT
0 250 500 750 1000
0 0.03 0.06 0.09 0.12
j (rad)
F
(
k
N
)
HW9-45, E=22.1KJ HW9-56, E=33.8KJ
0 250 500 750 1000
0 0.03 0.06 0.09 0.12
j (rad)
F
(k
N
)
HW11-56, E=33.8KJ HW11-58, E=45.1KJ
(a) =9 (b) =11
0 250 500 750 1000
0 0.03 0.06 0.09 0.12
j (rad)
F
(k
N
)
HW14-58, E=45.1KJ HW14-77, E=44.6KJ
(c) =14
ACCEPTED MANUSCRIPT
-40000 -30000 -20000 -10000 0 10000 20000 30000 40000
0 5 10 15 20 25 30 35 40
t (ms)
/m
S1 S2 S3 S5 S8
-40000 -30000 -20000 -10000 0 10000 20000 30000 40000
0 5 10 15 20 25 30 35 40
t (ms)
/m
S1 S2 S3 S5 S8
ACCEPTED MANUSCRIPT
-30000 -20000 -10000 0 10000 20000 30000
0 0.25 0.5 0.75 1
/m
0.007rad, 0.020rad
0.045rad, 0.052rad
0.056rad, 0.063rad
-40000 -30000 -20000 -10000 0 10000 20000 30000 40000
0 0.25 0.5 0.75 1
/m
0.011rad, 0.025rad
0.057rad, 0.074rad
0.078rad, 0.095rad
ACCEPTED MANUSCRIPT
ACCEPTED MANUSCRIPT
Fig. 13 Linear hardening model for steel material ε
σ
εu
ACCEPTED MANUSCRIPT
Experiment Numerical model
(a) Specimen HW9-56
Experiment Numerical
(b) Specimen HW11-56
Experiment Numerical
(c) Specimen HW11-58
[image:42.595.91.504.149.552.2]
(d) Specimen HW14-58
ACCEPTED MANUSCRIPT
0 300 600 900 12000 10 20 30 40
t (ms)
F ( k N ) Test Simulation 0 300 600 900 1200
0 10 20 30 40
t (ms)
F ( k N) Test Simulation
(a) Specimen HW9-45 (b) Specimen HW9-56
0 300 600 900 1200
0 10 20 30 40
t (ms)
F ( k N ) Test Simulation 0 300 600 900 1200
0 10 20 30 40
t (ms)
F ( k N) Test Simulation
(c) Specimen HW11-56 (d) Specimen HW11-58
0 300 600 900 1200
0 10 20 30 40
t (ms)
F ( k N) Test Simulation 0 300 600 900 1200
0 10 20 30 40
t (ms)
F ( k N) Test Simulation
[image:43.595.87.510.140.593.2](e) Specimen HW14-58 (f) Specimen HW14-77
ACCEPTED MANUSCRIPT
0 300 600 900 12000 0.03 0.06 0.09
j (rad)
F ( k N ) Test Simulation 0 300 600 900 1200
0 0.03 0.06 0.09
j (rad)
F ( k N ) Test Simulation
(a) Specimen HW9-45 (b) Specimen HW9-56
0 300 600 900 1200
0 0.03 0.06 0.09 0.12
j (rad)
F ( k N ) Test Simulation 0 300 600 900 1200
0 0.03 0.06 0.09 0.12
j (rad)
F ( k N) Test Simulation
(c) Specimen HW11-56 (d) Specimen HW11-58
0 300 600 900 1200
0 0.03 0.06 0.09 0.12
j (rad)
F ( k N) Test Simulation 0 300 600 900 1200
0 0.03 0.06 0.09 0.12
j (rad)
F ( k N) Test Simulation
[image:44.595.98.512.154.637.2](e) Specimen HW14-58 (f) Specimen HW14-77
ACCEPTED MANUSCRIPT
80.5 91
83.8
84.3 90.7
87.3 83.7
90
84.4
82.3 88.2
75.8
0 20 40 60 80 100 120
HW9-45 HW9-56 HW11-56 HW11-58 HW14-58 HW14-76"
Specimen number
P
er
ce
n
ta
g
e/
%
[image:45.595.168.435.142.294.2]Test Analysis
ACCEPTED MANUSCRIPT
-0.3 0 0.3 0.6 0.9 1.2 1.50 0.02 0.04 0.06 0.08
j(rad) M /M p -0.3 0 0.3 0.6 0.9 1.2 1.5 M/Mp (test) M/Mp (FEA) N/Np (test) N/Np (FEA) -0.3 0 0.3 0.6 0.9 1.2 1.5
0 0.02 0.04 0.06 0.08 j(rad) M/ M p -0.3 0 0.3 0.6 0.9 1.2 1.5 M/Mp (test) M/Mp (FEA) N/Np (test) N/Np (FEA)
(a) HW9-45 (b) HW9-56
-0.3 0 0.3 0.6 0.9 1.2 1.5
0 0.02 0.04 0.06 0.08 j(rad) M/ M p -0.3 0 0.3 0.6 0.9 1.2 1.5 M/Mp (test) M/Mp (FEA) N/Np (test) N/Np (FEA) -0.3 0 0.3 0.6 0.9 1.2 1.5
0 0.02 0.04 0.06 0.08 0.1 j(rad) M/ M p -0.3 0 0.3 0.6 0.9 1.2 1.5 M/Mp (test) M/Mp (FEA) N/Np (test) N/Np (FEA)
(c) HW11-56 (d) HW11-58
-0.3 0 0.3 0.6 0.9 1.2
0 0.02 0.04 0.06 0.08 0.1 j(rad) M/ M p -0.3 0.2 0.7 1.2 M/Mp (test) N/Np (test) M/Mp (FEA) N/Np (FEA) -0.3 0 0.3 0.6 0.9 1.2
0 0.02 0.04 0.06 0.08 0.1 j(rad) M/ M p -0.3 0 0.3 0.6 0.9 1.2 1.5 M/Mp (test) M/Mp (FEA) N/Np (test) N/Np (FEA)
(e) HW14-58 (f) HW14-77
ACCEPTED MANUSCRIPT
Fig. 18 Moment versus rotation and axial load versus rotation relations of restrained steel beams
(a) Impact stage
(b) Elasitic stage
(c) Plastic stage
(d) Development of catenary action I
[image:47.595.88.513.194.618.2](e) Development of catenary action II
ACCEPTED MANUSCRIPT
[image:48.595.86.510.190.516.2]Tables
Table 1 Details of testing specimens
Note: In the reference, HW and HR stand for welded and hot-rolled H shape sections, followed by the width-thickness ratio, the weight of the hammer (where the number '4' '5' '7' stands for 450 kg, 575 kg and 700 kg, respectively), as well as the dropping height (where the number '5' '6' '8' '7' stands for 5.0 m, 6.0 m, 8.0 m and 6.5 m, respectively. λ is the width thickness ratio (bf/tf). M and v are the mass and the velocity of the testing
hammer, respectively.
Table 2 Static material properties of welded H-beam components Components fys(MPa) fu(MPa) fu/fys
Elongation
rate % Es (MPa)
HW web 267.8 386.7 1.44 20.7 1.78×10⁵
HW flange 296.7 440.5 1.48 21.3 1.81×10⁵
Reference
h×bf×tw×
tf
(mm)
λ M
(kg)
v
(m•s-1) E1
(kJ)
E1/My
(J•m/N)
Fu,max
(kN)
Fu,e
(kN)
Fu,c
(kN) Fp
(kN) φmax (rad) φu (rad) E2
(kJ)
DAF1
( Fu,c/F
p)
DAF2
( Fu,e
/Fu,c)
DAF3
( Fu/Fp
) Welded H-beams
HW9-45
H266×150×6
×8 9.0
450 10.0 22.1 0.21 860
32 5 244 19 0 0.0 58 0.0 49 19. 9 2.1 8
1.28 1.33
1.7
1
HW9-56 575 10.8 33.8 0.32 747
35 0 245 19 0 0.0 78 0.0 60 28. 3 5.3 0
1.29 1.43
1.8
4
HW11-56
H266×182×6
×8 11.0
575 10.8 33.8 0.27 880
37 4 267 23 0 0.0 63 0.0 51 29. 5 4.4 3
1.16 1.40
1.6
3
HW11-58 575 12.5 45.1 0.36 822
38 2 290 23 0 0.0 95 0.0 72 40. 9 4.9 0
1.26 1.32
1.6 6 HW14-58 H266×230×6 ×8 14. 0
575 12.5 45.1 0.29 863
38 2 281 27 0 0.0 85 0.0 60 36. 3 5.4 5
1.04 1.36
1.4
1
HW14-77 700 11.3 44.6 0.29 765
35 5 290 27 0 0.0 86 0.0 62 37. 6 5.2 0
1.07 1.22
1.3
1
Hot-rolled H-beams (Huo et al. [15])
HR7-43 H250×125×6
×9
7.0 45
0 7.9 14.1 0.19 847
21
9 168
13 6
0.0
46 0.0449
12. 6
2.3
2 1.24 1.30 1.61
HR7-46 H250×125×6
×9
45 0
10.
8 26.5 0.36 790
26
0 176
13 6
0.0
75 0.0678
23. 3
3.9
3 1.29 1.48 1.91
HR7-48 H250×125×6
×9 H250×125×6 ×9 45 0 12.
5 35.3 0.47 819
24
5 177
13 6
0.0
98 0.0786
29. 8
5.1
7 1.30 1.38 1.80
HR7-56 57
5 10.
8 33.8 0.45 627
27
8 190
13 6
0.0
96 0.08
30. 6
4.8