White Rose Research Online URL for this paper: http://eprints.whiterose.ac.uk/137258/
Version: Accepted Version
Article:
Killan, C, Scally, A, Killan, E orcid.org/0000-0002-4306-9927 et al. (2 more authors) (2019) Factors Affecting Sound-Source Localization in Children With Simultaneous or Sequential Bilateral Cochlear Implants. Ear and Hearing, 40 (4). pp. 870-877. ISSN 0196-0202
https://doi.org/10.1097/AUD.0000000000000666
Copyright © 2018 Wolters Kluwer Health, Inc. This is an author produced version of a paper published in Ear and Hearing. Uploaded in accordance with the publisher's self-archiving policy.
[email protected] https://eprints.whiterose.ac.uk/ Reuse
Items deposited in White Rose Research Online are protected by copyright, with all rights reserved unless indicated otherwise. They may be downloaded and/or printed for private study, or other acts as permitted by national copyright laws. The publisher or other rights holders may allow further reproduction and re-use of the full text version. This is indicated by the licence information on the White Rose Research Online record for the item.
Takedown
If you consider content in White Rose Research Online to be in breach of UK law, please notify us by
1
TITLE PAGE 1
2
Factors Affecting Sound-Source Localization in Children with
3Simultaneous or Sequential Bilateral Cochlear Implants.
45
Catherine Killan
1, Andrew Scally
2, Edward Killan
3, Catherine Totten
1and
6
Christopher Raine
1 78
1
Yorkshire Auditory Implant Service, Bradford Royal Infirmary, Bradford, United Kingdom.
9
2
School of Allied Health Professions and Sport, University of Bradford, Bradford, United Kingdom.
10
3
School of Medicine, University of Leeds, Leeds, United Kingdom.
11 12
Financial Disclosures/Conflicts of Interest: 13
The salary of the first author was funded by The Ear Trust (Registered Charity No. 1000929). 14
No financial contributors to The Ear Trust were involved with the study design, data 15
collection, analysis and interpretation of data, report writing nor the decision to submit the 16
article for publication. 17
18 19
Address correspondence to: Mrs Catherine Killan, Yorkshire Auditory Implant Service, Listening 20
for Life Centre, Bradford Royal Infirmary, Duckworth Lane, Bradford, BD9 6RJ, United Kingdom.
21
Email: [email protected]
2
ABSTRACT 24
25
Objectives: 26
The study aimed to determine the effect of inter-implant interval and onset of profound 27
deafness on sound localization in children with bilateral cochlear implants, controlling for 28
cochlear implant manufacturer, age and time since second implant. 29
Design: 30
The authors conducted a retrospective, observational study using routinely collected clinical 31
data. Participants were 127 bilaterally implanted children aged 4 years or older, tested at least 32
12 months post-second implant. Children used implants made by one of three manufacturers. 33
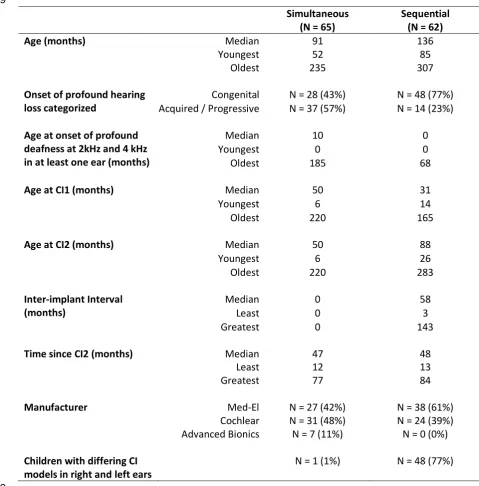
Sixty-five children were simultaneously implanted, of whom 43% were congenitally, 34
bilaterally profoundly deaf at 2 and 4 kHz and 57% had acquired or progressive hearing loss. 35
Sixty-two were implanted sequentially (median inter-implant interval = 58 months, range 3 to 36
143 months) of whom 77% had congenital and 23% acquired or progressive bilateral 37
profound deafness at 2 and 4 kHz. Children participated in a sound-source localization test 38
with stimuli presented in a random order from 5 loudspeakers at -60, -30, 0, +30 and +60 39
degrees azimuth. Stimuli were pre-recorded female voices at randomly roved levels from 65 40
to 75 dB(A). Root mean square (RMS) errors were calculated. Localization data were 41
analysed via multivariable linear regression models, one applied to the whole group and the 42
other to just the simultaneously implanted children. 43
Results: 44
Mean RMS error was 25.4 degrees (SD = 12.5 degrees) with results ranging from perfect 45
accuracy to chance level (0 to 62.7 degrees RMS error). Compared to simultaneous 46
implantation, an inter-implant interval was associated with worse localization by 1.7 degrees 47
3
thresholds better than 90 dB HL at 2 and 4 kHz bilaterally prior to implantation led to more 49
accurate localization by 1.3 degrees RMS error (p < 0.005). Every year post-second implant 50
led to better accuracy by 1.6 degrees RMS error (p < 0.05). Med-El was associated with more 51
accurate localization than Cochlear by 5.8 degrees RMS error (p < 0.01) and with more 52
accurate localization than Advanced Bionics by 9.2 degrees RMS error (p < 0.05). 53
Conclusions: 54
Inter-implant interval and congenital profound hearing loss both led to worse accuracy in 55
sound-source localization for children using bilateral cochlear implants. Inter-implant delay 56
should therefore be minimized for children with bilateral profound hearing loss. Children 57
presenting with acquired or progressive hearing loss can be expected to localize better via 58
bilateral cochlear implants than their congenitally deaf peers. 59
4
INTRODUCTION 61
62
Spatial listening includes the ability to hear where sounds come from. This skill is important 63
for children in social, recreational and educational settings as well as for their personal safety. 64
In individuals with normal hearing, sound localization (i.e. the ability to indicate which of 65
multiple sound-sources a sound came from, in the horizontal plane) is possible because 66
central auditory processing makes use of inter-aural level differences (ILDs), inter-aural time 67
differences (ITDs) and spectral cues (Musicant & Butler, 1984). These cues are disrupted for 68
people with hearing impairment (Noble et al., 1994). One aim of auditory rehabilitation is to 69
restore binaural cues by providing appropriate hearing technology for both ears, with the 70
hope that spatial listening skills might be restored or developed to some extent despite the 71
hearing impairment. 72
73
Profoundly deaf children can learn to localize sounds significantly better with two cochlear 74
implants (CIs) than one (Steffens et al. 2008; Lovett et al. 2010; Godar & Litovsky 2010; 75
Galvin et al. 2010; Grieco Calub & Litovsky 2010; Vincent et al. 2012). However 76
localization accuracy for children with bilateral CIs (BiCIs) varies from near-normal to an 77
inability to localize above chance level (Grieco-Calub & Litovsky 2010; Van Deun et al. 78
2010, Murphy et al. 2011). The reasons for this variation appear complex and are not yet 79
fully understood (Litovsky & Gordon 2016). It is likely that clinicians and CI manufacturers 80
can influence some of the factors affecting sound localization, therefore greater 81
understanding of this area could benefit many profoundly deaf children. 82
83
A number of variables with the potential to influence localization have been identified by 84
5
neural degeneration and cortical reorganization (Sharma et al. 2007a, 2007b; Sparreboom et 86
al. 2011; Gordon et al. 2011; Litovsky & Gordon 2016). Consistent with this, shorter inter-87
implant interval, younger age at second implant (CI2) and later onset of hearing-impairment 88
are associated with better localization in behavioural studies of children (Steffens et al. 2008; 89
Grieco-Calub & Litovsky 2010; Van Deun et al 2010; Strom-Roum et al. 2012; Asp et al. 90
2015). However, a limitation of these studies is the high inter-correlation of time-dependent 91
variables, e.g. age at first CI (CI1), age at CI2, age at test and inter-implant interval (Grieco-92
Calub & Litovsky 2010; Van Deun et al., 2010; Asp et al. 2015) which makes differentiation 93
between the effects of these variables difficult. Further, due to other limitations in previous 94
studies, the effect of inter-implant interval on localization ability is not well understood. For 95
example, most studies are likely underpowered due to insufficient sample size (Van Deun et 96
al., 2010; Asp et al., 2011; Vincent et al., 2012), or make comparisons across different 97
populations, i.e. post-lingually deafened adults versus congenitally deaf children (Litovsky et 98
al., 2004). 99
100
A second factor with the potential to influence localization ability is the cochlear implant 101
system used. Physical characteristics such as the number, separation and insertion depth of 102
the electrodes vary between systems, as do microphone characteristics. Each of these could 103
feasibly influence the binaural perception of sound. Differences in speech processing 104
strategies including peak-picking versus continuous interleaved stimulation (Wilson et al., 105
1991), and variation in the knee-points, speed, complexity and frequency specificity of 106
compression circuits may be influential on ILD representation (Vaerenberg et al., 2014). 107
Representations of temporal fine structure also differ between systems and might feasibly 108
6
therefore important to control for differences in implant and speech processing characteristics 110
when examining localization outcomes. 111
112
Finally, age and binaural listening experience are known to influence children’s localization 113
outcomes. Normally-hearing children continue to improve on tests of sound localization until 114
the age of around 5 to 7 years (Van Deun et al. 2009; Lovett et al. 2012). For sequentially 115
implanted children, localization skills develop over the course of several years after receiving 116
their CI2 (Litovsky et al. 2006; Asp et al. 2011; Kühn et al. 2013; Sparreboom et al. 2015). It 117
is therefore important that age-related changes are accounted for when investigating 118
localization ability development in CI users. 119
120
Given these potential influences on localization ability, and our lack of understanding of how 121
they impact sound-source localization, the present study aimed to investigate the effects of 122
inter-implant interval and onset of profound deafness on sound-source localization, whilst 123
controlling for CI manufacturer, age, and time since CI2 on both simultaneously and 124
sequentially implanted children. 125
7
METHODS 127
128
Participant selection and data collection 129
This study was a retrospective, observational study using routinely collected clinical data. 130
Children using BiCIs, under the care of our service, aged 4 years or older and without 131
language and/or developmental delay that would preclude participation (as assessed by a 132
relevant professional at a prior clinical appointment) were invited for assessment. In line 133
with candidacy criteria in the UK (NICE TAG 166, 2009) unaided hearing threshold levels 134
were 90 dB HL or worse at 2 and 4 kHz bilaterally prior to implantation. Data were excluded 135
from analysis for children with visual impairment that prevented them from seeing the 136
loudspeakers (N=1), children who withdrew co-operation before completing the full number 137
of test trials (N=1), children whose language comprehension was not sufficient to understand 138
the task (N=3), and children who completed the test trials but were uncooperative or 139
distracted to the point where the tester deemed their responses unreliable (N=7). Sound-140
source localization data from the remaining 127 children, with interval post-CI2 ranging from 141
1 to 6 years, were analysed. Characteristics of these children are summarised in Table 1. 142
143
Measurement of sound-source localization 144
Tests were administered via the A-B-York Crescent of Sound (Kitterick et al. 2011), a semi-145
circular array of loudspeakers and monitors. The loudspeakers (Plus XS.2., Canton) were 146
arranged at a height of 1.1m in a semi-circle of radius 1.45m and were controlled by custom 147
software that produced simultaneous output via a digital-to-analogue converter (Ultralite 148
Mk3, MOTU) and five dual-channel amplifiers (RA-150, Alesis). The software also 149
controlled video monitors situated below the active loudspeakers, used as part of the patient 150
8
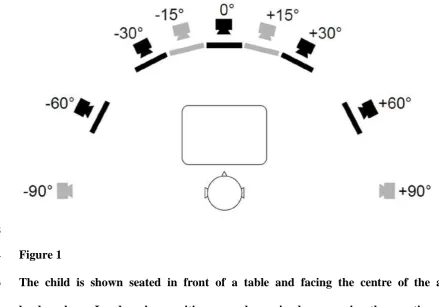
equidistant from all loudspeakers. The study used the localization test developed by Kitterick 152
et al (2011) and Lovett et al. (2012). Active loudspeaker locations were located at −60, −30, 153
0, +30 and +60 degrees azimuth (negative angles denote locations to the left). The positions 154
of the test equipment relative to the child are shown in Figure 1. The test software dictated 155
that the maximum number of active loudspeakers was five. Stimuli were pre-recorded voices 156
saying “Hello, what’s this?”. Five different female talkers were used, 1 of whom was 157
randomly selected on each trial by the software. The average presentation level was 70 158
dB(A), randomly roved by ±5 dB in 1 dB steps. Children were instructed to face directly 159
ahead whilst listening for the stimuli, however no attempts were made to restrict head-160
movements during stimulus presentation. 161
162
The assessments were usually administered by one audiologist working alone. This tester 163
would be seated across the room, operating the equipment via a desk-top keyboard and 164
monitor. A second tester was also present if this was recommended in the child’s medical 165
notes. The second tester sat close by the child to help focus their attention. The testers were 166
not blinded to the child’s medical history or implant model as knowledge of these was 167
necessary to provide informed clinical care, ensure device function and counsel the family. 168
However, as this was a retrospective study, testers were blind to how the data would be used 169
for the purposes of this study. 170
171
One training presentation was given from each of the 5 active loudspeakers and for these the 172
children were shown which loudspeaker the voice had come from. Every child then 173
proceeded to the test trials regardless of their accuracy on the training trials. Six test stimuli 174
were presented from each active loudspeaker so that there were 30 test trials. The test 175
9
could be used for the localization test, to suit each child’s interest and ability. The video 177
monitors could show numbers 1 to 5 beneath each active loudspeaker and the child was asked 178
to say the corresponding number or to point to the loudspeaker that they thought the sound 179
came from. The alternative method involved placing coloured blocks of differing shape in 180
front of the child whilst each monitor displayed a photograph of a different block. The child’s 181
task was to locate the source of the sound and pick up the block displayed on the monitor 182
below that loudspeaker. Children’s continuing participation was praised regardless of their 183
accuracy. Reminders to listen were given as needed. 184
185
Analysis 186
For each child, sound-source localization accuracy was measured via RMS error of the 30 187
test trials. Linear multivariable regression models were used to explore the effects of a 188
number of explanatory variables on sound-source localization accuracy. These were inter-189
implant interval, age at onset of profound deafness, CI manufacturer, chronological age and 190
time post-CI2. Inter-implant interval, age at onset of profound deafness, chronological age 191
and time post-CI2 were continuous variables measured in months. Profound hearing loss was 192
defined as unaided hearing threshold levels of 90 dB HL or worse at 2 and 4 kHz (these 193
frequencies are used to determine candidacy in the UK and hearing threshold levels at other 194
frequencies therefore were not always available). CI manufacturer was entered into the model 195
as a categorical variable with Med-El arbitrarily chosen as the reference category. For each 196
child left and right CIs were from the same manufacturer. Speech processor models were 197
always the same for right and left ears, however CI electrode array model sometimes differed 198
between ears, e.g. if a newer system was available at the time a second, sequential CI was 199
given. In one case a simultaneously implanted child had been re-implanted with a different 200
10
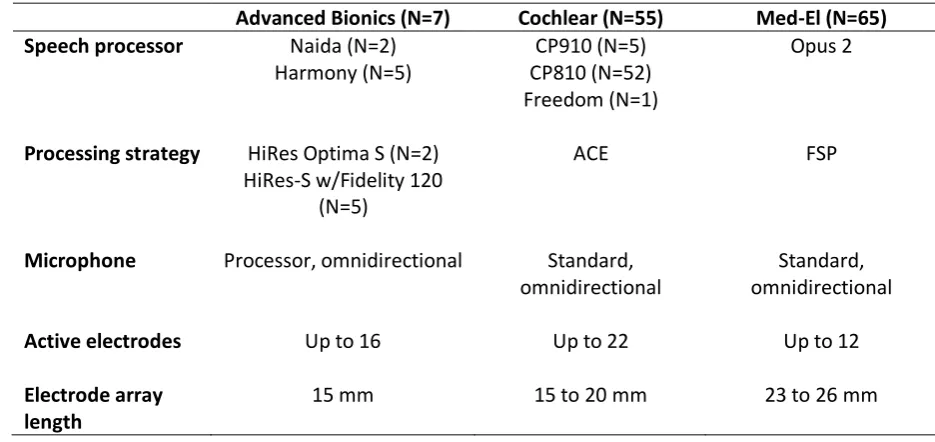
children were programmed in omnidirectional microphone mode. See Table 2 for a summary 202
of CI system characteristics. As shown in Table 1, children using Advanced Bionics devices 203
were all simultaneously implanted. To determine whether this limited our analysis, the effect 204
of CI manufacturer on sound-source localization accuracy was also explored via a regression 205
model using data from simultaneously implanted children only. 206
207
For congenitally deaf children, older age at CI1 and CI2 imply longer periods of auditory 208
deprivation. This can be detrimental to sound localization ability (Van Deun et al. 2010; 209
Grieco-Calub et al. 2010). However with acquired and progressive losses, older age at CI1 210
and CI2 may be due to having useful acoustic hearing for a longer time, resulting in less 211
auditory deprivation, which might be expected to improve a child’s localization with CIs 212
(Grieco-Calub & Litovsky 2010; Killan et al. 2015). For these reasons, whilst age at CI1 and 213
CI2 were recorded, they were not used in the regression analyses. Table 3 shows ages at CI1 214
and CI2 by manufacturer for the children born with profound hearing loss at 2 and 4 kHz in at 215
least one ear. 216
11
RESULTS 218
219
Across all 127 children RMS error ranged from perfect accuracy to chance, i.e. 0.0 to 62.7 220
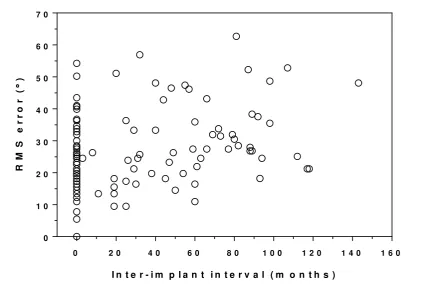
degrees1. Mean RMS error was 25.4 degrees (standard deviation, SD = 12.5 degrees). Figure 221
2 shows a scatterplot of RMS error as a function of inter-implant interval (months). Data-222
points at 0 months are from children who received simultaneous CIs. The mean RMS error 223
for this group was 21.6 degrees (SD = 11.07 degrees), with a range broadly consistent with 224
that seen for the remaining sequentially implanted children (mean RMS error = 29.5 degrees; 225
SD = 12.7 degrees). RMS error is seen to increase with increasing inter-implant interval. 226
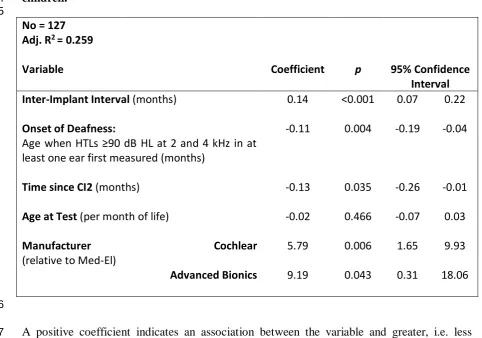
Table 4 shows the results of the regression model, which confirms this relationship. Each 227
month’s wait between CI1 and CI2 was associated with less accurate localization by 0.14 228
degrees RMS error (p < 0.001). 229
230
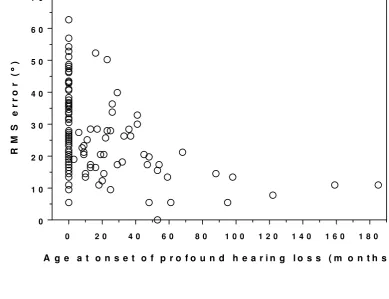
Figure 3 shows the relationship between RMS error and age at onset of profound hearing loss 231
(months). In this figure the data-points at 0 months are from congenitally profoundly deaf 232
children. This group had mean RMS error of 28.6 degrees (SD = 12.1 degrees) and a similar 233
range of RMS error to the acquired/progressive children, i.e. the other data-points in the 234
figure, whose mean RMS error was 20.7 degrees (SD = 10.5 degrees). RMS error is seen to 235
decrease with increasing age at onset of hearing loss. This was shown to be a significant 236
effect by regression analysis, with RMS error improving by 0.11 degrees for each month 237
delay in the onset of bilateral profound hearing loss (p < 0.01). 238
239
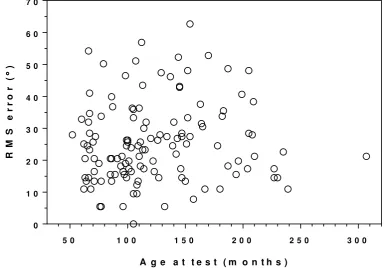
RMS error is plotted against age at test in Figure 4. No clear trend is evident, as confirmed by 240
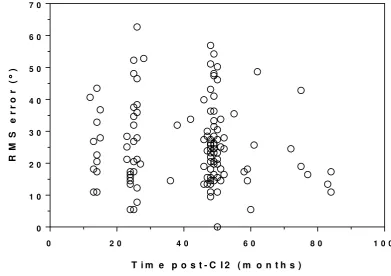
regression analysis (p = 0.47). Figure 5 shows RMS error against time post-CI2 (months). 241
12
Data points are clustered around 1, 2 and 4 years post-CI2, as these were standard assessment 242
intervals. Although trends are difficult to discern from subjective inspection of the figure 243
regression analysis, controlling for the other variables, found a significant reduction of 0.13 244
degrees per month post-CI2 (p < 0.05). Significant differences were obtained between the 245
manufacturers. Med-El systems were associated with more accurate localization, with RMS 246
error 5.79 degrees smaller than Cochlear (p < 0.01) and 9.19 degrees smaller than Advanced 247
Bionics (p < 0.05). As all Advanced Bionics users were simultaneously-implanted, a second 248
model exploring the effect of CI manufacturer using only data from simultaneously implanted 249
children was performed. This gave similar results to the first model, suggesting that the 250
differences in localization seen between CI systems was not materially affected by whether a 251
child received their implant simultaneously or sequentially (Table 5). 252
13
DISCUSSION 254
255
Previous research is limited in its ability to provide information on potential influencing 256
factors on sound-source localization ability. Limitations include small sample size, inability 257
to differentiate between the effects of time-based factors and comparisons across different 258
populations. The present study therefore aimed to investigate the effects of factors that 259
influence localization ability, namely inter-implant interval and onset of profound deafness, 260
whilst controlling for CI manufacturer, age and time since CI2, for simultaneously and 261
sequentially implanted children. This was achieved via multiple regression analysis of 262
routinely collected clinical data from a large number of children. This allowed analysis of the 263
independent effects of a number of explanatory variables on localization accuracy (measured 264
via RMS error). 265
266
We found a broad range of localization accuracy, consistent with other studies of bilaterally 267
implanted children. Our whole group mean RMS error was 25.4 degrees, ranging from 0.0 to 268
62.7 degrees. Zheng et al (2015) reported mean RMS errors of 19 children, 4 of whom had 269
some acoustic experience prior to BiCI and 8 of whom had less than one year inter-implant 270
interval. When first assessed with mean BiCI experience of 29.8 months, mean RMS error 271
was 31.3 degrees, falling to 26.2 degrees for the same children at a later assessment interval. 272
This is comparable to the present study. Grieco-Calub and Litovsky (2010) report mean RMS 273
error of 37.4 degrees (range 19 to 56 degrees) for 19 sequentially implanted children, around 274
half of whom were congenitally deaf. Van Deun et al. (2010) report a very similar mean RMS 275
error of 38 degrees from 30 children who were all implanted sequentially and two thirds of 276
whom were congenitally deaf. Compared to Grieco-Calub & Litovsky (2010) and Van Deun 277
14
the relatively longer duration of BiCI experience of the children in our study, the larger 279
proportions of children with acquired and progressive losses and simultaneous implantation, 280
and likely methodological differences also. Asp et al. (2011) reported bilaterally implanted 281
children’s localization in terms of Error Index. Outcomes also varied from perfect accuracy to 282
chance performance for a five loudspeaker array localization task. We found greater mean 283
RMS error than that of normally-hearing children, who typically perform the task with 284
perfect accuracy (Lovett et al. 2012). 285
286
Inter-implant interval was shown to have a significant influence on sound-source localization 287
ability. This adds to the arguments in support of minimizing inter-implant interval where 288
possible for children with bilateral profound hearing loss. It is interesting to note that the 289
effect of inter-implant interval was still significant in this group who had received their 290
second implant up to 6 years ago. Thus, despite being experienced users of bilateral CIs, 291
children did not fully overcome the detriment caused by prolonged inter-implant interval. 292
This is consistent with theories of long-lasting cortical reorganization in response to unilateral 293
auditory deprivation, which suggest a critical period of 18 months (e.g. Gordon et al. 2013; 294
2015). 295
296
Our data showed age at onset of bilateral profound hearing loss also had a significant effect 297
on sound-source localization, with better performance seen for children with longer 298
experience of bilateral acoustic sound prior to BiCIs. This is consistent with previous studies 299
that indirectly explored the effect of auditory experience during the early years. For example, 300
Grieco-Calub & Litovsky (2010) showed that children reported by parents to be benefiting 301
from hearing aids were more likely to have better sound-source localization via CIs than 302
15
that type of hearing loss (categorized as acquired/progressive or congenital) influenced 304
sound-source localization, with children with acquired/progressive loss performing better 305
than those with congenital hearing loss. Their study was limited due to children with 306
acquired/progressive loss being older than children in the congenitally deaf group. The 307
present data adds to the evidence for the effect of age at onset of profound hearing loss by 308
quantifying and directly exploring this variable. 309
310
All children whose unaided hearing thresholds were outside NICE CI criteria (NICE, 2009) 311
up to at least approximately 48 months of age localized with better accuracy than the group 312
average in the present study. This is broadly consistent with reports by Sharma et al., (2007a, 313
2007b) who showed that congenitally deaf children need to receive CIs in both ears by the 314
age of 42 months to give symmetrical electrophysiological responses to sound. Other 315
behavioural studies of localization ability in children have also noted a benefit of binaural 316
listening during the early years (Steffens et al., 2008; Grieco-Calub & Litovsky, 2010; Van 317
Deun et al., 2010). It should be noted however that in the present study, pre-operative 318
hearing thresholds below 2 kHz were not used in our definition of profound hearing loss. As 319
a consequence it is possible that the present study may underestimate the effect of pre-320
operative hearing levels due to unknown variability in low-frequency hearing. 321
322
CI manufacturer had a significant effect on sound-source localization ability, with Med-El 323
implants being associated with the most accurate localization ability, followed by Cochlear 324
and then Advanced Bionics. Interpretation of this effect based on modelling the whole group 325
was potentially complicated since all users of Advanced Bionics devices were simultaneously 326
implanted, whilst Med-El and Cochlear users were either simultaneously or sequentially 327
16
influenced by inter-implant interval effects. To explore this, an additional model including 329
data from only simultaneously implanted children (regardless of CI manufacturer) was 330
calculated and compared with the original model. Similar differences between the three 331
manufacturers were evident in both models, indicating that CI manufacturer had a similar 332
effect on localization accuracy for both simultaneously and sequentially implanted children 333
and that this effect was independent of inter-implant interval. Our study was not designed to 334
explore reasons for differences between systems however, one plausible explanation may be 335
differences in automatic gain control, which can influence outcomes for speech 336
discrimination (Spahr et al. 2007). The range of stimulus intensity used in the present study, 337
from 65 to 75 dB(A), is toward the higher levels for speech, equivalent to e.g. a team-mate 338
calling during a sports game or raised voices during a group meal. Input sounds from 65 to 75 339
dB SPL may result in CI stimulation at levels at, or close to, maximum stimulation amplitude 340
for Cochlear and Advanced Bionics patients, hence ILDs for sounds in this range may be 341
difficult to perceive. For Med-El recipients these intensities are mapped to a lower portion of 342
the patients’ dynamic range and will produce CI stimulation over a wider range of electrical 343
amplitude (Vaerenberg et al. 2014). Localization via CIs is thought to be dominated by ILDs 344
(Seeber & Fastl 2008), even in children where fine structure strategies facilitate some degree 345
of ITD sensitivity (Eklöf & Tideholm, 2018). Since Med-El systems apply less compression 346
to sounds louder than 65 dB SPL compared to Cochlear or Advanced Bionics, ILD cues may 347
have been better preserved for children using Med-El systems in the present study. It is 348
therefore possible that repeating this study using quieter stimuli would not find the same 349
difference between manufacturers. Age at CI1 and CI2 is not likely to account for the 350
difference in localization across CI manufacturers. On average, for congenitally deaf 351
children, Med-El users were older at CI1 and CI2. This is a detrimental influence on sound-352
17 354
Consistent with previous studies (Asp et al., 2011; Kühn et al. 2013; Asp et al. 2015), time 355
post-CI2 was shown to influence localization ability, with a longer time associated with 356
improved performance. It should be noted, however, that actual binaural listening time varies 357
from child to child dependent on how consistently they use their devices. Inconsistent device 358
use has been shown to be a particular issue for sequentially implanted children (Galvin & 359
Hughes. 2012; Fitzgerald et al. 2013). A limitation of the present study was that it was not 360
possible to determine or control for how much time each child had spent listening via both 361
CIs together. 362
363
One limitation of this study is the use of RMS error alone to measure sound localization, as it 364
does not capture more subtle aspects of a person’s localization ability (Grieco-Calub & 365
Litovsky, 2010; Zheng et al., 2015; Killan et al., 2018). A further potential limitation is the 30 366
degrees spacing between loudspeakers, which does not allow localization accuracy to be 367
measured with the fine spatial resolution achieved in some other studies (e.g. Zheng et al., 368
2015). However, as the mean RMS error found in the present study (25.4 degrees) is 369
comparable to those reported by Zheng et al. (2015) (31.3 and 26.2 degrees at first and 370
second test intervals respectively) it is likely that loudspeaker separation did not substantially 371
impact our findings. Indeed, the spatial resolution achieved in our study is similar to other 372
previous research (e.g. Asp et al., 2011; Killan et al., 2015; Murphy et al., 2011). A 373
loudspeaker array with large separations between speakers may lead to ceiling effects, where 374
children find the test too easy. As only one out of the 127 children completed the test with 375
perfect accuracy, it is considered unlikely that ceiling effects limited our findings. Similarly, 376
Asp et al (2011) reported only two out of sixty-six bilaterally implanted children perfectly 377
18
Importantly, the loudspeaker spacing in the present study is representative of situations a 379
hearing impaired child might encounter in day to day life, at mealtimes, during lessons or 380
playing sport. For example, a child might be writing while sat around a table with friends 381
doing group work at school when another child begins to speak. 382
383
Our regression model accounted for 26% of variance in the data. A number of factors not 384
measured in our study potentially account for some of the remaining variance. One such 385
factor is asymmetric loudness growth caused by, for example, avoidance of facial nerve 386
stimulation or recent re-programming. A second possible influence is the effect of children 387
moving their head following stimulus onset. Whilst asked to face ahead for the onset of each 388
presentation, some children moved their heads more than others during the sentence and 389
some leaned forward when they were concentrating, effectively moving the loudspeaker array 390
out of the horizontal plane. Finally, variation in children’s concentration during the task could 391
account for some variance in the data. Data were excluded from analysis if the tester deemed 392
a child had been uncooperative or distracted such that their responses were clearly unreliable. 393
However the analysed group will have included children with varying levels of attention, 394
fatigue and motivation, potentially influencing their responses in more subtle ways that are 395
difficult to quantify. 396
397
Our findings provide further evidence that the unilateral auditory deprivation experienced 398
while waiting between a first and second CI causes a long-term detriment in subsequent 399
sound-source localization. Therefore inter-implant interval should be minimized for children 400
with bilateral severe-to-profound hearing loss. The significant effect of age at onset of 401
profound deafness means that clinicians can expect children with acquired or progressive 402
19
selection for BiCIs, counselling and targeting rehabilitation for children where progress is not 404
seen. Another implication is that it is important to monitor a child’s localization accuracy 405
over several years following BiCIs so that failure to develop localization skills can be 406
identified. Where this is found, appropriate measures can be taken to initiate targeted 407
rehabilitation, including reviewing BiCI use, addressing any programming issues, or 408
recommending localization listening practice. The family can be counselled regarding their 409
child’s speech processor use to ensure that both processors are worn simultaneously for most 410
of the day, rather than alternating, and also to ensure that processor microphones are not 411
positioned side-by-side on the top of the child’s head rather than over the ears. Listening 412
practice can include games where the child closes their eyes and family members play an 413
instrument from differing, unknown locations in the room, then the child guesses where the 414
sound came from; or where a noise-making toy or phone is hidden in the room and the child 415
is encouraged to listen to help them find it. 416
20
ACKNOWLEDGEMENTS 418
The Authors wish to thank the families who attend the Yorkshire Auditory Implant Service 419
and The Ear Trust Charity for their support. We also thank Pádraig Kitterick for his technical 420
expertise with regard to the Crescent of Sound. 421
422
The salary of the first author was funded by the Ear Trust, Registered Charity No. 1000929. 423
424
There are no conflicts of interest to declare. 425
426
Portions of this study were presented at the 13th Congress of the European Society of 427
Pediatric Otorhinolaryngology, Lisbon, June 19, 2016. 428
429
Author Contribution Statements: 430
C.F.K. contributed to the conception and design of the work, collected the data, contributed 431
to the interpretation of data analysis, drafted the article, contributed to the article’s revision 432
and gave final approval of the submission. A.J.S. conducted the data analyses, contributed to 433
the writing of the results section of the manuscript, and gave final approval of the submission. 434
E.C.K. provided substantial critical revision of the manuscript, including presentation and 435
interpretive analysis of the results, and gave final approval of the submission. C.L.T 436
contributed to the design of the work, revision of the draft article and gave final approval of 437
the submission. C.H.R. contributed to the conception of the work, revision of the draft article 438
and gave final approval of the submission. 439
440
Address for Correspondence: 441
21
Clinical Scientist (Audiology) 443
Yorkshire Auditory Implant Service 444
Listening for Life Centre 445
Bradford Royal Infirmary 446
Duckworth Lane 447
BD9 6RJ 448
Email: [email protected] 449
22
REFERENCES 451
452
Asp, F., Eskilsson, G., Gerninger, E. (2011) Horizontal sound localization in children with 453
bilateral cochlear implants: Effects of auditory experience and age at implantation. Otology & 454
Neurotology. 32(4): 558-564. 455
456
Asp, F., Mäkr Torkko, E., Karltorpp, E., et al. (2015) A longitudinal study of the bilateral 457
benefit in children with bilateral cochlear implants. Int J Audiol, 54(2), 77-88. 458
459
Eklöf M. & Tideholm, B. (2018). The choice of stimulation strategy affects the ability to 460
detect pure tone inter-aural time differences in children with early bilateral cochlear 461
implantation. Acta Otolaryngol, 138(6): 554-561. 462
463
Fitzgerald, M.B., Green, J.E., Fang, Y., et al. (2013). Factors influencing consistent device 464
use in pediatric recipients of bilateral cochlear implants. Cochlear Implants Int, 14(5), 257-465
265. 466
467
Galvin, K.L., Hughes, K.C., Mok, M. (2010). Can adolescents and young adults with 468
prelingual hearing loss benefit from a second, sequential cochlear implant? Int J Audiol, 49, 469
368-377. 470
471
Galvin, K.L. & Hughes, K.C. (2012). Adapting to bilateral cochlear implants: early post-472
operative device use by children receiving sequential or simultaneous implants at or before 473
3.5 years. Cochlear Implants Int 13(2), 105-112. 474
23
Godar, S.M., & Litovsky, R.Y. (2010). Experience with bilateral cochlear implants improves 476
sound localization acuity in children. Otol Neurotol; 31(8), 1287-1292. 477
478
Gordon, K.A., Jiwani, S., Papsin, B.C. (2011). What is the optimal timing for bilateral 479
cochlear implantation in children? Cochlear Implants Int, 12(S2), S8-S14. 480
481
Gordon, K.A., Wong, D.D., Papsin, B.C. (2013). Bilateral input protects the cortex from 482
unilaterally-driven reorganization in children who are deaf. Brain, 136(Pt 5), 1609-1625. 483
484
Gordon, K.A., Henkin, Y., Kral, A. (2015). Asymmetric hearing during development: The 485
aural preference syndrome and treatment options. Pediatrics 136(1), 141-153. 486
487
Grieco-Calub, T.M., Litovsky, R.Y. (2010). Sound localization skills in children who use 488
bilateral cochlear implants and in children with normal acoustic hearing. Ear Hear, 31(5), 489
645-656. 490
491
Killan, C.F., Royle, N., Totten, C.L., Raine, C.H., Lovett, R.E.S. (2015). The effect of early 492
auditory experience on the spatial listening skills of children with bilateral cochlear implants. 493
Int J Pediatr Otorhinolaryngol. 79(12), 2159-2165. 494
495
Killan, C.F., Harman, S., Killan, E.C. (2018) Changes in sound-source localization for 496
children with bilateral severe to profound hearing loss following simultaneous bilateral 497
cochlear implantation. Cochlear Implants Int. 19(5), 284-291. 498
24
Kitterick, P.T., Lovett, R.E.S., Goman, A.M., et al. (2011). The AB-York crescent of sound – 500
An apparatus for assessing spatial-listening skills in children and adults. Cochlear Implants 501
Int, 12(3), 164-169 502
503
Kühn, H., Schön, F., Edelmann, K., et al. (2013). The development of lateralization abilities 504
in children with bilateral cochlear implants. ORL, 75, 55-67. 505
506
Litovsky, R.Y., Parkinson A., Arcaroli, J. et al. (2004) Bilateral cochlear implants in adults 507
and children Arch Otolaryngol Head Neck Surg. 130(5): 648-655. 508
509
Litovsky, R.Y., Johnsone, P.M., Godar, S., et al. (2006). Bilateral cochlear implants in 510
children: Localization acuity measured with minimum audible angle. Ear Hear, 27(1), 43-59. 511
512
Litovsky, R.Y., Gordon, K. (2016). Bilateral cochlear implants in children: Effects of 513
auditory experience and deprivation on auditory perception. Hear Res, 514
http://dx.doi.org/10.1016/j.heares.2016.01.003 515
516
Lovett, R.E.S., Kitterick, P.T., Hewitt, C.E., et al. (2010). Bilateral or unilateral cochlear 517
implantation for deaf children: an observational study. Arch Dis Child, 95, 107-112 518
519
Lovett, R.E.S., Kitterick, P.T., Huang, S., et al. (2012) The developmental trajectory of 520
spatial listening skills in normal-hearing children. JSLH,. 55, 865-878. 521
522
Macpherson, E.A., & Middlebrooks, J.C. (2002). Listener weighting of cues for lateral angle: 523
25 525
Murphy, J., Summerfield, Q.A., O’Donaghue, G.M., et al. (2011). Spatial hearing of 526
normally hearing and cochlear implanted children. Int J Pediatr Otorhinolaryngol, 75(4), 527
489–494 528
529
Musicant, A.D. & Butler, R.A. (1984) The influence of pinnae- based spectral cues on sound 530
localization. J. Acoust. Soc. Am., 75(4), 1195 531
532
National Institute for Health and Care Excellence (NICE) Technology Appraisal Guidance 533
2009 [TA166]. URL: www.nice.org.uk/guidance/ta166 534
535
Noble W., Byrne, D., Lepage B., 95, 992 (1994) Effects on sound localization of 536
configuration and type of hearing impairment. The Journal of the Acoustical Society of 537
America; 95 doi: http://dx.doi.org/10.1121/1.408404 538
539
Seeber, B.U., Fastl, H. (2008). Localization cues with bilateral cochlear implants. J. Acoust. 540
Soc Am., 123(2), 1030-1042. 541
542
Sharma, A., Gilley, P.M., Dorman, M.F., et al. (2007a). Deprivation-induced cortical 543
reorganization in children with cochlear implants. Int. J. Audiol. 46: 494-499. 544
545
Sharma A., Gilley P.M., Martin K., et al. (2007b). Simultaneous versus sequential bilateral 546
cochlear implantation in young children: Effects on central auditory system development and 547
plasticity. Audiol. Med. 5: 218-223. 548
26
Spahr, A.J., Dorman, M.F., Loiselle, L.H. (2007). Performance of patients using different 550
cochlear implant systems: Effects of input dynamic range. Ear Hear, 28: 260-275. 551
552
Sparreboom, M., Snick, A.F.M., Mylanus, E.A.M., (2011). Sequential bilateral cochlear 553
implantation in children: Development of the primary auditory abilities of bilateral 554
stimulation. Audiol Neurotol, 16: 203-213. 555
556
Sparreboom, M., Langereis, M.C., Snick, A.F.M., et al. (2015). Long-term outcomes on 557
spatial hearing, speech recognition and receptive vocabulary after sequential bilateral 558
cochlear implantation in children. Res Dev Disabil, 36, 328-337. 559
560
Steffens, T., Lesinski-Schiedat A., Strutz, J., et al. (2008) The benefits of sequential bilateral 561
cochlear implantation for hearing-impaired children. Acta Otolaryngol, 128, 164-176. 562
563
Strøm-Roum, A.K., Rødvik, T.A. Osnes, M.W., et al. (2012) Sound localising ability in 564
children with bilateral sequential cochlear implants. Int. J. Pediatr. Otorhinolaryngol. 76(9): 565
1245–1248. 566
567
Thakkar T., Kan A., Jones H.G. et al. (2018). Mixed stimulation rates to improve sensitivity 568
of interaural timing differences in bilateral cochlear implant listeners. JASA, 143, 1428; doi: 569
10.1121/1.5026618. 570
571
Vaerenberg, B., Govaerts, P.J., Stainsby, T., et al. (2014). A uniform graphical representation 572
of intensity coding in current generation cochlear implant systems”. Ear Hear, 35, 533–43 573
27
Van Deun, L., van Wieringen, A., Van den Bogaert, T., et al. (2009) Sound localization, 575
sound lateralization and binaural masking level differences in young children with normal 576
hearing. Ear Hear, 30, 178-190. 577
578
Van Deun, L.,van Wieringen, A., Scherf, F., et al. (2010). Earlier intervention leads to better 579
sound localization in children with cochlear implants. Audiol. Neurotol., 15, 7-17. 580
581
Vincent, C., Bébéar, J-P., Radafy, E., et al. (2012). Bilateral cochlear implantation in 582
children: Localization and hearing in noise benefits. Int. J. Pediatr. Otorhinolaryngol., 76, 583
858-864. 584
585
Wilson, B.S., Finley, C.C., Lawson, D.T. et al., (1991). Better speech recognition with 586
cochlear implants. Nature, 352, 236-238. 587
588
Zheng Y, Godar SP, Litovsky RY (2015) Development of Sound Localization Strategies in 589
Children with Bilateral Cochlear Implants. PLoS ONE 10(8): e0135790. 590
https://doi.org/10.1371/journal.pone.0135790 591
28 593
Figure 1 594
The child is shown seated in front of a table and facing the centre of the arc of 595
loudspeakers. Loudspeaker positions are shown in degrees azimuth, negative angles 596
denote locations to the left and positive angles denote locations to the right of centre. 597
Inactive video monitors and loudspeakers are shown in grey. Active video monitors and 598
loudspeakers are shown in black. 599
29 601
0 2 0 4 0 6 0 8 0 1 0 0 1 2 0 1 4 0 1 6 0
0 1 0 2 0 3 0 4 0 5 0 6 0 7 0
I n t e r - i m p l a n t i n t e r v a l ( m o n t h s )
R
M
S
e
r
r
o
r
(
)
602
Figure 2 603
RMS errors are plotted for each child against the duration of their inter-implant 604
interval in months. 605
[image:30.595.83.526.117.414.2]30
0 2 0 4 0 6 0 8 0 1 0 0 1 2 0 1 4 0 1 6 0 1 8 0 0
1 0 2 0 3 0 4 0 5 0 6 0 7 0
A g e a t o n s e t o f p r o f o u n d h e a r i n g l o s s ( m o n t h s )
R
M
S
e
r
r
o
r
(
)
608
Figure 3 609
RMS errors are plotted for each child against the age at which their hearing loss was 610
first confirmed to be profound at 2 and 4 kHz in at least one ear. Children whose 611
hearing impairment was detected by newborn hearing screening and confirmed to fall 612
within this range on immediate follow-up are plotted as having met this criterion from 613
birth and are clustered at the far left. 614
615
[image:31.595.88.478.106.405.2]31
5 0 1 0 0 1 5 0 2 0 0 2 5 0 3 0 0
0 1 0 2 0 3 0 4 0 5 0 6 0 7 0
A g e a t t e s t ( m o n t h s )
R
M
S
e
r
r
o
r
(
)
617
Figure 4 618
RMS errors are plotted for each child against their age at test in months. 619
[image:32.595.93.478.102.370.2]32
0 2 0 4 0 6 0 8 0 1 0 0
0 1 0 2 0 3 0 4 0 5 0 6 0 7 0
T i m e p o s t - C I 2 ( m o n t h s )
R
M
S
e
r
r
o
r
(
)
622
Figure 5 623
RMS errors are plotted for each child against the number of months since they received 624
their second CI. 625
[image:33.595.90.482.99.375.2]33 Table 1 627
Participant Characteristics 628
629
Simultaneous (N = 65)
Sequential (N = 62)
Age (months) Median 91 136
Youngest 52 85
Oldest 235 307
Onset of profound hearing loss categorized
Congenital N = 28 (43%) N = 48 (77%)
Acquired / Progressive N = 37 (57%) N = 14 (23%)
Age at onset of profound deafness at 2kHz and 4 kHz in at least one ear (months)
Median 10 0
Youngest 0 0
Oldest 185 68
Age at CI1 (months) Median 50 31
Youngest 6 14
Oldest 220 165
Age at CI2 (months) Median 50 88
Youngest 6 26
Oldest 220 283
Inter-implant Interval (months)
Median 0 58
Least 0 3
Greatest 0 143
Time since CI2 (months) Median 47 48
Least 12 13
Greatest 77 84
Manufacturer Med-El N = 27 (42%) N = 38 (61%)
Cochlear N = 31 (48%) N = 24 (39%)
Advanced Bionics N = 7 (11%) N = 0 (0%)
Children with differing CI models in right and left ears
N = 1 (1%) N = 48 (77%)
34 Table 2 632
Characteristics of the children’s cochlear implant systems
633 634
Advanced Bionics (N=7) Cochlear (N=55) Med-El (N=65)
Speech processor Naida (N=2)
Harmony (N=5)
CP910 (N=5) CP810 (N=52) Freedom (N=1)
Opus 2
Processing strategy HiRes Optima S (N=2)
HiRes-S w/Fidelity 120 (N=5)
ACE FSP
Microphone Processor, omnidirectional Standard,
omnidirectional
Standard, omnidirectional
Active electrodes Up to 16 Up to 22 Up to 12
Electrode array length
15 mm 15 to 20 mm 23 to 26 mm
35 Table 3 637
Ages at CI1 and CI2 by manufacturer for the congenitally deaf children 638
639
Age at CI1 (months) Age at CI2 (months)
Median (range) Median (range)
Advanced Bionics (N=4) 20 (13 to 67) 20 (13 to 67)
Cochlear (N=29) 26 (12 to 186) 63 (12 to 186)
Med-El (N=43) 32 (6 to 216) 91 (6 to 216)
36 Table 4 642
Results of regression analysis for both simultaneously and sequentially implanted 643
children. 644
645
No = 127 Adj. R2 = 0.259
Variable Coefficient p 95% Confidence
Interval
Inter-Implant Interval (months) 0.14 <0.001 0.07 0.22
Onset of Deafness:
A HTL B HL H
least one ear first measured (months)
-0.11 0.004 -0.19 -0.04
Time since CI2 (months) -0.13 0.035 -0.26 -0.01
Age at Test (per month of life) -0.02 0.466 -0.07 0.03
Manufacturer (relative to Med-El)
Cochlear 5.79 0.006 1.65 9.93
Advanced Bionics 9.19 0.043 0.31 18.06
646
A positive coefficient indicates an association between the variable and greater, i.e. less 647
accurate SLA. 648
37 Table 5 651
Results of regression analysis for simultaneously implanted children only. 652
653
No = 65
Adj. R2 = 0.220
Variable Coefficient p 95% Confidence
Interval Onset of Deafness:
A HTL B HL H
least one ear first measured (months)
-0.10 0.007 -0.17 -0.03
Time since CI2 (months) -0.17 0.033 -0.33 -0.01
Age at Test (Per month of life) -0.03 0.213 -0.09 0.02
Manufacturer (relative to Med-el)
Cochlear 7.48 0.008 2.03 12.93
Advanced Bionics 10.66 0.017 1.97 19.36
654
A positive coefficient indicates an association between the variable and greater, i.e. less 655
accurate SLA. 656
657
658 659 660