Int. J. Electrochem. Sci., 12 (2017) 4238 – 4250, doi: 10.20964/2017.05.23
International Journal of
ELECTROCHEMICAL
SCIENCE
www.electrochemsci.org
The Study of a Phosphate Conversion Coating on Magnesium
Alloy AZ91D: III. Nano-particle Modification
Qing yun Xiong1, Jin ping Xiong1, *, Yong Zhou2, **,Fuan Yan2
1
Beijing Laboratory of Electrochemical Process and Technology for Materials, Beijing University of Chemical Technology, Beijing 100029, China
2
Key Laboratory for Green Chemical Process of Ministry of Education, Wuhan Institute of Technology, Wuhan 430205, China
*
E-mail: [email protected];
**
E-mail: [email protected]
Received: 1 January 2017 / Accepted: 8 March 2017 / Published: 12 April 2017
This paper involved a phosphate conversion coating on magnesium alloy AZ91D. In order to strengthen the corrosion resistance of the original phosphate coating, three particles — nano-CeO2, nano-ZnO and nano-ZrO2 — were respectively added into the primary treatment bath to obtain
the nano-CeO2 modified coating (Ce coating), the nano-ZnO modified coating (Zn coating) and the
nano-ZrO2 modified coating (Zr coating). For the original coating and the modified coatings, the
corrosion resistance was evaluated by immersion test and electrochemical measurement, and the microstructure and composition were characterized by scanning electron microscope (SEM) with energy dispersion X-ray spectroscope (EDS). At the same amount, the addition of nano-CeO2 and
nano-ZrO2 was available and efficient, whereas the addition of nano-ZnO was useless. The efficiency
of the three nano-particles for the corrosion resistance increased in the order: nano-ZnO < nano-ZrO2
< the nano-CeO2. At the same time, the modification mechanism of related nano-particles was
discussed.
Keywords: magnesium alloy; phosphate coating; nano-particles; corrosion resistance; SEM
1. INTRODUCTION
As a convenient and low-cost surface treatment technique, phosphating is applied to strengthen the corrosion resistance for metals and alloys widely [1-3].
additives are applied to strengthen the corrosion resistance of phosphate coatings with the addition of them into treatment bath immediately [4-9]. For example, on organic additives [4-6], Sarabi et al. [4] studied the effect of sodium dodecyl sulfate (SDS) on the corrosion property of a phosphate coating on magnesium alloy AZ31 and reported that with SDS modification, a denser and less permeable coating was deposited on the AZ31 alloy surface. The higher the SDS content the better the modified coating. Li et al. [5] studied the effect of ethanolamine (MEA) on the structure and electrochemical behavior of a zinc phosphate coating on magnesium alloy AZ91D. The authors reported that the modification with MEA refined the microstructure of phosphate crystals, and the modified coating formed in treatment bath containing 1.2 g/L MEA, with the most compact and uniform crystal layer, presented the best corrosion resistance. Lian et al. [6] studied the influence of sodium metanitrobenzene sulphonate (SMBS) on the structure and surface morphology of a phosphate coating on magnesium alloy AZ91D and reported that the phosphate coating became denser and had less pores with the increase of SMBS content in the concentration range from 2.0 g/L to 6.0 g/L. The SMBS modification increased the micro cathode and decreased the coating porosity significantly. On the other hand, on inorganic additives [7-9], Xiong et al. [7] studied the effect of sodium pyrophosphate (TSPP) on the electrochemical behavior and microstructure of a phosphate coating on magnesium alloy AZ91D. The authors reported that a compact, integral and uniform coating was deposited on the AZ91 alloy surface with the modification of TSPP, and the optimum content of TSPP in treatment bath was 0.5 g/L. Zeng et al. [8] studied the influence of calcium nitrate (Ca(NO3)2) on the corrosion resistance of a zinc
phosphate coating on magnesium alloy AZ31 and reported that the modification with Ca(NO3)2
resulted in the full crystallization of phosphate crystal, which significantly strengthened the corrosion resistance of the phosphate coating. Liu et al. [9] prepared a molybdate / phosphate composite coating on magnesium alloy AM60. The authors reported that with MoO42- modification, the composite
coating presented better corrosion resistance than the single coating did and even had almost comparable corrosion resistance to traditional chromate conversion coatings, which was attributed to the precipitation of molybdate oxide at the coating defects. Nevertheless, a majority of additives are detrimental to human health, which is limited in industrial production strictly.
In recent decades, nano-particles are applied to strengthen the corrosion resistance of surface protection layer widely. For example, the addition of nano-SiO2, nano-TiO2 and nano-ZnO in
treatment bath was frequently reported to strengthen the hybrid acrylic-silicone polymeric coating [10], the steam-based conversion coating [11], the sprayed coating [12], the electroplated coating [13] and the organic coating [14]. However, for phosphate coatings, the published reports on nano-particle modification are very few, especially for phosphate coatings on magnesium alloys.
In our previous work [15], a primary treatment bath was obtained to prepare a phosphate conversion coating on the magnesium alloy AZ91D surface. In this work, three kinds of nano-particles — nano-CeO2, nano-ZnO and nano-ZrO2 — are respectively added into the primary treatment bath in
order to strengthen the corrosion resistance of the original phosphate coating. The nano-CeO2 modified
coating (Ce coating), the nano-ZnO modified coating (Zn coating) and the nano-ZrO2 modified coating
(Zr coating) are prepared in the primary treatment baths containing nano-CeO2, ZnO or
nano-ZrO2 particles, respectively. For the original coating and the modified coatings, the corrosion
impedance spectroscopy (EIS), and the microstructure and composition are characterized by scanning electron microscope (SEM) with energy dispersion X-ray spectroscope (EDS). Meanwhile, in this work, for the three nano-particles, the modification efficiency and mechanism are compared and discussed.
2. EXPERIMENTAL
2.1 Materials and solution
The studied material was magnesium alloy AZ91D with the following chemical composition (wt. %): Al, 9.4; Zn, 0.82; Mn, 0.23; Si, 0.01; Cu 0.02; Ni, 0.0021; Fe, 0.005, and Mg. Samples with the dimension of 5 cm × 5 cm × 0.3 cm were manually abraded up to 1000 grit with SiC abrasive papers, rinsed with de-ionized water and degreased in acetone.
The studied solutions for coating preparation were the primary treatment bath reported in our previous study [15] and the primary treatment baths containing nano-CeO2 particles, nano-ZnO
particles or nano-ZrO2 particles. The components of four treatment baths were listed in Table 1.
Table 1. Components of four treatment baths.
Bath Component (g/L)
Primary bath ZnO, 2.0; H3PO4, 12.0; NaF, 1.0; C4H4O6Na2, 4.0; NaNO3 6.0; Na4P2O7, 0.5
Nano-CeO2 bath Primary bath + nano-CeO2, 2.0
Nano-ZnO bath Primary bath + nano-ZnO, 2.0
Nano-ZrO2 bath Primary bath + nano-ZrO2, 2.0
2.2 Coating preparation
Mechanical stirring was carried out for enough time to ensure the full blend between each nano-particle and the primary treatment bath. Then, ultrasonic agitation was performed to stir each bath once again with for 60 min before the process of coating preparation. After that, each sample was suspended with PTFE belt in the corresponding bath to prepare the corresponding coating, meanwhile the application of ultrasonic agitation was sustained to keep the stability of treatment bath. The time and temperature for coating preparation were 60 min and 60 ℃, respectively.
2.3 Immersion test
Vcorr = (W0 - W) / (S × t) (1)
In the equation, Vcorr represented the corrosion rate, W0 represented the weight of each sample
with corresponding coating before immersion test, W represented the weight of each sample with corresponding coating after immersion test and the corrosion products were eliminated, S represented the sample area, and t represented the immersion time.
2.4 Electrochemical measurement
The potentiodynamic polarization and EIS measurement were carried out by a CS350 electrochemical workstation, and the electrolyte was 3.5 % NaCl solution. A typical three electrode system was applied for all the electrochemical measurement. The system was composed of a saturated calomel electrode (SCE) as reference electrode, a platinum sheet as counter electrode and the coated magnesium alloy sample as working electrode. Before each electrochemical test, the working electrode was immersed in 3.5 % NaCl solution until the open circuit potential (OCP) to be stable. In each potentiodynamic polarization test, the potential scanning rate was 0.5 mV/s and the potential scanning range was from -0.4 VOCP to 0.2 VOCP. In each EIS test, a perturbation potential of 10 mV amplitude
was applied in the frequency range from 105 Hz to 10-2 Hz.
Both each immersion test and each electrochemical measurement was performed at ambient temperature.
2.5 Microstructure and composition
The surface SEM morphology of each sample was observed by a ZEISS-EV018 SEM instrument, and the corresponding chemical composition was analyzed by energy dispersion X-ray spectroscopy (EDS) instrument attached on the SEM system.
3. RESULTS AND DISCUSSION
3.1 Immersion test
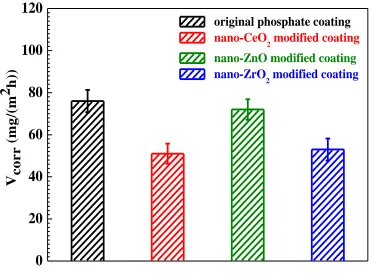
Fig. 1 shows the corrosion rate of the magnesium alloy samples with the original coating and with the modified coatings. It is seen that the effect of nano-particle addition on the corrosion rate (Vcorr) is very obvious. The sample with the Ce coating presents the lowest value of Vcorr about 50 mg /
(m2·h), and the Vcorr value for the sample with the Zr coating is slightly larger than that for the sample
with the Ce coating. However, the sample with the original coating presents the highest value of Vcorr
about 75 mg / (m2·h), and the Vcorr values for the samples with the Zn coating and with original coating
0
20
40
60
80
100
120
original phosphate coating nano-CeO
2 modified coating nano-ZnO modified coating
nano-ZrO
2 modified coating
V
c
o
r
r
(
m
g
/(
m
2
h
))
Figure 1. Corrosion rate of magnesium alloy samples with the original coating and with the modified coatings.
The above results of immersion test indicate that the modification efficiency increases in the order: nano-ZnO < nano-ZrO2< the nano-CeO2.
3.2 Potentiodynamic polarization measurement
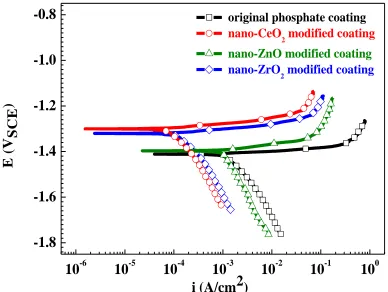
Fig. 2 shows the potentiodynamic polarization curves of the magnesium alloy samples with the original coating and with the modified coatings in 3.5 % NaCl solution. It is seen that the four samples presented the electrochemical characteristic of active dissolution in 3.5 % NaCl solution, and the corrosion behavior was controlled by the cathodic process mainly. However, although there is no effect of nano-particle type on the electrochemical characteristic, it is very obvious that its effect on corrosion potential (Ecorr), corrosion current density (icorr) and Tafel slope (βK). According to the
[image:5.596.100.473.103.378.2]
10
-610
-510
-410
-310
-210
-110
0-1.8
-1.6
-1.4
-1.2
-1.0
-0.8
original phosphate coatingnano-CeO
2 modified coating nano-ZnO modified coating
nano-ZrO
2 modified coating
i (A/cm2)
E
(V
S
C
E
)
[image:6.596.85.473.108.400.2]Figure 2. Potentiodynamic polarization curves of magnesium alloy samples with the original coating and with the modified coatings in 3.5 % NaCl solution.
Table 2. Calculated values of corrosion electrochemical parameters.
Ecorr (VSCE) icorr (A/cm2) βK (mV/dec.)
Original phosphate coating -1.41 1.24×10⁻³ 227.36
Nano-CeO2 modified coating -1.30 6.82×10⁻⁵ 296.97
Nano-ZnO modified coating -1.40 1.08×10⁻³ 234.03
Nano-ZrO2 modified coating -1.32 1.06×10⁻⁴ 285.49
It is seen that the sample with the Ce coating presents the most positive value of Ecorr and the
lowest value of icorr, and its icorr value is decreased by more than one order of magnitude in comparison
with the corresponding values for the samples with the other coatings, indicating the best modification efficiency of nano-CeO2. However, the values of Ecorr and icorr for the samples with the original coating
and with the Zn coating are in the same order of magnitude and even very approximate, indicating that the effect of nano-ZnO addition on the corrosion resistance is negligible. It is notable that the icorr value
[image:6.596.50.554.501.611.2]
than those for the samples with the original coating and the Zn coating, indicating that the modification efficiency of nano-ZrO2 is moderate. At the same time, according to the values of βK, it is seen that the
βK value for the sample with the Ce coating is slightly larger than that for the sample with the Zr
coating, and both of the above values are obviously larger than the corresponding values for the samples with the Zn coating and the original coating, indicating that the corrosion resistance is better for the Ce coating and the Zr coating than for the Zn coating and the original coating, particularly for the Ce coating with the best corrosion resistance.
On the other hand, in the same corrosion electrolyte (3.5 % NaCl solution), Cheng et al. [16] reported that the icorr value for the AZ31 alloy with the optimum phosphate coating was 0.858 mA/cm2,
and Han et al. [17] reported that the values of icorr for the AZ91D alloys with the corresponding
coatings formed in different pH treatment baths were in the range from 10 µA / cm2
to 100 µA / cm2. Further, in 5.0 % NaCl solution, Zhao et al. [18] reported that the icorr value for the AZ91D alloy with
the chromium-free and phosphate-permanganate coating was 0.5858 mA/cm2, and Lian et al. [19] reported that the corresponding value for the some alloy with the modified phosphate coating was 0.02 mA /cm2. However, compared with previous reports [16-19], the nano-CeO2 modified coating presents
a low value of icorr and has good corrosion resistance.
3.3 EIS measurement
0
2000
4000
6000
8000
0
2000
4000
6000
original phosphate coating
nano-CeO2 modified coating
nano-ZnO modified coating
nano-ZrO2 modified coating
Zr
(
k
cm2
)
Z
i
(
k
cm
2
)
[image:7.596.92.469.410.695.2]
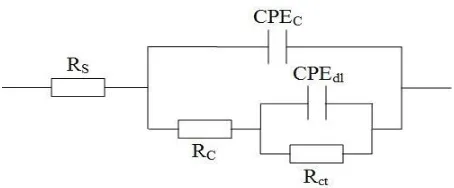
Figure 4. Equivalent electrical circuit for EIS analysis.
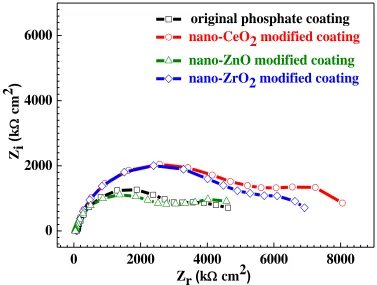
Fig. 3 shows the EIS of the magnesium alloy samples with the original coating and with the modified coatings in 3.5 % NaCl solution. It is seen that the Nyquist plots for the four samples are composed of two capacitive semicircles: one is at the high frequency region and the other one is at the medium and low frequency region. It was confirmed that for magnesium alloys with surface protection layer in corrosion media, the high frequency capacitive semicircle was due to the presence of surface protection layer, and the low frequency capacitive semicircle was attributed to the occurrence of charge transfer on magnesium alloys surface [5,9]. The semicircle radius of the sample with the Ce coating is slightly larger than that of the sample with the Zr coating, which is obviously larger than the semicircle radii for the samples with the Zn coating and with the original coating, indicating that the corrosion resistance for the Ce coating and the Zr coating is better than that for the Zn coating and the original coating, which is consistent to the results of potentiodynamic polarization.
The equivalent electrical circuit shown in Fig. 4 could be applied to analyze the EIS results according to the Nyquist plots shown in Fig. 3 and the previous studies [5,9,20]. In the equivalent electrical circuit, RS represents the solution resistance, CPEC and RC represent the coating capacitance
and the coating resistance, and CPEdl and Rct represent the double layer capacitance and the charge
[image:8.596.185.412.87.181.2]transfer resistance. The fitted values of coating resistance and charge transfer resistance are listed in Table 3.
Table 3. Fitted values of coating resistance and charge transfer resistance.
RC (kΩcm2) Rct (kΩcm2)
Original phosphate coating
3245.05 1380.55
Nano-CeO2 modified
coating
5617.49 2438.58
Nano-ZnO modified coating
2774.50 1803.39
Nano-ZrO2 modified
coating
5283.49 1632.99
[image:8.596.75.520.569.697.2]
Zr coating in 3.5 % NaCl solution are 3245.05 kΩcm2, 5617.49 kΩcm2, 2774.50 kΩcm2
and 5283.49 kΩcm2
, respectively. On the other hand, it was reported that the charge transfer resistance could reflect the actual corrosion area on electrode surface, and the larger the charge transfer resistance value the smaller the corrosion area. The Rct values of the original coating, the Ce coating, the Zn coating and
the Zr coating in 3.5 % NaCl solution are respectively1380.55 kΩcm2, 2438.58 kΩcm2
, 1803.39 kΩcm2
and 1632.99 kΩcm2.
From the above results of immersion test and electrochemical measurement, it is seen that the modification efficiency of the three nano-particles for the corrosion resistance increased in the order: (weak) nano-ZnO < nano-ZrO2 < the nano-CeO2 (strong). The related modification mechanism
would be discussed subsequently.
3.4 Microstructure
(a) (b)
(c) (d)
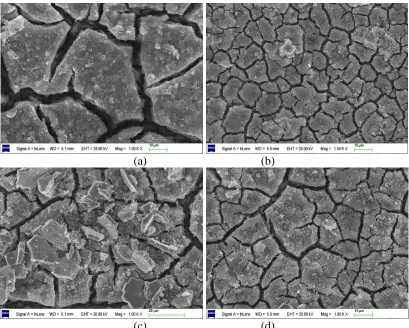
Figure 5. Surface SEM morphologies of the original coating and the modified coatings: (a) the original coating, (b) the Ce coating, (c) the Zn coating and (d) the Zr coating.
[image:9.596.94.503.293.621.2]
particularly for the Ce coating, too. Muller et al. [22] reported the nucleation over potential of surface protection layer could be shifted to the negative direction when nano-particles were added into treatment baths, which was beneficial to the initiation and growth of crystal nucleus and the formation of fine and exquisite crystal clusters. Therefore, it is concluded that the nano-particle addition results in the crack decrease and the crystal refinement, which is favorable to the corrosion resistance of phosphate coatings [18].
In addition, for the Zn coating shown in Fig. 5c, many lath-shaped precipitates can be observed on the coating surface. EDS analysis revealed that the precipitates were composed of Zn and O with the atom ratio of 0.97 to 1.03, indicating that the precipitates were zinc oxide.
3.5 Composition
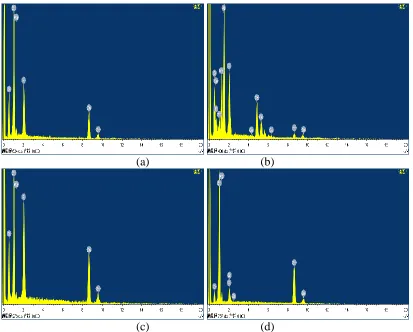
Fig. 6 shows the EDS spectra of the magnesium alloy samples with the original coating and with the modified coatings. For the original coating and the Zn coating, the EDS results provide the evidence for the presence of Zn, P, O and Mg, as shown in Fig. 6a and 6c, which is consistent to previous reports [3]. The elements of Zn, P and O are attributed to the presence of hopeite in the coatings, which was the main composition of phosphate conversion coatings [8].
(a) (b)
(c) (d)
[image:10.596.93.506.388.720.2]
The Mg element may come from the magnesium alloy substrate or the phosphate coatings [3]. In contrast, the Ce coating is composed of Zn, P, O, Mg and Ce shown in Fig. 6b, and the Ce element is due to the presence of CeO2 in the Ce coating, which was consistent to Zuo et al. [13] and Zeng et al.
[23] s’ reports. Similar to the Ce coating, the Zr coating is composed of Zn, P, O, Mg and Zr, as shown in Fig. 6d.
3.6 Modification mechanism
From the above results, it is seen that the corrosion resistance for the modified coatings is strengthened compared with that for the original coating, especially for the nano-CeO2 modified
coating and the nano-ZrO2 modified coating. The mechanism of nano-particle modification is
discussed and compared as follows.
Li et al. [5] reported that phosphate conversion coatings mainly provided a mechanical barrier for magnesium alloy substrate to isolate corrosion electrolytes. As insoluble solid substances, the presence of nano-particles in surface protection layer could strengthen the shielded function [13]. Hinton et al. [24] reported that due to the presence of mechanical barrier on metal and alloy surface, the diffusion and permeation process of oxygen molecule could be inhibited, which acted as a main electrochemical species for cathodic reaction. Further, Li et al. [5] also reported that when phosphate coatings were exposed in electrolytes, the occurrence of cathodic reaction mainly focused on crystal clusters, and the anodic reaction mainly occurred on naked magnesium alloy surface, especially on coating defects. As a kind of main coating defect, many cracks are observed on both the original coating and the modified coating surface in this work, as shown in Fig. 5. It is seen obviously that the crack ratio and size for the modified coatings is decreased significantly compared with those for the original coating, indicating the occurrence of anodic reaction could be inhibited on the modified coating surface. On the other hand, it was accepted generally that the grain refinement was beneficial to the corrosion resistance of surface protection layer [25-27]. As shown in Fig. 5, the crystal cluster size of the modified coatings was refined obviously in comparison with that of the original coating. Therefore, from the results of immersion test and electrochemical measurement, it is seen that the corrosion resistance of the modified coatings is better than that of the original coating.
However, the modification efficiency of the three nano-particles is obviously different, which increases in the order: nano-ZnO < nano-ZrO2 < the nano-CeO2. The Ce coating presents the least
crack ratio and the finest crystal cluster shown in Fig. 5b, indicating the Ce coating presents best corrosion resistance, which is confirmed by the results of immersion test and electrochemical measurement. However, the crack ratio and size for the Zn coating and the Zr coating is very similar, which is less than that for the original coating. Therefore, it seems that the corrosion resistance of the Zn coating should be approximate to that of the Zr coating, but the icorr value of the sample with the Zn
coating is higher than that with the Zr coating shown in Table 2 and the Rc value for the Zn coating is
revealed that the precipitates were zinc oxide. As a cathodic phase, the presence of ZnO precipitates on the Zn coating surface not only can damage the surface homogeneity but also can compose the electrochemical micro-couple with the naked surface, resulting in that the corrosion resistance of the Zn coating was decreased compared with that of the Zr coating.
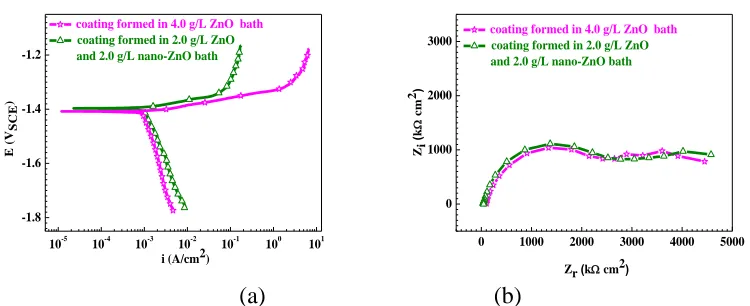
In addition, in order to confirm the effect of nano-ZnO on the corrosion resistance, a magnesium alloy sample was immersed in a treatment bath (ZnO, 4.0 g/L; H3PO4, 12.0 g/L; NaF, 1.0
g/L; C4H4O6Na2, 4.0 g/L; NaNO3 6.0 g/L; Na4P2O7, 0.5 g/L) to prepare a phosphate coating, which
was compared with the Zn coating prepared in the nano-ZnO bath (ZnO, 2.0 g/L; nano-ZnO, 2.0 g/L; H3PO4, 12.0 g/L; NaF, 1.0 g/L; C4H4O6Na2, 4.0 g/L; NaNO3 6.0 g/L; Na4P2O7, 0.5 g/L). It is obviously
that the main difference between the former bath and the latter bath was the ratio of ZnO and nano-ZnO, and the total amount of two elements is equal. Fig. 7 shows the potentiodynamic polarization curves and the EIS of the magnesium alloy samples with the phosphate coating formed in the bath containing 4.0 g/L ZnO and with the Zn coating formed in the bath containing 2.0 g/L ZnO and 2.0 g/L nano-ZnO. It is seen that the corrosion current density, Tafel slope and capacitive semicircle radius for the two samples are very approximate, confirming that the addition of nano-ZnO is not competent and feasible to strengthen the corrosion resistance of the original phosphate coating. However, the detailed reason needs to further studies.
10-5 10-4 10-3 10-2 10-1 100 101
-1.8 -1.6 -1.4 -1.2
coating formed in 4.0 g/L ZnO bath
coating formed in 2.0 g/L ZnO and 2.0 g/L nano-ZnO bath
i (A/cm2) E (V S C E )
0 1000 2000 3000 4000 5000
0 1000 2000 3000
coating formed in 4.0 g/L ZnO bath
coating formed in 2.0 g/L ZnO and 2.0 g/L nano-ZnO bath
Zi ( k cm 2)
Zr (k cm2)
(a) (b)
Figure 7. Potentiodynamic polarization curves and EIS of magnesium alloy samples with the phosphate coating formed in the bath containing 4.0 g/L ZnO and with the Zn coating formed in the bath containing 2.0 g/L ZnO and 2.0 g/L nano-ZnO.
4. CONCLUSIONS
In this work, three nano-particles — nano-CeO2, nano-ZnO and nano-ZrO2 — were applied to
strengthen the corrosion resistance of the original phosphate coating. The modification efficiency increased in the order: (weak) nano-ZnO < nano-ZrO2 < the nano-CeO2 (strong). Nano-CeO2 and
nano-ZrO2 presented better function, whereas the addition of nano-ZnO was useless. The modification
[image:12.596.108.483.404.557.2]
ACKNOWLEDGEMENTS
This work is supported by the opening funds of Key Laboratory for Green Chemical Process of Ministry of Education (GCP201504) and Hubei Key Laboratory of Novel Chemical Reactor & Green Chemical Technology (NRGCT201504).
References
1. M. Tamilselvi, P. Kamaraj, M. Arthanareeswari and S. Devikala, Appl. Surf. Sci., 327 (2015) 218. 2. C.D. Gu, W. Yan, J.L. Zhang and J.P. Tu, Corro. Sci., 106 (2016) 108.
3. L.Y. Niu, Z.H. Jiang, G.Y. Li, C.D. Gu and J.S. Lian, Surf. Coat. Tech., 200 (2006) 3021. 4. R. Amini and A.A. Sarabi, Appl. Surf. Sci., 257 (2011) 7134.
5. Q. Li, S.Q. Xu, J.Y. Hu, S.Y. Zhang, X.K. Zhong and X.K. Yang, Electrochim. Acta, 55 (2010) 887.
6. L.Y. Niu, G.Y. Li, Z.H. Jiang, L.P. Sun, D. Han and J.S. Lian, Trans. Nonferrous. Met. Soc. China, 16 (2006) 567.
7. Y. Zhou, Q.Y. Xiong, J.P. Xiong and J.Y. He, Int. J. Electrochem. Sci., 9 (2014) 5258.
8. R.C. Zeng, Z.D. Lan, L.H. Kong, Y.D. Huang and H.Z. Gui, Surf. Coat. Tech., 205 (2011) 3347. 9. Z.Y. Yong, J. Zhu, C. Qiu and Y.L. Liu, Appl. Surf. Sci., 255 (2008) 1672.
10.Sh. Ammar, K. Ramesh, B. Vengadaesvaran, S. Ramesh and A.K. Arof, Electrochim. Acta, 220 (2016) 417.
11.R. U. Din, V.C. Gudla, M.S. Jellesen and R. Ambat, Surf. Coat. Tech., 296 (2016) 1.
12.E. Klyatskina, E. Rayon, G. Darut, M.D. Salvador, E. Sanchez and G. Montavon, Surf. Coat. Tech., 278 (2015) 25.
13.Z.Z. Han, Y. Zuo, P.F. Ju, Y.M. Tang, X.H. Zhao and J.T. Tang, Surf. Coat. Tech., 206 (2012) 3264.
14.S.Y. Shen and Y. Zuo, Corros. Sci., 87 (2014) 167.
15.Q.Y. Xiong, Y. Zhou and J.P. Xiong, Int. J. Electrochem. Sci., 10 (2015) 8454.
16.Y.L. Cheng, H.L. Wu, Z.H. Chen, H.M. Wang and L.L. Li, Trans. Nonferrous. Met. Soc. China, 16 (2006) 1086.
17.F. Liu, D.Y. Shan, E.H. Han and C.S. Liu, Trans. Nonferrous. Met. Soc. China, 18 (2008) s344. 18.M. Zhao, S.S. Wu, J.R. Luo, Y. Fukuda and H. Nakae, Surf. Coat. Tech., 200 (2006) 5407. 19.G.Y. Li, J.S. Lian, L.Y. Liu, Z.H. Jiang and Q. Jiang, Surf. Coat. Tech., 201 (2006) 1814. 20.J.E. Gray and B. Luan, J. Alloy. Compd., 336 (2002) 88.
21.X.Y. Lu, Y. Zuo, X.H. Zhao, Y.M. Tang and X.G. Feng, Corros. Sci., 53 (2011) 153. 22.B. Muller and H. Ferkel, Nanostruct. Mater., 10 (1998) 1285.
23.R.C. Zeng, Y. Hu, F. Zhang, Y.D. Huang, Z.L. Wang, S.Q. Li and E.H. Han, Nonferrous. Met. Soc. China, 26 (2016) 472.
24.B.R.W. Hinton and L. Wilson, Corros. Sci., 29 (1989) 967. 25.Y. Zhou and F.A. Yan, Int. J. Electrochem. Sci., 11 (2016) 3976.
26.L. Kouisni, M. Azzi, M. Zertoubi, F. Dalard and S. Maximovitch, Surf. Coat. Tech., 185 (2004) 58. 27.L. Kouisni, M. Azzi, F. Dalard and S. Maximovitch, Surf. Coat. Tech., 192 (2005) 239.