This is a repository copy of
Microstructure and Phase Assemblage of Low-Clinker
Cements during Early Stages of Carbonation
.
White Rose Research Online URL for this paper:
http://eprints.whiterose.ac.uk/96991/
Version: Accepted Version
Proceedings Paper:
Herterich, J, Black, L and Richardson, I (2014) Microstructure and Phase Assemblage of
Low-Clinker Cements during Early Stages of Carbonation. In: Bernal, SA and Provis, JL,
(eds.) Proceedings. 34th Cement and Concrete Science Conference, 14-17 Sep 2014,
Sheffield, UK. University of Sheffield , pp. 137-140.
This is an author produced version of a paper published in the Proceedings of the 34th
Annual Cement and Concrete Science Conference, and Workshop on Waste Cementation.
[email protected] https://eprints.whiterose.ac.uk/
Reuse
Unless indicated otherwise, fulltext items are protected by copyright with all rights reserved. The copyright exception in section 29 of the Copyright, Designs and Patents Act 1988 allows the making of a single copy solely for the purpose of non-commercial research or private study within the limits of fair dealing. The publisher or other rights-holder may allow further reproduction and re-use of this version - refer to the White Rose Research Online record for this item. Where records identify the publisher as the copyright holder, users can verify any specific terms of use on the publisher’s website.
Takedown
If you consider content in White Rose Research Online to be in breach of UK law, please notify us by
34th Cement and Concrete Science Conference Paper Number 125 14-17 September 2014
University of Sheffield
Microstructure and Phase Assemblage of Low-Clinker
Cements during Early Stages of Carbonation
J. Herterich, L. Black and I. Richardson
Institute for Resilient Infrastructure, School of Civil Engineering, University of Leeds
ABSTRACT
This study investigates the effects of carbonation following short curing periods (72 hours) on CEMI and composite cement systems (30% PFA, 30% & 60% GGBS). Modifications in carbonation behavior were observed compared to ‘idealised’/28 day lab cured samples and accelerated carbonation testing. Furthermore, the rate and extent of carbonation and the nature of the carbonate species formed is dependent on the level of replacement, the replacement material and the degree of hydration.
1. INTRODUCTION
Pulverised Fuel Ash (PFA) and Ground Granulated Blast Furnace Slag (GGBS) are industrial by-products commonly used as SCMs. Though the reduced rate of hydration is well established, both the PC and the SCM will hydrate simultaneously, yet there remains a lack of knowledge regarding the early age kinetics of the reactions taking place. This becomes of great importance should formwork be removed too soon where the reliance on models established for PC systems may no longer be suitable. Under such conditions, hydration will be very much incomplete, with previous research indicating minor or no reaction of PFA over the first 7 days [1,2] and
only slightly faster reaction rates for GGBS[3]. In
both cases the result will be an underdeveloped and exposed microstructure, possibly susceptible to ingress from aggressive species.
Further to this, the expected retardation of the rate of CO2 ingress typically observed in PC
systems is as a result of densification of the microstructure. This, however, is not concurrent with the behaviour exhibited in high replacement SCM cements, which are adversely affected by a coarser microstructure and greater porosity upon carbonation.
This project has examined the early stage carbonation behaviour of immature low-clinker binders. The work will attempt to examine differences between these systems and conventional studies on mature systems.
2. EXPERIMENTAL
Four paste systems (CEMI, and CEMI with replacement by 30% PFA, 30% & 60% GGBS)
at a w/b ratio of 0.57 were investigated. A CEM I 52.5R cement (free from limestone) was used, and replacement was by volume. Following preliminary work, and to mimic procedures commonly followed in practice, a curing length/t0 value of 72 hours was selected. This
allowed the systems to develop enough strength so as to allow sample preparation and conditioning, while still representing the short curing period typically employed in practice.
Samples were cast and sealed in small plastic vials and rotated for 72 hours in a temperature controlled laboratory (22 +/-2oC) before being
cut to a thickness of 0.5mm and subjected to conditioning at either ambient conditions (300-400ppm CO2, approx. 24oC) or in a CO2 free
environment. All samples were conditioned at a 72.6% relative humidity (RH) for up to 14 days. Characterisation was performed on the samples at t0, 1, 2, 4, 7 & 14 days.
Simultaneous Thermal Analysis (STA) data was collected using a Stanton Redcroft Simultaneous Thermal Analyser STA 780, under nitrogen, heating to 1100oC at a rate of
10oC/min. Attenuated Total Reflectance Fourier
Transform Infrared Spectroscopy (ATR-FTIR) data was collected using a Thermo Scientific Nicolet Is10 spectrometer, fitted with a Thermo Scientific Smart Diamond ATR sampling accessory, over a wave number range of 0– 4000cm-1. TEM images were collected on Ar
ion-beam milled samples using a FEI Tecnai TF20 FEG TEM.
3. RESULTS AND DISCUSSION
ATR-FTIR data were collected for all samples exposed to ambient CO2. Figure 1 displays the
carbonates between 1400 - 1500cm-1collected
for the 30% PFA system. Exposure to CO2 led
to an increase in CaCO3 content. Furthermore a
sizeable increase in carbonate content was observed between 2 and 4 days CO2 exposure.
Considering the normalised spectra for the silicate band and the Ca(OH)2 peak (Figure 2),
this considerable increase in carbonate content coincides with both the complete consumption of Ca(OH)2, as demonstrated in Figure 2(b),
and the decalcification of C-S-H, demonstrated by a shift in the silicate band (Figure 2(a)). This loss of buffering capacity allows carbonation to progress much more rapidly within the sample, and it appears that carbonation of C-S-H begins only once there is no more Ca(OH)2 available.
1000 1100 1200 1300 1400 1500 1600 1700 1800 1900 2000 20
40 60 80 100
A
b
s
o
rb
a
n
c
e
(
a
rb
.
u
n
it
s
)
Wave number (cm-1 )
t0
1 day - amb [CO
2]
2 day - amb [CO2] 4 day - amb [CO
2]
7 day - amb [CO2]
14 day - amb [CO2]
2 days
4 days
Figure 1. ATR-FTIR data for 30% PFA showing CaCO3
content between 1000 – 2000cm-1
1000
500 3500
Figure 2. Normalised ATR-FTIR spectra for 30% PFA for
(a) silicate bands and (b) Ca(OH)2 peak (3643cm-1)
Similar behaviour was observed for all samples, but at different lengths of exposure. For the CEMI system this occurred between 4 and 7 days, then between 2 and 4 days for the 30% GGBS system and 1-2 days for the 60% GGBS system. The lower initial Ca(OH)2 content in the
composite blends resulted in a loss of buffering capacity at an earlier age compared with CEMI systems, behaviour exacerbated with increasing levels of replacement.
Table 1 displays the Ca(OH)2 and CaCO3
contents calculated from the STA data. A large increase in carbonate content was seen with the entire, or almost nearly entire, consumption of Ca(OH)2, consistent with the ATR-FTIR data.
Furthermore, faster more extensive carbonation was observed for both composite systems at 30% replacement compared to the CEMI sample. This highlights the more adverse effect of improper curing on composite cement materials. Composite materials, with slower rates of hydration, subjected to curing lengths of only a few days will exhibit open and underdeveloped microstructures, in which carbonation rate will occur much more rapidly.
This behaviour between ‘idealised’/28 day lab
cured samples and a more realistic curing length emphasises the need for updated carbonation models and approaches.
Table 1. Calculated Ca(OH)2 and CaCO3 contents from TGA data
Ca(OH)2 content (%) CaCO3 content (%) CEMI
t0 17.69 2.59
1 day amb [CO2] 16.51 4.12
2 day amb [CO2] 15.09 7.74
4 day amb [CO2] 8.65 18.79
7 day amb [CO2] 1.74 33.88
14 day amb [CO2] 0.00 47.49
7 day 0% [CO2] 17.99 0.00
14 day 0% [CO2] 18.82 0.00
30% PFA
t0 13.97 1.66
1 day amb [CO2] 11.35 8.59
2 day amb [CO2] 8.56 16.37
4 day amb [CO2] 0.00 37.67
7 day amb [CO2] 0.00 41.59
14 day amb [CO2] 0.00 51.37
7 day 0% [CO2] 14.46 1.18
14 day 0% [CO2] 14.16 3.81
30% GGBS
t0 12.80 1.63
1 day amb [CO2] 11.03 6.80
2 day amb [CO2] 9.13 12.25
4 day amb [CO2] 2.52 28.74
7 day amb [CO2] 0.00 37.65
14 day amb [CO2] 0.00 47.46
7 day 0% [CO2] 12.65 0.00
14 day 0% [CO2] 13.12 1.62
60% GGBS
t0 8.15 1.48
1 day amb [CO2] 5.31 12.36
2 day amb [CO2] 0.00 25.44
4 day amb [CO2] 0.00 26.43
7 day amb [CO2] 0.00 30.82
14 day amb [CO2] 0.00 32.83
7 day 0% [CO2] 6.89 0.00
14 day 0% [CO2] -
-t0
1 day
2 day
4 day
7 day
[image:3.595.74.295.268.435.2] [image:3.595.321.515.375.751.2] [image:3.595.70.254.468.660.2]Furthermore the extent of carbonation was affected by both the replacement material and level. Although similar carbonation behaviour was observed for the materials with equal replacement levels, carbonation occurred to a greater degree, and at a faster rate, for the PFA system compared with the GGBS system. This is a reflection of the PFA’s slower reaction rate, effects magnified with decreasing curing length. Carbonation is initially much faster in the 60% GGBS sample, with a vast increase in carbonate content between t0 and 2 days (Table
1), however a plateau was reached at 4 days, with minimal subsequent carbonation, data supported by the ATR-FTIR data. This suggests that, with the limited degree of hydration likely in a high replacement system at an early age, all potential carbonatable hydration phases have been carbonated by this time.
STA and ATR-FTIR data showed that the samples conditioned in a CO2 free environment
indicated no continued hydration at 72.6% RH. Ho et. al[4] demonstrated that there is minimal
hydration at RH levels below 80%.
There are typically 3 decomposition modes associated with carbonation; mode I (780o –
990oC), mode II (680o – 780oC) and mode III
(550o – 680oC). The higher decomposition
modes, mode I & II, are responsible for the crystalline polymorphs of CaCO3 (calcite,
vaterite and aragonite), with mode I being principally attributed to very well crystallised CaCO3, i.e. calcite[5]. Mode III is believed to be
associated with amorphous CaCO3.
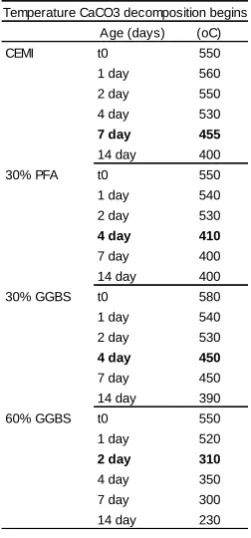
DTA data showed an increase in decomposition temperature with prolonged carbonation for all the samples, indicating the presence of better structured/crystallised CaCO3, or calcite, as
carbonation progresses. However, as the measurable level of carbonates increases, the mass loss associated with CaCO3 drops to a
lower temperature. This behaviour coincides with both the loss of Ca(OH)2 and the significant
increase in carbonate content as previously indicated by the ATR-FTIR and TGA data. This strongly indicates carbonation via decalcification of C-S-H, further corroborating the shift in silicate bands observed in the infrared spectra. It is considered that the carbonation of C-S-H corresponds to the formation of poorly crystallised and metastable forms of CaCO3, explaining the shift to a lower
decomposition mode exhibited here. Villain et. al[6] suggested the dissociation of stable CaCO
3
(calcite), attributed to Ca(OH)2 carbonation,
occurred between 650o – 950oC, while unstable
forms of vaterite and aragonite resulting from C-S-H carbonation dissociated between 530o –
650oC for highly hydrated (cured for 3 months)
mortar samples subjected to accelerated carbonation. Accelerated carbonation has been extensively researched, reporting the simultaneous carbonation of Ca(OH)2 and
C-S-H, with a much faster reaction rate of Ca(OH)2
initially observed, the rate decreasing as carbonate phases were produced at the crystal surface[7, 8]. The results presented here indicate
modifications in the carbonation mechanism between accelerated and natural carbonation, as well as between mature and immature specimens. Moreover carbonation at ambient CO2 concentrations for samples cured for 72
hours implies that it is the Ca(OH)2 phase
initially involved in the carbonation reaction, and once consumed carbonation of C-S-H begins.
Table 2. Temperature at which mass loss due to CaCO3 decomposition commenced.
Age (days) (oC)
CEMI t0 550
1 day 560
2 day 550
4 day 530
7 day 455
14 day 400
30% PFA t0 550
1 day 540
2 day 530
4 day 410
7 day 400
14 day 400
30% GGBS t0 580
1 day 540
2 day 530
4 day 450
7 day 450
14 day 390
60% GGBS t0 550
1 day 520
2 day 310
4 day 350
7 day 300
14 day 230
Temperature CaCO3 decomposition begins
Figure 3 shows TEM images obtained from a 72 hour old 30% GGBS paste after exposure for 4 days at both (a) 0% CO2 and (b) ambient
CO2 concentrations. The foil like morphology of
[image:4.595.355.481.296.566.2]5 0 0 n m
5 0 0 n m
0 . 5 µ m
Figure 3. TEM images from an ion-milled 30% GGBS
sample cured for 72 hours before being exposed to (a) 4
days at 72.6% RH, 0% [CO2]; (b) 4 days at 72.6% RH,
ambient [CO2]
4. CONCLUSIONS
Carbonation of immature paste samples was followed by a range of characterisation techniques. There was no continued hydration and changes were due to carbonation only.
CEMI systems showed better carbonation resistance compared to composite systems following 72 hours curing. More extensive carbonation was evident in the composite systems, behaviour attributed to a more porous material with a less developed microstructure.
A notable increase in carbonation was observed as Ca(OH)2 was completely consumed, the loss
of buffering capacity allowing carbonation to occur more rapidly. This coincided with C-S-H decalcification, confirmed by ATR-FTIR, TGA &
TEM data. This occurred at an earlier age with increasing levels of replacement, believed to be a result of the already initially lower Ca(OH)2
content typical of composite cement materials.
DTA data showed a shift in decomposition temperature as carbonation initially progressed, indicating the formation of better structured/well crystallised CaCO3 with increasing carbonate
content. However, as carbonation continued, a drop in CaCO3 decomposition temperature was
observed, coinciding with the consumption of Ca(OH)2. This lower temperature also indicated
CaCO3 formation due to carbonation of C-S-H.
Carbonation of Ca(OH)2 and C-S-H did not
occur simultaneously, decalcification of C-S-H only beginning once Ca(OH)2 had been
consumed.
TEM images verified carbonation of OP C-S-H. Carbonation appears to have affected the OP foil like hydrate phase only, a coarsening of the microstructure was clearly visible.
REFERENCES
[1] Fraay, A.L.A., J.M. Bijen, and Y.M. de Haan, The reaction of fly ash in concrete a critical examination. Cem. Con. Res., 1989. 19(2): p. 235-246.
[2] Deschner, F., et al., Hydration of Portland cement with high replacement by siliceous fly ash. Cem. Con. Res., 2012. 42(10): p. 1389-1400.
[3] Escalante, J.I., et al., Reactivity of blast-furnace slag in Portland cement blends hydrated under different conditions. Cem. Con. Res., 2001. 31(10): p. 1403-1409.
[4] Ho, D.W.S., Q.Y. Cui, and D.J. Ritchie, The influence of humidity and curing time on the quality of concrete. Cem. Con. Res., 1989. 19(3): p. 457-464.
[5] Thiery, M., Villain, G., Dangla, P., Platret, G., 2007. Investigation of the carbonation front shape on cementitious materials: Effects of the chemical kinetics. Cem. Con. Res., 37(7): 1047-1058. [6] Villain, G., M. Thiery, and G. Platret, Measurement
methods of carbonation profiles in concrete: Thermogravimetry, chemical analysis and gammadensimetry. Cem. Con. Res., 2007. 37(8): p. 1182-1192.
[7] Groves, G.W., et al., Progressive Changes in the Structure of Hardened C3S Cement Pastes due to Carbonation. Journ. Am. Cer. Soc., 1991. 74(11): p. 2891-2896.
[8] Thiery, M., et al., Investigation of the carbonation front shape on cementitious materials: Effects of the chemical kinetics. Cem. Con. Res., 2007. 37(7): p. 1047-1058.
ACKNOWLEDGEMENT
Acknowledgement would like to be given to Nanocem for the funding of this research.
IP
OP (b) (a)
[image:5.595.72.285.71.497.2]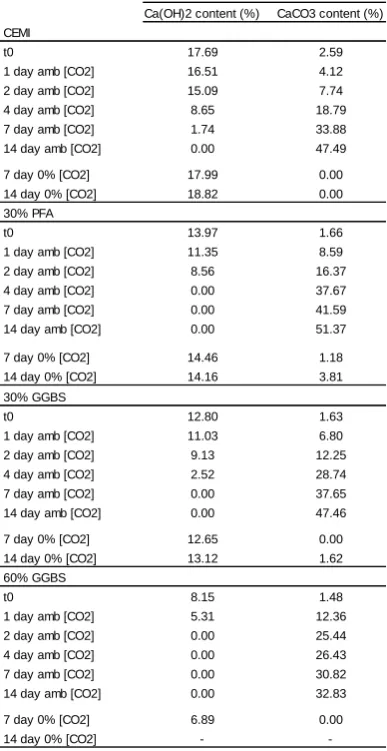
![Figure 3. TEM images from an ion-milled 30% GGBS sample cured for 72 hours before being exposed to (a) 4 days at 72.6% RH, 0% [CO2]; (b) 4 days at 72.6% RH, ambient [CO2]](https://thumb-us.123doks.com/thumbv2/123dok_us/7937618.194885/5.595.72.285.71.497/figure-images-milled-ggbs-sample-cured-exposed-ambient.webp)
