Thin Film Components
For Solid Oxide Fuel Cells (SOFCs)
Thesis submitted in accordance with the requirements of the University of Liverpool for the degree of
Doctor in Philosophy by:
Natasha Louise Olenka Flack
September 2014
Supervised by:
Contents
Page
Abstract
vAcknowledgements
viDeclaration
viiList of Abbreviations
viiiChapter 1 - Introduction
1.1 Fuel Cells 1
1.2 Solid Oxide Fuel Cells 2
1.2.1 μ-Solid Oxide Fuel Cells 5
1.3 Thin Film Components For SOFCs 6
1.4 Superlattice Growth 9
1.5 Materials of Interest 10
1.5.1 Strontium Titanate 10
1.5.2 Electrolyte Materials 11
1.5.2.1 Samarium Doped Ceria 12 1.5.2.2 Yttria-stabilised Zirconia 12
1.5.3 Cathode Materials 13
1.5.3.1 Neodymium Barium Cobalt Oxide 14 1.5.3.2 Barium Calcium Yttrium Iron Oxide 15
1.6 Thesis Overview 17
1.7 References 18
Chapter 2 - Methodology
2.1 Film Growth Techniques 29
2.1.1 Pulsed Laser Deposition 29
2.1.1.1 History of PLD 29
2.1.1.2 PLD Growth Mechanism 30
2.1.1.3 PLD Setup 33
2.2 Target preparation 35
2.3 Substrate Considerations 38
2.4 Crystal Structure 39
2.4.1 Miller Indices 40
2.5 Characterisation 42
2.5.1 X-ray Scattering 42
2.5.1.1 History of X-ray Diffraction 42 2.5.1.2 Fundamental Concepts 42 2.5.2 Thin Film X-ray Scattering Techniques 44
2.5.2.1 X-ray Diffraction 44
2.5.2.3 Phi Scan 47
2.5.2.4 Pole Figures 50
2.5.2.5 Reciprocal Space Maps 51
2.5.2.6 X-ray Reflectivity 51
2.5.3 Atomic Force Microscopy 55
2.5.4 Optical Microscopy 57
2.5.5 Transmission Electron Microscopy and Scanning Electron Microscopy
58
2.5.5.1 Transmission Electron Microscopy 58 2.5.5.2 Scanning Transmission Electron Microscopy 58 2.5.5.3 Scanning Electron Microscopy and Energy
Dispersive X-Ray Analysis
59
2.5.5.4 Raman Spectroscopy 60
2.5.6 AC Impedance Spectroscopy 61
2.6 References 67
Chapter 3 - Neodymium Barium Cobalt Oxide
3.1 Introduction 71
3.2 Growth Optimisation 73
3.2.1 PLD Target Preparation 73
3.2.2 Optimising Growth Conditions 77
3.3 Structural Characterisation 78
3.3.1 XRD 78
3.3.2 AFM 79
3.4 Thermal Stability 80
3.4.1 Effect of Oxygen Content 85
3.5 SDC/ NBCO Multilayers 87
3.5.1 Motivation 87
3.5.2 Growth optimisation 88
3.5.2.1 SDC optimisation 88
3.5.2.2 Growth rate calibration 93
3.5.5 SDC/NBCO bilayer films 96
3.5.6 SDC/NBCO Multilayers 100
3.5.7 Structural characterisation 106
3.5.8 Thermal Stability of the Multilayers 110
3.5.9 TEM 115
3.5.9.1 5 nm SDC/NBCO 116
3.5.9.2 Film 3 - 2 nm SDC/NBCO 119 3.5.9.3 Film 1 - 2 nm SDC/NBCO 126 3.5.9.4 2 nm SDC/NBCO Film Comparison 128
3.6 Conclusions 131
3.7 References 133
Chapter 4 -
Barium Calcium Yttrium Iron Oxide
4.2 Growth Optimisation 140
4.3 Structural Characterisation 148
4.3.1 XRD 148
4.3.2 TEM 161
4.4 Physical Properties 168
4.4.1 Thermal Stability 168
4.4.2 AC Impedance 169
4.5 Conclusions 178
4.6 References 181
Chapter 5 - Area Specific Resistance Measurements for
Thin Film Cathodes
5.1 Ba1.7Ca2.4Y0.9Fe5O13 ASR Motivation 183
5.2 Literature of ASR Geometries 184
5.3 ASR Geometries 187
5.3.1 Geometry One 187
5.3.2 Geometry Two 192
5.3.2.1 Stability of the 10 Layer Ink and Film 197 5.3.2.2 Stability Tests of the 10 Layer Films 207 5.3.2.3 Further Stability Analysis 211
5.3.3 Geometry three 214
5.3.3.1 Experimental Prototype 233
5.4 Conclusions 246
5.5 References 248
Chapter 6 - Conclusions and Future Work
251Appendix 1 - Supplementary Information for NBCO
A1.1 Additional Information on the Growth of SDC Films 256 A1.2 Additional Information on the Growth of NBCO Films 266 A1.3 Additional Information on the DIFFaX Analysis 266
Appendix 2 - Supplementary Information for ASR
A2.1 Simulations for Geometry 3 273
Abstract
Thin film components for solid oxide fuel cells (SOFCs) have been investigated in this thesis. This work focuses on electrolyte materials such as samarium doped ceria (SDC) and cathode materials including neodymium barium cobalt oxide (NBCO) and barium calcium yttrium iron oxide.
Single layer growth of NBCO or SDC is achieved on single crystal strontium titanate (001) before these materials were grown via pulsed laser deposition as a bi-layer and multilayers. Ordered NBCO required deposition at 850°C, whereas it was found that the SDC grew with a lower surface roughness at lower temperatures of around 650°C. The motivation was to investigate how the conductivity is affected by the interfaces between these layers, as motivated by previous studies of yttrium stabilised zirconia (YSZ) with strontium titanate (STO). NBCO was found to be unstable at the temperatures required for AC impedance measurements. From the transmission electron microscopy (TEM) and Energy Dispersive X-ray (EDX) data there is likely migration of Nd into the SDC layers. The interfaces are also less sharp for the multilayer films deposited at the higher temperature for the SDC growth. However, in all cases the SDC growth appears more favourable in the TEM when compared to the NBCO, with some regions even showing Co-metal and fluorite structures potentially attributed to Co-Ox where we would expect to see the perovskite block.
Thin films of barium calcium yttrium iron oxide were grown on single crystal strontium titanate (001). The material is a candidate cathode for solid oxide fuel cells (SOFCs) and in the intermediate temperature (IT) region at 600°C the in-plane AC conductivity of the thin film is found to be 30.0Scm-1, significantly enhanced over 3.5Scm-1 found for the polycrystalline form. This is assigned to reduction of the grain boundary density and alignment of the planes predicted to have the highest electronic and ionic conductivities. The symmetry of the film appears to be tetragonal within the resolution of the measurements employed, as opposed to the orthorhombic symmetry of the bulk phase, which may be attributed to the in-plane structural match between the cubic STO substrate and the grown layer.
Acknowledgements
I would like to thank my supervisors Professor Matthew Rosseinsky and Professor Paul Chalker for allowing me the opportunity to undertake this PhD.
Throughout the course of my PhD I have worked with several inspirational post-docs; I would like to thank Dr. Sean McMitchell, Dr. Robert Palgrave, Dr. Pavel Borisov, Dr. Ruth Sayers, Dr. Jonathan Alaria, Dr. Ming Li, Dr. Marco Zanella, Dr. Marita O'Sullivan, Dr. Paritosh Wadekar, Dr. Troy Manning and Dr. Matthew Werner.
I would also like to thank Darren Hodgeman for his help and support throughout the PhD, and especially for assisting with his 10 layer ink in the ASR project.
Thanks also to everyone in the MJR group past and present, particularly the thin film sub group, and my colleagues in our office 3.14. I would also like to thank Jane Remmer, Dr. Hongjun Niu and Mike Chatterton for their continual support throughout the PhD. I would like to thank the Engineering and Physical Sciences Research Council for providing funding.
I will be eternally grateful to my fiancé David G. for his everlasting love and support, and for sticking by me through the rollercoaster ride which is a PhD!
Family is by far the most important part of my life and without my parents, Hugh and Michelle, and my siblings, Gemma and David, I'm sure I would have given up a long time ago! I am really grateful for their unconditional love and support. I would also like to thank Wendy, Alastair and Iain for their love and understanding.
The work presented in this thesis was carried out by myself, except where stated,
at the Chemistry Department, University of Liverpool between October 2010 and
September 2014 under the supervision of Prof. M.J. Rosseinsky and Prof. P.
Chalker. This work has not been submitted for any other degree at this or any
other university.
List of Abbreviations
10 layer Ba1.7Ca2.4Y0.9Fe5O13 (10 ap) AC Alternating Current
AC-AFM Alternating Contact Atomic Force Microscopy AFC Alkaline Fuel Cell
AFM Atomic Force Microscopy ALD Atomic Layer Deposition
ap Single Perovskite Unit Cell Length ASR Area Specific Resistance
CIP Cold Isostatic Press
CMD Centre of Materials Discovery CVD Chemical Vapour Deposition DMFC Direct Methanol Fuel Cell DP Double Perovskite (ap/ap/2ap) ECM Equivalent Circuit Model EDX Energy Dispersive X-ray
EELS Electron Energy Loss Spectroscopy EIS Electrochemical Impedance Spectroscopy EMAT Electron Microscopy for Materials Science FFT
FRA
Fast Fourier Transform
Frequency Response Analyser FWHM Full Width Half Maximum GBCO GdBaCo2O5
GDC Gadolinium Doped Ceria HAADF High Angle Annular Dark Field HR High Resolution
IT Intermediate Temperature LSC La0.8Sr0.2CoO(3-δ)
LSM La(1-x)SrxMnO(3-δ) MIEC
MBE MOCVD MOMBE
Mixed Ionic Electronic Conductor Molecular Beam Epitaxy
Metal-Organic Chemical Vapour Deposition Metal-Organic Molecular Beam Epitaxy
NASA National Aeronautics and Space Administration NBCO NdBaCo2O5
NiCaL Nanoinvestigation Centre at Liverpool ORR Oxygen Reduction Reaction
PAFC Phosphoric Acid Fuel Cell
PEMFC Proton Exchange Membrane Fuel Cell PLD Pulsed Laser Deposition
PPM Parts Per Million
PVD Physical Vapour Deposition
RC Rocking Curve
RE Rare Earth
RSM Reciprocal Space Maps
SDC Samarium Doped Ceria
SEM Scanning Electron Microscopy SOFC Solid Oxide Fuel Cell
SP Single Perovskite (ap/ap/ap) STO Strontium Titanate
SuperSTEM Aberration-Corrected Scanning Transmission Electron Microscopy TEM Transmission Electron Microscopy
UV Ultra Violet XRD X-ray Diffraction XRR X-ray Reflectivity
Chapter 1: Introduction
1.1 Fuel Cells
Fuel cells were originally conceived in 1839 by Sir William Robert Grove, who
discovered that reversing the electrolytic process could result in the generation of
electricity.1 Grove’s discovery was generally overlooked due to the more popular
fossil fuel-powered engines until the National Aeronautics and Space
Administration (NASA) started to use the technology in the 1960s. NASA
promoted the use of this fuel cell technology over other options because fuel cell
systems are of relatively low weight and low toxicity.2
All fuel cells operate on the same basic concept of reacting fuel and oxygen to
produce electricity. The essential components of a fuel cell are an anode, cathode,
electrolyte. An oxidant is delivered to the cathode, while a fuel is supplied to the
anode. The generated electrons are able to flow through an external circuit, which
can be used to power electrical devices.3
There are various types of fuel cells, with some examples including: proton
exchange membrane fuel cells (PEMFCs), direct methanol fuel cells (DMFCs),
alkaline fuel cells (AFCs), phosphoric acid fuel cells (PAFCs), molten carbonate
fuel cells and solid oxide fuel cells (SOFCs).4 The main focus of this thesis is
1.2 Solid Oxide Fuel Cells
The Solid Oxide Fuel Cell was originally derived from the Nernst lamp (also called the Nernst ‘glower’), which was developed by Walther Nernst in 1897.5
Nernst lamps used a ceramic rod composed of yttria-stabilised zirconia (YSZ) that
was heated to incandescence instead of a glowing tungsten filament. In 1943 it
was recognised that the conduction mechanism of the Nernst lamp stemmed from
the vacancies in the anion sublattice of the YSZ, and so the Nernst lamp is
considered to be one of the first commercially produced solid electrolyte gas cell.6
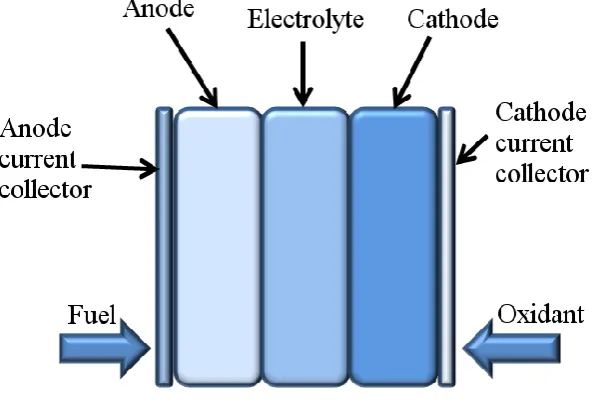
The SOFC is a high-temperature fuel cell that typically operates over a wide
temperature range from 800°C – 1000°C.7 As the electrolyte is a solid, high
operating temperatures are required in order to have sufficient ionic mobility
through the electrolyte so that ohmic losses are acceptably low. A schematic of a
[image:11.595.164.464.489.690.2]SOFC is shown in Figure 1.1.
CeO2 is a promising electrolyte in SOFC technology. The high performance of
CeO2 in this capacity is related to its high ionic conductivity,8 and has been
reported to become more effective when doped with a trivalent ion.9 The
underlying mechanism is thought to be increased mobility of oxygen ions through
the extrinsic oxygen vacancy defects created in ceria’s doped fluorite lattice to
maintain charge neutrality.10 In recent studies, Sm and Gd were found to be the
best trivalent dopant atoms for ceria in this regard11,12 and have since become a
focal point of fuel cell research intent on verifying and shedding light on the
underlying principles responsible for this enhanced oxygen mobility.12-14
Recently, considerable efforts have also been directed to intermediate-temperature
(500-700°C) SOFCs based on thin film electrolytes of Rare-Earth doped ceria,
RexCe1-xO(2-δ).15 Gadolinium doped ceria (GDC), for example, has been shown to
have improved conductivity over yttria stabilised zirconia (YSZ).16
Zirconia-based electrolytes, such as YSZ, have traditionally been used because of their
nearly pure oxygen ionic conductivity in both oxidizing and reducing
atmospheres, as well as good mechanical properties. However they require high
operating temperatures of over 900°C to maintain high oxygen ionic conductivity.
Such high operating temperatures result in high fabrication cost and accelerate
degradation of the fuel cell systems. Yttrium doped ceria, or just yttrium oxide
have also been shown to be possibilities for use as an electrolyte in
SOFCs operate under the general principle that oxygen is reduced to oxygen ions
at the cathode (see Equation 1.1) and these oxygen ions then migrate through the
electrolyte, which needs to be ionically conducting.
Eqn. (1.1)
The rate limiting step tends to be the surface oxygen exchange reaction, as is
typically the case for mixed ionic-electronic conductors.18 This reaction comprises
several steps, including gas phase diffusion, adsorption, dissociation, surface
diffusion of intermediate oxygen species, and oxygen incorporation. The presence
of surface atoms not terminated with oxygen (onto which O2 can be chemisorbed)
and surface oxygen vacancies are considered to play an essential role in the
reaction pathway for oxygen ion incorporation.19
The anode is required to be porous to allow the fuel to infiltrate into the anode and
to increase the surface area maximising fuel oxidation, forming water, electrons
and heat (see Equation 1.2).
Eqn. (1.2)
Typically, anode materials are required to be stable in reducing atmospheres and
transition metals are typically chosen due to their high catalytic activity, e.g.
composed of doped ceria or stabilized zirconia, in conjunction with high activity
toward the oxidation of hydrogen, and high electronic conductivity.20
Micro-solid oxide fuel cells (µ-SOFCs) are on a much smaller scale, with thin
films being utilised to dramatically decrease the thickness of the single cells.21
SOFCs have been rapidly developed for clean and efficient power generation. A
major advantage of SOFCs over other fuel cell types is the ability to use a variety
of fuels including, but not limited to many common hydrocarbon fuels such as
natural gas, diesel, gasoline, alcohol and coal gas.22 Another advantage with
SOFCs is that all the components are solid, and so fuel cells can be fabricated in
very thin layers, and cell components can be configured into unique shapes and
orientations unachievable in fuel cell systems that have a liquid electrolyte.3 With
the development of thin film technology, efforts have been made to progress
miniaturisation.23,24
1.2.1 µ-Solid Oxide Fuel Cells
Micro-solid oxide fuel cells (µ-SOFCs) are potentially highly efficient, and would
be useful as high energy-density replacements for batteries in the mW to W power
generation for portable consumer and military electronic devices.21 µ-SOFCs
offer great advantages over their macroscopic counterparts, such as lower
operating temperatures (approximately 550°C), easy integration with the required
application in the portable electronic device market. A schematic of a µ-SOFC is
shown in Figure 1.2.
Figure 1.2: Schematic of a µ-SOFC adapted from.26
1.3 Thin Film Components for SOFCs
In the methodology, Chapter 2, more detail can be found on pulsed laser
deposition (PLD) as a technique for thin film growth. Here a literature review of
PLD is discussed where other groups are also using it as a technique to study thin
film components for SOFCs.
PLD has been shown to be a suitable method for depositing a wide range of
cathode materials such as lanthanum strontium cobaltite, La1-xSrxCoO(3-δ),27-31
lanthanum cobalt iron oxide, LaxCoyFe1-yO(3-δ),32 and Lax-Sr1-xMnO3 (LSM); 29,30,33,34
electrolytes including yttrium stabilised zirconia (YSZ),35-37 lanthanum
YSZ was the first fuel cell relevant material to be deposited as a thin film by PLD.
Murray et al. deposited YSZ from an oxide target with deposition rates of less than 0.15μmh-1.37 Later work by Kokai and co-workers employed a YSZ target to
prepare well-adhered, fully dense thin films up to 2μm in thickness.35,36
PLD is not generally considered as a manufacturing method for cathodes due to a
lack of scalability for industry however SolMateS,45 based in the Netherlands, is
starting to manufacture PLD systems for industrial clients so this may prove
viable in the near future. Currently more readily scalable methods of thin film
deposition include chemical vapour deposition and sputtering.46 PLD has proven
to be a valuable tool in preparing novel electrode compositions and structures for
use in fundamental reaction mechanism studies.27-34 PLD allows thin, fully dense,
and oriented cathode films to be deposited onto various electrolytes, which
enables the role of mixed electron and oxygen ion conductivity to be assessed.47
Endo and co-workers studied the performance of dense lanthanum manganite
cathodes over a range of thicknesses, temperature, and oxygen partial pressure,
concluding that reaction rates were controlled by oxygen transport through the
dense electrode layers.29,33,34 It would not have been possible to assess this
contribution to the cathodic reaction without the formation of high quality thin
films by PLD. Similar studies with strontium-substituted lanthanum cobaltite and
lanthanum iron cobaltite allowed an assessment of the role of mixed conduction
on electrocatalytic activity to be made.27-32,34 Chen et al. found that the orientation of lanthanum cobaltite films was affected by the oxygen partial pressure in the
et al. studied oxygen isotope surface exchange and bulk migration in PLD-deposited lanthanum cobaltite thin films, and showed that surface processes, such
as adsorption and dissociation dominated electrochemical performance.31
The most recent studies where PLD has been applied to fuel cell materials
involved the deposition of alternative electrolytes and electrodes. Mathews et al. first reported the deposition of a number of lanthanum strontium gallium
magnesium oxide (LSGM), La1-xSrxGa1-yMgyO(3-δ) (0.1 ≤ x ≤ 0.2, 0.1 ≤ y ≤ 0.2),
thin films onto quartz and silicon substrates.39 The lanthanum gallates are of
interest because they have a considerably higher ionic conductivity than YSZ and
good stability in oxidizing and reducing atmospheres.39 The as-deposited films
were amorphous, and converted to single phase orthorhombic or cubic perovskite
structures after annealing at 1500°C.39 Multiple ion and neutral species were
found in the evaporated plume; major species that were detected included O+,
Ga+, O, and Ga. Kanazawa et al. used PLD to deposit dense LSGM films onto porous nickel oxide, and studied plume dynamics as well as film composition and
structure.40 As-deposited films were amorphous in that study as well, but were
fully crystallized by annealing in air at 1000°C. Small differences in composition
were noted between the target and deposit. Deposited films tended to be enhanced
with respect to Sr and depleted with respect to Ga, compared to the target.
Manoravi et al. were able to fully crystallize laser-ablated LSGM at 730°C in air. These authors reported a factor of 10 higher ionic conductivity for LSGM films
1.4 Superlattice Growth
Novel structures comprising layers of different materials can be grown as
superlattices. Superlattices made of strontium titanate, SrTiO3, (STO) and 8mol%
Y2O3 doped ZrO2 (YSZ) layers have been investigated, and have been found to
possess a colossal enhancement of ionic conductivity, which was eight orders of
magnitude larger than the YSZ conductivity, even at room temperature.48
However, these findings were successively questioned because the researchers
omitted to consider the ionic and electronic conductivity contribution from the
much thicker STO substrates they used.49
Sanna et al.50 have investigated the electrochemical properties of superlattices made of alternate layers of 20mol% SDC and 8mol% YSZ, fabricated by pulsed
laser deposition (PLD). Doped ceria films having a fluorite structure can be
deposited on several non-fluorite substrates by PLD, starting from a
polycrystalline target and maintaining the correct stoichiometry.51 In particular,
doped ceria has been shown to grow on {001} LaAlO3 (LAO), {110} NdGaO3
(NGO), and {001} STO perovskite substrates.52,53 Perovskite-type substrates
provide the correct lattice match for ceria, and induce the growth of epitaxial
monocrystalline films with a low degree of structural disorder.52 STO, NGO, and
LAO have a cubic (pseudocubic for NGO) structure with lattice parameter values
ap = 3.91Å (STO), 3.86Å (NGO), and 3.79Å (LAO). On the other hand, the lattice parameter of highly doped SDC, a = 5.44Å, does not allow a cube-on-cube, epitaxial relationship (see Chapter 3, Section 3.5.5) between (001)-oriented
(110) direction for STO is 5.52Å, which gives a good match with the SDC cubic
parameter (1.5%) and even smaller for NGO and LAO, encouraging growth along
this direction.54
1.5 Materials of Interest
1.5.1 Strontium Titanate
Strontium titanate (STO), SrTiO3, is a simple cubic perovskite with no distortions
of the oxygen octahedra. Perovskite materials have the formula ABX3, with the
structure including one 12-coordinate cubo-octahedral site occupied by a large
cation, A, one 6-coordinate octahedral site occupied by a smaller cation, B, and a
6-coordinate site occupied by an anion, X, which is typically oxygen or a
halide.55 The perovskite structure is shown in Figure 1.3. A-site cations are
usually members of group II or lanthanides, e.g. Sr/La, while B-site cations are
typically transition metals, e.g. Ti. Typically cubic perovskites possess lattice
parameters, denoted ap, of approximately 4Å.55 For example, STO has an ap of 3.91Å.56
The structure of STO was verified by Tegze et al. who obtained direct images of the three dimensional arrangement.57 STO is used as a single crystal substrate for
the growth of many films,56 including those in this thesis where (001) STO is used
Figure 1.3: Undistorted perovskite structure ABO3. With the blue atoms showing the A site, the
green atom showing the B site and the oxygen atoms in red.
1.5.2 Electrolyte Material
The electrolyte requires a high ionic conductivity and a negligible electronic conductivity. It also needs to be stable in redox environments. The electrolyte
materials need to be selected with care as it was important to select a material that
would not react with the chosen cathode material when heated to SOFC operating
and fabrication temperatures.
Materials with the fluorite structure, such as samarium doped and gadolinium
doped ceria, are typically used as electrolytes in SOFCs. The fluorite structure
(see Figure 1.4) is represented by the formula AX2, where X is typically oxygen
or a halide. When X is oxygen, A is typically a 4+ cation such as Ce and when X
is a halide, A is usually a 2+ cation e.g. Ca. The A-site cation can be substituted
with a lower charged cation which incurs oxygen deficiencies in the structure to
balance the overall charge. These oxygen vacancies generally improve the overall
oxide ion conductivity and are therefore of great interest for these electrolyte
[image:20.595.248.382.91.212.2]1.5.2.1 Samarium Doped Ceria
Ceria (CeO2) has the standard fluorite structure, and does not possess a high ionic
conductivity. Replacing Ce4+ with Sm3+ introduces oxygen vacancies and the
resultant samarium doped ceria (SDC), Ce(1-x)SmxO(2-δ), possesses a much higher
ionic conductivity.59 Doping ceria with cations that have similar ionic radii to
Ce4+, e.g. Sm3+, produces materials with low activation energies for oxide
diffusion.60 One of the disadvantages of this material is that Ce4+ is easily
reducible creating an electrical component to the conductivity.
Samarium doped ceria (SDC), Sm0.2Ce0.8O2-δ, has the face centred cubic fluorite
structure (see Figure 1.4) and has a lattice parameter of 5.44Å.
Figure 1.4: Schematic of the SDC's fluorite structure, the green spheres represent Ce/Sm and the
red spheres represent oxygen.
Films of SDC grown in this work are discussed in Chapter 3 and 5.
1.5.2.2 Yttria-stabilised Zirconia
Zirconia (ZrO2) only adopts the cubic fluorite structure shown in Figure 1.4 above
2300°C.61 Doping zirconia with yttria stabilises the cubic fluorite structure at
lower charged Y3+ results in oxygen vacancies, as discussed with SDC, thereby
increasing the ionic conductivity.62
One potential issue with using yttria-stabilised zirconia (YSZ) is that it has the
potential to react with cathode materials such as La(1-x)SrxMnO(3-δ) (LSM)
producing unwanted species such as La2Zr2O7 63-67 and SrZrO3 68,69 and resulting
in a loss in performance.
SDC/GDC, on the other hand, has been found to be more chemically stable than
YSZ,70 and has been used as a buffer layer between YSZ and the cathode material
both in the bulk71,72 and as a thin film.73
In this work, YSZ is used as a single crystal (001) substrate procured from
PI-KEM, upon which SDC buffer layers and cathode materials are deposited. Films
grown on YSZ are discussed in Chapter 5.
1.5.3 Cathode Materials
A cathode must have high electronic and ionic conductivity for intermediate temperature SOFCs (IT-SOFCs) operating at 500-700°C. This work focuses on
two cathode materials, neodymium barium cobalt oxide (discussed in Section
1.5.3.1 Neodymium Barium Cobalt Oxide
LnBaCo2O(5+δ) is an A-site layered perovskite which has been extensively
researched in the literature, where Ln = Gd, Pr.74-78 These materials are of interest
because of the A-site cation ordering in the double perovskite (DP), and it has
been found that the oxygen ion diffusivity was greater in the DP than in the
single perovskite (SP) materials. SP GdBaCo2O(5+δ) (GBCO) was found to be
unstable degrading into GdCoO3 and BaCO3 in low concentrations of CO2.
However DP GBCO structure was found to be stable in air conditions for 100
hours at 500-700°C and with < 500ppm of CO2.79 Neodymium barium cobalt
oxide (NBCO), NdBaCo2O(5+δ), has a perovskite based structure and can be found
in multiple forms depending on the degree of cationic/oxygen vacancy order.
NBCO thin films have been previously grown by Grygiel et al. via PLD.80
Completely disordered NBCO is a simple cubic perovskite shown in Figure 1.3
with a random mixture of Nd and Ba on the A-site and Co on the B-site. Any
oxygen vacancies are randomly positioned. A composition of NdBaCo2O(5+δ) can
lead to ordering of oxygen vacancies as shown in Figure 1.5. Here, oxygen
vacancy channels occur in alternating ap rows along the b-direction running parallel to a. Cationic order is driven by this process with Nd positioned in the A-site of the layers containing oxygen vacancies and Ba on the alternate layer
Figure 1.5: Structural depiction of (a) random occupancy of cation site indicated by mixed colour
central atom, the disordered perovskite NdBaCo2O5, (b) the ordered double perovskite
NdBaCo2O5. Nd in purple, Ba in green, Co in blue and O in red.
1.5.3.2 Barium Calcium Yttrium Iron Oxide
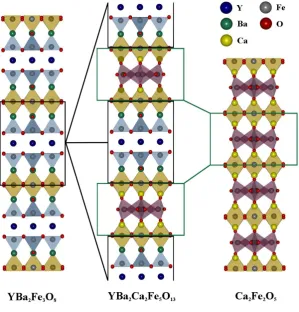
The barium calcium yttrium iron oxide (10 layer), Ba1.7Ca2.4Y0.9Fe5O13, material
can be described as a regular intergrowth between Ca2Fe2O5 81 and
YBa2Fe3O8 82,83 building blocks in a one to one ratio. The 10 layer structure has
similarities to that of LnBaCo2O(5+δ), as discussed in section 1.5.3.1, and possesses
channels of ordered oxygen vacancies forming between square pyramidal sites,
Figure 1.6: Crystal structure showing the intergrowth between Ca2Fe2O5 and YBa2Fe3O8 building
blocks. The iron sites in the purple polyhedra are disordered.
Previously the 10 layer material has been reported in the literature in the bulk
form by Demont et al.84 Sayers et al. report an improved ASR for the bulk 10 layer material having modified the cathode processing technique.85 A related 16 ap phase has also been reported.86 In addition Darren Hodgeman has also conducted
further studies with doping the 10 layer material which is reported in his thesis.87
The publication on thin films of the 10 layer material is based on the work
presented in Chapter 4.88 Films of the 10 layer grown in this work are discussed in
1.6 Thesis Overview
This thesis is concerned with the pulsed laser deposition (PLD) growth of thin
films for use as electrolytes and cathodes in solid oxide fuel cell applications.
Thin film growth of samarium doped ceria (SDC) was initially optimised on a
strontium titanate (STO) {001} substrate. Samarium doped ceria was used as an
electrolyte for solid oxide fuel cells due to its high ionic conductivity.54
Neodymium barium cobalt oxide (NBCO) was grown as a bilayer with the SDC,
as NBCO is a cathode material. SDC and NBCO were also grown in multilayers,
and these SDC and NBCO growths are discussed in Chapter 3.
Barium calcium yttrium iron oxide (10 layer), Ba1.7Ca2.4Y0.9Fe5O13, material was
also grown in thin film form. The 10 layer is a potential cathode material for
SOFCs and was grown as a thin film in an attempt to improve the conductivity.
The 10 layer growths are discussed in Chapter 4, and are later used as the
motivation for the area specific resistance (ASR) measurements discussed in
1.7 References
1 Grove, W. R. LVI. On a new voltaic combination. Philosophical Magazine Series 313, 430-431, doi:10.1080/14786443808649618 (1838).
2 Exarchakos, L., Hawkes, A. D. & Leach, M. A. in The European Union, 25 different countries, 25 different energy policies…? An overview (VGB Powertech, Essen, 2006).
3 Minh, N. Q. Ceramic Fuel Cells. J. Am. Ceram. Soc.76, 563-588 (1993).
4 Aricò, A. S., Bruce, P., Scrosati, B., Tarascon, J.-M. & van Schalkwijk, W. Nanostructured materials for advanced energy conversion and storage devices. Nature Materials4, 366-377, doi:10.1038/nmat1368 (2005).
5 H. Monmouth Smith. The Nernst lamp. Science11, 689-690 (1898).
6 Möbius, H.-H. On the history of solid electrolyte fuel cells. J Solid State Electrochem1, 2-16, doi:10.1007/s100080050018 (1997).
7 Singhal, S. in High-temperature Solid Oxide Fuel Cells: Fundamentals, Design and Applications (Elsevier, Oxford, 2006).
8 Eguchi, K., Setoguchi, T., Inoue, T. & Arai, H. Electrical properties of ceria-based oxides and their application to solid oxide fuel cells. Solid State Ionics52, 165-172 (1992).
9 Mori, T. & Drennan, J. Influence of microstructure on oxide ionic conductivity in doped CeO2 electrolytes. Journal of Electroceramics 17, 749-757, doi:10.1007/s10832-006-6311-7 (2006).
cell. Solid State Ionics36, 71-75, doi:Doi: 10.1016/0167-2738(89)90061-1 (1989).
11 Hooper, J., Ismail, A., Giorgi, J. B. & Woo, T. K. Computational insights into the nature of increased ionic conductivity in concentrated samarium-doped ceria: a genetic algorithm study. Phys. Chem. Chem. Phys. 12, 12969-12972, doi:10.1039/c0cp00863j (2010).
12 Andersson, D. A., Simak, S. I., Skorodumova, N. V., Abrikosov, I. A. & Johansson, B. Optimization of ionic conductivity in doped ceria.
Proceedings of the National Academy of Sciences of the United States of America103, 3518-3521 (2006).
13 Wei, X., Pan, W., Cheng, L. F. & Li, B. Atomistic calculation of association energy in doped ceria. Solid State Ionics 180, 13-17, doi:10.1016/j.ssi.2008.10.019 (2009).
14 Nakayama, M. & Martin, M. First-principles study on defect chemistry and migration of oxide ions in ceria doped with rare-earth cations. Phys. Chem. Chem. Phys.11, 3241-3249 (2009).
15 Steele, B. C. H. Appraisal of Ce1-yGdyO2-y/2 electrolytes for IT-SOFC operation at 500 oC. Solid State Ionics129, 95-110 (2000).
16 Joo, J. H. & Choi, G. M. Electrical conductivity of thin film ceria grown by pulsed laser deposition. Journal of the European Ceramic Society 27, 4273-4277, doi:DOI: 10.1016/j.jeurceramsoc.2007.02.135 (2007).
17 all e, , ingued , , assir, , utkonen, Niinist , L. Synthesis of a Thin-Layered Ionic Conductor, CeO2−Y2O3, by Atomic Layer Deposition in View of Solid Oxide Fuel Cell Applications.
18 Jung, W. & Tuller, H. L. Investigation of Cathode Behavior of Model Thin-Film SrTi1−x FexO3−δ (x = 0 35 and 0 5) ixed Ionic-Electronic Conducting Electrodes. J. Electrochem. Soc. 155, B1194-B1201, doi:10.1149/1.2976212 (2008).
19 Jung, W. & Tuller, H. L. Impedance study of SrTi1−xFexO3−δ (x=0.05 to 0.80) mixed ionic-electronic conducting model cathode. Solid State Ionics 180, 843-847, doi:http://dx.doi.org/10.1016/j.ssi.2009.02.008 (2009).
20 Jiang, S. & Chan, S. A review of anode materials development in solid oxide fuel cells. J Mater Sci 39, 4405-4439, doi:10.1023/B:JMSC.0000034135.52164.6b (2004).
21 Nikbin, D. Micro SOFCs: why small is beautiful. Fuel Cell Rev., 21-24 (2006).
22 Pomfret, M. B. et al. Hydrocarbon Fuels in Solid Oxide Fuel ells: In Situ Raman Studies of Graphite Formation and Oxidation. The Journal of Physical Chemistry C112, 5232-5240, doi:10.1021/jp711312p (2008).
23 La, G. J., Hertz, J., Tuller, H. & Shao-Horn, Y. Microstructural. features of RF-sputtered SOFC anode and electrolyte materials. Journal of Electroceramics13, 691-695 (2004).
24 Hertz, J. L. & Tuller, H. L. Electrochemical characterization of thin films for a micro-solid oxide fuel cell. Journal of Electroceramics 13, 663-668 (2004).
25 Baertsch, C. D. et al. Fabrication and structural characterization of self-supporting electrolyte membranes for a micro solid-oxide fuel cell.
26 Heiroth, S. Pulsed laser deposition of functional electroceramic thin films for micro solid oxide fuel cell applications, ETH ZURICH, (2010).
27 Chen, X., Wu, N. J., Ignatiev, A., Zhang, Z. H. & Chu, W. K. Structure and conducting properties of La0.5Sr0.5CoO3-delta films on YSZ. Thin Solid Films350, 130-137 (1999).
28 Chen, X., Wu, N. J., Ritums, D. L. & Ignatiev, A. Pulsed laser deposition of conducting porous La-Sr-Co-O films. Thin Solid Films 342, 61-66 (1999).
29 Endo, A., Fukunaga, H., Wen, C. & Yamada, K. Cathodic reaction mechanism of dense La0.6Sr0.4CoO3 and La0.81Sr0.09MnO3 electrodes for solid oxide fuel cells. Solid State Ionics 135, 353-358, doi:Doi: 10.1016/s0167-2738(00)00466-5 (2000).
30 Imanishi, N. et al. Impedance spectroscopy of perovskite air electrodes for SOFC prepared by laser ablation method. Solid State Ionics 174, 245-252, doi:DOI: 10.1016/j.ssi.2004.06.019 (2004).
31 Kawada, T. et al. Oxygen isotope exchange with a dense La0.6Sr0.4CoO 3-[delta] electrode on a Ce0.9Ca0.1O1.9 electrolyte. Solid State Ionics 121, 271-279, doi:Doi: 10.1016/s0167-2738(99)00046-6 (1999).
32 Coocia, L. G. et al. Pulsed laser deposition of novel materials for thin film solid oxide fuel cell applications: Ce0.9Gd0.1O1.95, La0.7Sr0.3CoOy and La0.7Sr0.3Co0.2Fe0.8Oy. Applied Surface Science 96-98, 795-801, doi:Doi: 10.1016/0169-4332(96)00000-1 (1996).
34 Endo, A., Wada, S., Wen, C.-J., Komiyama, H. & Yamada, K. Low Overvoltage Mechanism of High Ionic Conducting Cathode for Solid Oxide Fuel Cell. J. Electrochem. Soc. 145, L35-L37, doi:10.1149/1.1838332 (1998).
35 Kokai, F., Amano, K., Ota, H., Ochiai, Y. & Umemura, F. XeCl laser ablative deposition and characterization of yttria-stabilized zirconia thin films on glass and CeO2-Sm2O3. J. Appl. Phys.72, 699-704 (1992).
36 Kokai, F., Amano, K., Ota, H. & Umemura, F. XeCl laser ablation of yttria stabilized zirconia. Applied Physics a-Materials Science & Processing54, 340-342 (1992).
37 Murray, P. T., Wolf, J. D., Mescher, J. A., Grant, J. T. & McDevitt, N. T. Growth of yttria-stabilized cubic zirconia films on GaAs (100) by pulsed laser evaporation. Materials Letters5, 250-254 (1987).
38 Manoravi, P., Sivakumar, N., Joseph, M. & Mathews, T. Laser ablation of La0.9Sr0.1Ga0.8Mg0.2O2.85 - Plume and film characterization. Ionics 10, 32-38 (2004).
39 Mathews, T., Manoravi, P., Antony, M. P., Sellar, J. R. & Muddle, B. C. Fabrication of La1-xSrxGa1-yMgyO3-(x plus y)/2 thin films by pulsed laser ablation. Solid State Ionics135, 397-402 (2000).
40 Kanazawa, S. et al. Preparation of doped LaGaO3 films by pulsed laser deposition. Surface & Coatings Technology169, 508-511 (2003).
42 Kajimura, A. et al. Preparation of La(Sr)CrO3-delta thin-film interconnector by high deposition rate laser-ablation method. Solid State Ionics 82, 107-111 (1995).
43 Kajimura, A. et al. Preparation of La1-xSrxCrO3-delta film by laser ablation method. Solid State Ionics76, 41-46 (1995).
44 Suzuki, M., Sasaki, H. & Kajimura, A. Oxide ionic conductivity of doped lanthanum chromite thin film interconnectors. Solid State Ionics96, 83-88 (1997).
45 SolMateS Solutions in Material Science. (http://www.solmates.nl).
46 Baxamusa, S. H., Im, S. G. & Gleason, K. K. Initiated and oxidative chemical vapor deposition: a scalable method for conformal and functional polymer films on real substrates. Phys. Chem. Chem. Phys.11, 5227-5240, doi:10.1039/b900455f (2009).
47 Eason, R. in Pulsed Laser Deposition of Thin Films (Wiley and Sons, 2007).
48 Garcia-Barriocanal, J. et al. Colossal Ionic Conductivity at Interfaces of Epitaxial ZrO2:Y2O3/SrTiO3 Heterostructures. Science 321, 676-680, doi:10.1126/science.1156393 (2008).
49 Guo, X. Comment on "Colossal Ionic Conductivity at Interfaces of Epitaxial ZrO2:Y2O3/SrTiO3 Heterostructures". Science 324, doi:10.1126/science.1168940 (2009).
51 Infortuna, A., Harvey, A. S. & Gauckler, L. J. Microstructures of CGO and YSZ thin films by pulsed laser deposition. Advanced Functional Materials18, 127-135, doi:10.1002/adfm.200700136 (2008).
52 Huang, D. X., Chen, C. L. & Jacobson, A. J. Interface structures and periodic film distortions induced by substrate-surface steps in Gd-doped ceria thin-film growth. J. Appl. Phys.97, doi:10.1063/1.1845576 (2005).
53 Chen, L. et al. High temperature electrical conductivity of epitaxial Gd-doped CeO2 thin films. Solid State Ionics 175, 103-106, doi:10.1016/j.ssi.2004.09.034 (2004).
54 Sanna, S. et al. Fabrication and Electrochemical Properties of Epitaxial Samarium-Doped Ceria Films on SrTiO3-Buffered MgO Substrates. Advanced Functional Materials 19, 1713-1719, doi:10.1002/adfm.200801768 (2009).
55 Mitchell, R. H. Perovskites, Modern and Ancient. (Almaz Press, 2002).
56 Wan, X. J., Wang, L., Su, X. Q., Chen, J. B. & Kong, L. in 5th International Symposium on Advanced Optical Manufacturing and Testing Technologies: Optoelectronic Materials and Devices for Detector, Imager, Display, and Energy Conversion Technology Vol. 7658 Proceedings of SPIE-The International Society for Optical Engineering (eds Y. Jiang, B. Kippelen, & J. Yu) (Spie-Int Soc Optical Engineering, 2010).
57 Tegze, M. & Faigel, G. X-ray holography with atomic resolution. Nature 380, 49-51 (1996).
59 Inaba, H. & Tagawa, H. Ceria-based solid electrolytes. Solid State Ionics 83, 1-16, doi:http://dx.doi.org/10.1016/0167-2738(95)00229-4 (1996).
60 Fergus J.W., Hui R., Li X., Wilkinson D.P. & J., Z. in Solid Oxide Fuel Cells - Material Properties and Performance (CRC Press, Boca Raton, 2009).
61 Scott, H. G. Phase relationships in the zirconia-yttria system. J Mater Sci 10, 1527-1535, doi:10.1007/bf01031853 (1975).
62 Fergus, J. W. Electrolytes for solid oxide fuel cells. Journal of Power Sources 162, 30-40, doi:http://dx.doi.org/10.1016/j.jpowsour.2006.06.062 (2006).
63 Kuščer, D et al. Interactions between a thick film LaMnO3 cathode and YSZ SOFC electrolyte during high temperature ageing. Solid State Ionics 78, 79-85, doi:http://dx.doi.org/10.1016/0167-2738(95)00010-4 (1995).
64 Ji, Y., Kilner, J. A. & Carolan, M. F. Electrical properties and oxygen diffusion in yttria-stabilised zirconia (YSZ)–La0.8Sr0.2MnO3±δ (LSM) composites. Solid State Ionics 176, 937-943, doi:http://dx.doi.org/10.1016/j.ssi.2004.11.019 (2005).
65 Clausen, C., Bagger, C., Bilde-Sørensen, J. B. & Horsewell, A. Microstructural and microchemical characterization of the interface between La0.85Sr0.15MnO3 and Y2O3-stabilized ZrO2. Solid State Ionics70– 71, Part 1, 59-64, doi:http://dx.doi.org/10.1016/0167-2738(94)90287-9 (1994).
67 Brugnoni, C., Ducati, U. & Scagliotti, M. SOFC cathode/electrolyte interface. Part I: Reactivity between La0.85Sr0.15MnO3 and ZrO2-Y2O3. Solid State Ionics 76, 177-182, doi:http://dx.doi.org/10.1016/0167-2738(94)00299-8 (1995).
68 Tu, H. Y. et al. Chemical compatibility of RE0.6M0.4Mn0.8Co0.2O3-δ (RE=La, Pr, Nd, Sm and Gd; M=Sr and Ca) with yttria stabilized zirconia.
Journal of the European Ceramic Society 20, 2421-2425, doi:http://dx.doi.org/10.1016/S0955-2219(00)00126-6 (2000).
69 Stochniol, G., Syskakis, E. & Naoumidis, A. Chemical Compatibility between Strontium-Doped Lanthanum Manganite and Yttria-Stabilized Zirconia. J. Am. Ceram. Soc. 78, 929-932, doi:10.1111/j.1151-2916.1995.tb08416.x (1995).
70 Waller, D., Lane, J. A., Kilner, J. A. & Steele, B. C. H. The effect of thermal treatment on the resistance of LSCF electrodes on gadolinia doped ceria electrolytes. Solid State Ionics 86–88, Part 2, 767-772, doi:http://dx.doi.org/10.1016/0167-2738(96)00362-1 (1996).
71 Martínez-Amesti, A. et al. Reactivity between La(Sr)FeO3 cathode, doped CeO2 interlayer and yttria-stabilized zirconia electrolyte for solid oxide fuel cell applications. Journal of Power Sources 185, 401-410, doi:http://dx.doi.org/10.1016/j.jpowsour.2008.06.049 (2008).
72 Tsoga, A., Gupta, A., Naoumidis, A. & Nikolopoulos, P. Gadolinia-doped ceria and yttria stabilized zirconia interfaces: regarding their application for SOFC technology. Acta Materialia 48, 4709-4714, doi:http://dx.doi.org/10.1016/S1359-6454(00)00261-5 (2000).
of Hydrogen Energy 38, 2407-2412, doi:http://dx.doi.org/10.1016/j.ijhydene.2012.11.112 (2013).
74 Taskin, A. A., Lavrov, A. N. & Ando, Y. Achieving fast oxygen diffusion in perovskites by cation ordering. Applied Physics Letters 86, -, doi:doi:http://dx.doi.org/10.1063/1.1864244 (2005).
75 Taskin, A. A., Lavrov, A. N. & Ando, Y. Transport and magnetic properties of GdBaCo2O5 single crystals: A cobalt oxide with square-lattice CoO2 planes over a wide range of electron and hole doping. Physical Review B71, 134414 (2005).
76 Burriel, M. et al. Anisotropic Oxygen Ion Diffusion in Layered PrBaCo2O5+δ. Chemistry of Materials 24, 613-621, doi:10.1021/cm203502s (2012).
77 Tarancon, A., Burriel, M., Santiso, J., Skinner, S. J. & Kilner, J. A. Advances in layered oxide cathodes for intermediate temperature solid oxide fuel cells. Journal of Materials Chemistry 20, 3799-3813, doi:10.1039/b922430k (2010).
78 Parfitt, D., Chroneos, A., Tarancon, A. & Kilner, J. A. Oxygen ion diffusion in cation ordered/disordered GdBaCo2O5+[delta]. Journal of Materials Chemistry21, 2183-2186, doi:10.1039/c0jm02924f (2011).
79 Tarancón, A., Marrero-López, D., Peña-Martínez, J., Ruiz-Morales, J. C. & Núñez, P. Effect of phase transition on high-temperature electrical properties of GdBaCo2O5+delta layered perovskite. Solid State Ionics 179, 611-618, doi:http://dx.doi.org/10.1016/j.ssi.2008.04.028 (2008).
81 Bertaut, E. F., Blum, P. & Sagnieres, A. Structure du ferrite bicalcique et de la brownmillerite. Acta Crystallographica 12, 149-159, doi:doi:10.1107/S0365110X59000433 (1959).
82 Huang, Q. et al. Neutron-powder-diffraction study of the nuclear and magnetic structures of YBa2Fe3O8 at room temperature. Physical Review B 45, 9611-9619 (1992).
83 Karen, P., Suard, E. & Fauth, F. Crystal Structure of Stoichiometric YBa2Fe3O8. Inorganic Chemistry 44, 8170-8172, doi:10.1021/ic048746b (2005).
84 Demont, A. et al. Stabilization of a Complex Perovskite Superstructure under Ambient Conditions: Influence of Cation Composition and Ordering, and Evaluation as an SOFC Cathode. Chemistry of Materials22, 6598-6615, doi:10.1021/cm102475n (2010).
85 Sayers, R. et al. Internal Activation Strain and Oxygen Mobility in a Thermally Stable Layered Fe3+ Oxide. Chemistry of Materials 25, 3441-3457, doi:10.1021/cm4013359 (2013).
86 Dyer, M. S. et al. Computationally Assisted Identification of Functional Inorganic Materials. Science 340, 847-852, doi:10.1126/science.1226558 (2013).
87 Hodgeman, D. W. New cathodes for intermediate temperature solid oxide fuel cells (IT-SOFCs). PhD thesis, University of Liverpool, (2014).
Chapter 2: Methodology
2.1 Film Growth Techniques
Typically, deposition techniques fall into two broad categories, chemical vapour
deposition (CVD) or physical vapour deposition (PVD). If material is deposited
from the product of a chemical reaction then the process is classified as CVD.
Alternatively, if a vapour is created via physical means with no chemical reaction
then it is classified as PVD. Several variations of these techniques have been
implemented to balance the various advantages and disadvantages depending on
the requirements for film purity, structural quality, growth rate and temperature
constraints. Examples of CVD techniques include atomic layer deposition (ALD),
which is able to be used at low temperatures using gaseous precursors, and
metal-organic molecular beam epitaxy (MOMBE), which is described as a hybrid of
metal-organic chemical vapor deposition (MOCVD) and molecular beam epitaxy
(MBE) that exploits the advantages of both the techniques. PVD techniques
include sputtering, which is a low temperature technique involving the
bombardment of a target with Ar+ ions, and pulsed laser deposition (PLD), which
uses a laser to vaporise the surface of a target material producing a plasma.1
2.1.1 Pulsed Laser Deposition 2.1.1.1History of PLD
PLD has been used for evaporative film growth for over 40 years, practically
since the discovery of lasers themselves.2,3 In the 1980s PLD became more
success in epitaxial high temperature superconducting films.4 Further laser
developments occurring in the 1990s, such as development of lasers with shorter
pulse durations and higher frequencies, enabling the use of PLD for the growth of
thin films with complex stoichiometry.
2.1.1.2 PLD Growth Mechanism
Pulsed laser deposition is a vacuum deposition technique which uses a high
powered (0.1 - 10Jcm-2)5 laser to vaporise (or ablate) material from a target to
create a plasma plume. This plume then condenses onto a heated substrate,
forming a film.5-7 The thin film formation process takes place in the following
stages:
1. Laser radiation interaction with the target (vaporisation and ionisation)
Initially the laser beam is focused onto the surface of the target, via a series of
optical components. All elements in the target surface are rapidly heated up to
their evaporation temperature. This leads to dissociation of materials from the
target, which are then ablated with the stoichiometry of the target. Typically bulk
ceramic targets are used for PLD, however single crystals can also be used,
providing the material is not a wide bandgap insulator such as Al2O3 which would
have insufficient optical absorption.5
2. Plasma expansion of the ionised species
During the second stage the emitted materials from the target move towards the
substrate. Various factors such as the substrate temperature and the laser spot size
the plume can be affected by the partial pressure of oxygen. To achieve thicker
films at higher oxygen pressures a smaller target-to-substrate distance is desirable
to increase the deposition rate.
3. Deposition of the adatoms
The third stage is important to determine the quality of thin film. It is possible that
the ejected high-energy species (up to 120eV)8 may affect the substrate surface
potentially causing damage to the substrate.9 Energetic species can sputter some
of the surface atoms and between the incident flow and the sputtered atoms a
collision region becomes established. A film grows immediately upon formation
of this collision region and the region serves as a source for the condensation of
particles. When the condensation rate is higher than the rate of particles supplied
by the sputtering, thermal equilibrium condition can be reached quickly and film
grows on the substrate surface at the expense of the direct flow of the ablation
particles.
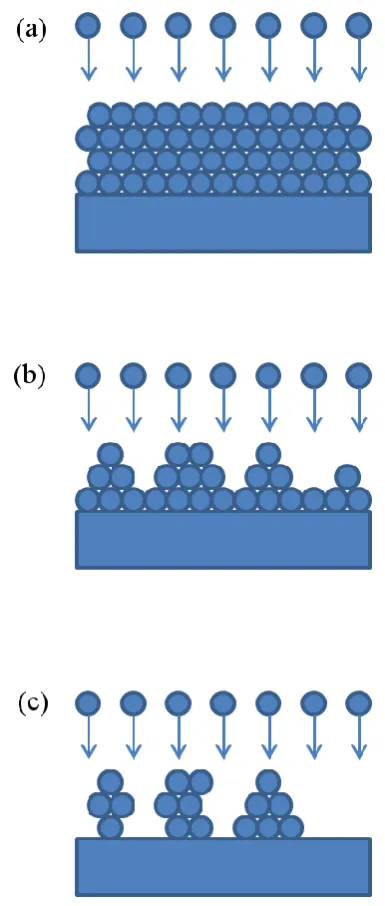
4. Nucleation and thin film growth
The fourth stage is the growth mode of the thin film. The growth mode affects the
microstructure of the film. There are three types of growth modes as seen in
Figure 2.1:
1. 2D layer by layer (Frank-van der Merwe)
2. 3D island (Volmer-Weber)
Figure 2.1: Schematic of growth modes (a) 2D layer by layer (Frank-van der Merwe), (b) Layer
by layer superseded by 3D growth (Stranski-Krastanov), (c) 3D island (Volmer-Weber).11
In Frank van der Merwe growth (Figure 2.1 (a)), adatoms attach preferentially to
step edges of growing islands over nucleation of new islands on top resulting in
atomically smooth, fully formed layers. This layer-by-layer growth is two
dimensional, so complete layers form prior to nucleation of subsequent layers. In
stronger than those between the surface and the adatoms, leading to the formation
of three-dimensional adatom clusters or islands. Growth of these clusters will
cause rough multi-layer films to grow on the substrate surface. Finally,
Stranski-Krastanov (Figure 2.1 (b)) growth is an intermediate process characterized by
both 2D layer and 3D island growth. Transition from the layer-by-layer to
island-based growth occurs at a critical layer thickness which is highly dependent on the
chemical and physical properties, such as surface and strain energies.7,10
The growth mode affects whether the film is granular or a single crystal as well as
determining the strain in the structure. The film’s structural morphology is
determined by the growth mode altering defect density and type, as well as
controlling the quality of the interfaces between layers. Surface mobility,
deposition rate, interface compatibility and lattice mismatch all can affect the
growth mode.
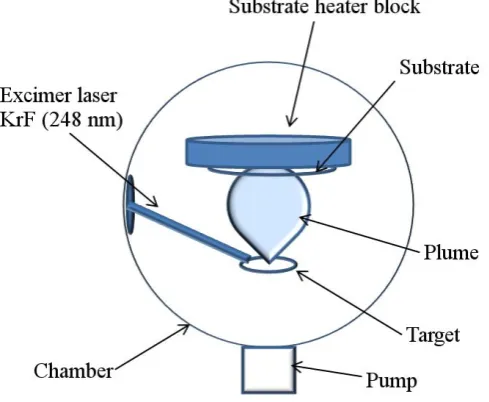
2.1.1.3PLD Setup
In this work a Nano PVD chamber was used for thin film deposition via PLD. An
excimer laser typically uses a mixture of a noble and a reactive gas such as a
halide and has a typical pulse width of 10-70ns. For this work a KrF excimer laser
with a wavelength of 248nm from Coherent was used.
Figure 2.2: Schematic of a PLD chamber.
In PLD, the growth of the thin films is strongly affected by the size and shape of the plasma plume. The plasma plume’s shape and size is dependent on the partial
pressure of oxygen, the laser energy, the spot size and the angular distribution of
the kinetic energy of the ablated particles (which in turn is dependent on the
aforementioned parameters).10 The plume shape was observed for each
deposition, and any noticeable changes in the plume resulted in re-cleaning and
re-aligning the laser optics.
One of the main advantages of PLD over other deposition techniques is the ability
to deposit stoichiometric films. It is possible to deposit complex multi-cation
films from targets with the correct cation ratios, however phase purity of the target
is not essential.5 In this work dense ceramic targets were used, as in Section 2.1
The optimised growth conditions for the thin films grown in this work are
summarised in Table 2.2.
Table 2.2: Summary of material growth conditions.
Growth conditions
Sm0.2Ce0.8O2 (SDC)
NdBaCo2O5 (NBCO)
Ba1.7Ca2.4Y0.9Fe5O13 (10 layer) Substrate
Temperature (°C)
600-850 850 850
Growth pressure
(mTorr) 1 1 1
Laser energy
(mJ) 195 195 300
Frequency (Hz) 4-5 4-5 5
2.2 Target Preparation
Ceramic targets were produced via a conventional solid state reaction for use as
targets for pulsed laser deposition (PLD). The precursors were dried for 2 hours at
200°C, except for lanthanide-containing compounds which were dried at 950°C
due to their highly hygroscopic nature. The starting materials were then ground
together in a pestle and mortar to give a homogeneous powder with uniform small
particle size before being pressed into a pellet using a pellet die. The formation of
pellets increases the contact between crystallite faces decreasing the reaction
timescale.12 The pellet was then calcined, before being re-ground and sintered
under conditions reported in Table 2.1, in an air atmosphere. After each heating
step the phase of the pellet was examined by X-ray diffraction. Once a phase pure
before being isostatically pressed using Autoclave Engineers cold isostatic press
(CIP) at 200MPa. This pressed pellet was then returned to the furnace for
sintering under conditions reported in Table 2.1.
A Sartorius extend balance ED124S with density determination kit YDP01LP
was used to perform density measurements on the targets using Archimedes's
principle. Initially, the mass of the sample is measured (m1) following which the
sample is immersed in water and its mass measured again (m2). The surface of the
sample is then carefully dried with a non-absorbent material before its mass is
measured a final time (m3). The density of the sample can then be calculated
using the following equation:
Eqn. (2.1)
is the density of water, 0.997gcm-3 at 25°C. This measured value of the
density is then divided by the theoretical density of the sample to provide a value
of the percentage of theoretical density for the pellet.
The density of the targets is important for PLD as the density of the target affects
the surface morphology of the films grown. Kim et al. found that using higher density TiO2 targets resulted in a smoother film with fewer particulates.13 In
addition to this Willmott et al. discuss problems associated with target surface morphology resulting in the formation of droplets on the film surface.14 To
using silicon carbide paper (203mm P1200 from Agar Scientific) and each target
was pre-ablated in the chamber prior to film growth after it had been polished.
Pre-ablation is critical to maintain the homogeneity of the target stoichiometry, as
during the ablation process favourable ion segregation to the surface is likely to
occur.7 In this work when the targets were pre-ablated they were subjected to
5000 pulses at 195mJ and 5Hz to expose fresh material and attain a steady state
composition at the target surface.
In each of the results chapters the precise conditions for each target material used
[image:46.595.118.503.408.756.2]in this work is discussed, and a summary is shown in Table 2.1.
Table 2.1: Summary of the target preparation conditions.
Target material
Sm0.2Ce0.8O2 (SDC)
NdBaCo2O5 (NBCO)
Ba1.7Ca2.4Y0.9Fe5O13 (10 layer)
Starting materials
Commercially available SDC
powder (from fuel cell materials
(FCM)
Dried Nd2O3, BaCO3 and Co3O4
from Sigma-Aldrich
Dried Y2O3, BaCO3, CaCO3, Fe2O3 from
Alfa Aesar
Sintering Conditions
1400°C for 10 hours
1000°C for 12 hours, re-ground
and second sintering at 1000°C
for 12 hours, and finally at 1100°C
for 24 hours
1200°C for 12 hours, with cycles of
re-grinding and firing until phase purity was achieved
Percentage theoretical
density
The Ba1.7Ca2.4Y0.9Fe5O13 target used for the growths in Chapter 4 and 5 was
synthesised by Dr. Ruth Sayers, University of Liverpool, using conditions
described in the Demont et al.15 publication, and listed in Table 2.1.
2.2.1 Substrate Considerations
It is important to consider the lattice mismatch between the film and the substrate
when choosing which substrate to grow the film on (Figure 2.3). Materials with
well matched lattice parameters are more likely to grow epitaxially,10 and the
presence of strain may force the film into metastable structures and affect the
morphology.10 When a film with a different lattice parameter to the substrate is
grown, the initial layer(s) may suppress the internal defects and form a flat
surface. However the increase in strain energy that results with increasing film
thickness will eventually result in the introduction of strain relief mechanisms.
Such methods of relieving stress include, for example, dewetting, or the formation
of defects such as dislocations16,17 in the film, by island formation or by the
Figure 2.3: A heteroepitaxial thin-film structure. The mismatch between the lattice parameters of
the film (af) and substrate (as) is accommodated by an elastic strain (m) in the film. Adapted
from.19
The substrates were cleaned prior to thin film deposition in acetone ≥99.8%
(Sigma-Aldrich) for 15 mins in an Agar Scientific ultrasonic cleaning bath,
Sonomatic® T80 and subsequently sonicated in ethanol ≥99.5% (Sigma-Aldrich)
for 15 mins. The substrates were dried with BOC CP grade nitrogen gas to ensure
no residue from the solvents dried onto the substrate surface. The substrates were
adhered onto the sample holder with silver DAG from Agar Scientific, before
being loaded into the PLD chamber.
2.3 Crystal Structure
The unit cell of a crystal is the basic repeating unit which can be used to build the
whole crystal lattice. The unit cells are classified into 7 crystal systems based on
the symmetry the systems exhibit under rotations about different axes. A lattice
can be described by defining a unit cell with edges a, b and c and angles α, β and γ,
and the seven crystal systems and their corresponding essential symmetries are
Table 2.3: Summary of the seven crystal systems and their associated essential symmetries.
System Essential symmetries Cell edge Cell angle
Triclinic None a ≠ b ≠ c α ≠ β ≠ γ ≠ 90°
Monoclinic One twofold axis a ≠ b ≠ c α = γ = 90°, β ≠ 90°
Orthorhombic Three perpendicular twofold axes
a ≠ b ≠ c α = β = γ = 90°
Rhombohedral One threefold axis a = b = c α = β = γ ≠ 90°
Tetragonal One fourfold axis a = b ≠ c α = β = γ = 90°
Hexagonal One sixfold axis a = b ≠ c α = β = 90°, γ = 120°
Cubic Four threefold axes in a tetrahedral arrangement
a = b = c α = β = γ = 90°
Combining these seven systems with lattice centerings (primitive, body centred,
face centred, and base) generate 14 types of unit cell Bravais lattices.20
2.3.1 Miller Indices
The Miller indices are used as a labeling mechanism to effectively describe the
Figure 2.4: hkl Miller indices. Shaded planes are those represented by their respective Miller indices below.
The Miller indices are also used for calculating the plane separation as shown in
Table 2.4.
Table 2.4: The relationship between the Miller indices and the lattice separation.
Crystal system dhkl, lattice parameters and Miller indices
Cubic
Tetragonal
Orthorhombic
Table 2.4 gives formulae that can be used to calculate the lattice parameters from
the d-spacing and the h, k, l values for cubic, tetragonal and orthorhombic structures. Different equations are used, depending on the structure of the crystal
system of interest.20 Throughout this work the films have been grown on (001)