Using a moving load to simultaneously
detect location and severity of damage in
a simply supported beam
Mohsen Mousavi , Damien Holloway
and J C Olivier
Abstract
This paper demonstrates the feasibility of simultaneously identifying both the location and severity of structural damage in a beam by using two independent moving load experiments. First, a simple but sufficiently accurate single degree of freedom model is presented to simulate the structure efficiently over a wide range of relevant inputs. We then introduce a damage sensitive feature (DSF) based on the integral of the velocity time history of the beam at its midspan when the load moves over the beam. A critical velocity, a function only of the beam’s first natural frequency and length, is obtained for the proposed DSF, upon which the damage can be located more accurately. The only required data for the damage detection is the midspan velocity-time history of the cracked beam subjected to a moving load, and the midspan static deflection of the intact beam subjected to a load of the same magnitude. In the last section of this paper, the capability of the proposed DSF is examined in the presence of noise. The results demonstrate the capability of the proposed method to find both the damage location and severity successfully, and methods for further reducing the effects of noise are suggested.
Keywords
Open crack, moving load, vibration, damage detection, structural health monitoring, damage sensitive feature
1. Introduction
The advantages of the moving load-based damage detection methods have been mentioned by several researchers (Li and Zhao, 2006; Link and Weiland, 2009; He et al., 2017)—the key ones are:
1. the devised procedures are usually close to the operational condition of a bridge structure hence a real experiment is very easily conducted; 2. as the structure can be excited to vibrate with a
moderately large amplitude, a high signal-to-noise ratio is achievable; and
3. more often than not the number of sensors required is fewer than in other structural health monitoring techniques.
Solutions to the problem of finding damage on a beam subjected to a moving load can be categorized according to the type of the applied method (finite element (FE) based method or nonFE based methods), the type of crack (open or breathing), and the feature being detected (severity or location of the crack).
Recent nonFE based damage detection using a moving load can generally fall into two main cate-gories: wavelet transform (WT), and Hilbert–Huang transform (HHT) based techniques (He et al., 2017). The main characteristics of these methods is that they attempt to detect a peak in the transformed vibration time history of the structure.
Zhu and Law (2006) introduced a WT based damage detection method that analyses the deflection-time his-tory of the bridge subjected to a moving load. Accordingly, any crack damage will induce an abrupt change in the spatial variation of the WT of the struc-tural response. In another study, Pakrashi et al. (2010) successfully related the WT phase space of the
College of Sciences and Engineering, University of Tasmania, Hobart, Tasmania, Australia
Corresponding author:
Damien Holloway, College of Sciences and Engineering, University of Tasmania, Hobart, Tasmania 7005, Australia.
Email: [email protected]
Received: 18 October 2018; accepted: 17 April 2019
Journal of Vibration and Control 0(0) 1–16
!The Author(s) 2019
structural response obtained from strain gauges to the presence of cracks in the structure. They also investi-gated how noise and vehicle configuration affect the proposed method.
He and Zhu (2016) state that the dynamic response of a beam with an open crack subject to a moving load is a superposition of the time varying frequency com-ponent due to the moving load and the natural-frequency component of the beam. Hence, they exploited a multi-scale discrete WT to separate the time varying frequency component from the total dynamic response to locate the damage on a simply supported beam (SSB) subjected to a moving load.
The HHT based techniques have also been used by several researchers in this context. The HHT employs a procedure called empirical mode decomposition (EMD) to find the changing modal frequencies over time of a nonstationary signal. EMD decomposes the signal by recursively subtracting intrinsic mode func-tions (IMFs) that are constructed by fitting splines to the peaks and troughs and averaging them. The result-ing IMFs are generally smooth locally sine-like func-tions with gradually varying amplitude and frequency, and it is possible to define an instantaneous frequency by differentiating the phase of the analytic representa-tion of the IMFs. Roveri and Carcaterra (2012) intro-duced a novel method that applies the instantaneous frequency of the first IMF of the structural force response to locate an open crack along the beam span. Although the proposed method is not model-based and is relatively insensitive to noise, it cannot determine the severity of the damage. In another study, Meredith et al. (2012) introduced a two-stage strategy based on moving average and the EMD to construct a damage feature from the acceleration response of the bridge subjected to a moving load. First, the moving average is applied to the acceleration response of the structure to improve its sensitivity towards damage, and then the EMD is used.
NonFE based methods typically use a simplified model (e.g., single degree of freedom (SDOF)) of the beam in order to perform the many simulations neces-sary to study the proposed damage detection method. In contrast, FE based methods offer a first-principles approach to determining the structure’s response to sti-muli, but often at significant additional computational cost, hence they are more used for the direct than the inverse problem.
Recently, He et al. (2017) introduced a model-based damage detection technique that used the FE method to calculate and compare the quasi-static moving-load induced displacement response of the undamaged and damaged structures. They also used discrete WT for denoising the signal. To investigate the damage in the structure, they introduced a two-stage damage
detection procedure based on the change in the area of the region encircled by the displacement influ-ence line.
Nguyen (2013) introduced a wavelet-based strategy for the detection of open and breathing cracks in a vehicle–bridge system subjected to a moving vehicle. He shows that, based on simulations, the amplitude of vibration of the structure is smaller when the crack breathes, but that the peaks in WTs are larger in the case of having a breathing crack compared to an open crack. However, overall, his proposed method is more robust with respect to noise for detection of a breathing crack.
The sudden stiffness reduction in the structural response has been addressed in the literature. Aied et al. (2016) studied the acceleration response of a bridge model subjected to a moving load using ensem-ble empirical mode decomposition (EEMD) for a sudden stiffness change due to damage. The advantage of EEMD is its ability to separate high frequency com-ponents related to the sudden stiffness reduction from other frequency components associated with the inter-action between the vehicle and bridge. Other techniques such as genetic algorithm have also been used for the damage detection in a bridge subjected to a moving vehicle (Li and Au, 2014).
Although most of the above studies are capable of pinpointing the location of the damage, it is still an unresolved issue to propose a damage index that reli-ably quantifies the severity of damage at the same time (He et al., 2017). Moreover, the lack of a decent SDOF model for vibration analysis of cracked beams has been noted by authors despite some existing methods for vibration analysis of an SSB with a breathing crack (Bakhtiari-Nejad and Mirzabeigy, 2013). Hence, in this paper, we first propose a simple SDOF model for vibration analysis of a cracked beam. Then, a novel method that can find both the location and severity of a crack in an SSB (bridge model) subjected to a moving load is proposed. The technique can also be applied to monitor growth of the crack through time. It can be used alongside other techniques that are cap-able of raising an early alarm as soon as a crack occurs but are not able to find the position or severity of it.
2. Direct problem definition and
solution
2.1. Governing equations
cross-section of height h and width w, hence flexural rigidity EI¼Ewh3=12. An open crack exists at a
dis-tanceL0from the left end of the beam. A crack severity
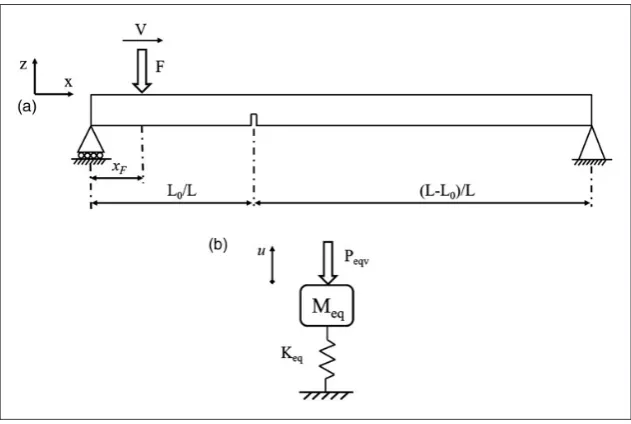
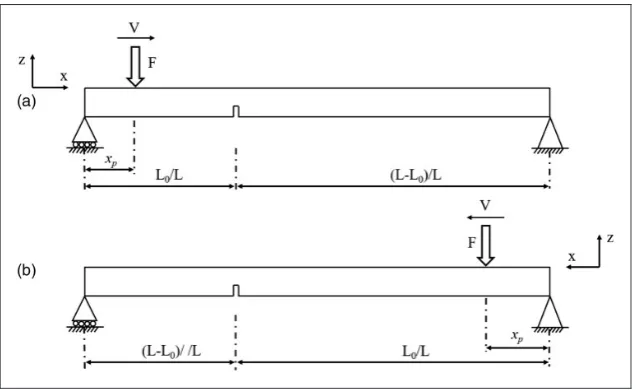
parameteris defined asa/h, whereais the depth of the crack. We seek the response at the midspan of the beam due to a load F moving with velocity V. It is noted that any other form of damage that produces a loca-lized stiffness reduction can be modeled as an equiva-lent crack.
The beam in question is a continuous system with infinitely many degrees of freedom. However, in order to implement an equivalent SDOF model of the cracked beam (Figure 1 (b)) we require the equivalent mass,Meq, equivalent stiffness,Keq, and an equivalent
force,Peq, for the first mode vibration, as indicated in
Figure 1 (b). In doing so it is assumed that only one crack exists on the beam, that during the period of interest (i.e., the load traversal) the beam is sagging, hence the crack is open and the equivalent stiffness of the beam may be treated as constant, and that the crack does not significantly affect the mode shape of the first mode, therefore the crack does not affect the equivalent mass of the beam. These assumptions will be tested below and are shown to have no significant effect and it will be demonstrated that the neglect of this is valid. Further, following the work of Andreaus et al. (2007), since the forcing is not harmonic and only a short time is simulated, the vibration damping may be neglected in this proof-of-concept study.
The equivalent stiffness, Keq, is the force applied at
midspan required to produce a unit deflection at mid-span. Similarly, the equivalent force, Peq, is the force
applied at midspan that produces the same deflection at midspan as the actual force (F) in its actual location
(xF). These both require calculation of the deflection of a cracked SSB at an arbitrary abscissaxwith an open crack present at abscissaL0, imposed by a force at
pos-itionxF.
Caddemi and Morassi (2007) present this total deflection of the cracked beam at position x,
~
xFðx,L0Þ, as the sum of the deflection of the pristine
beam,xFðxÞand a termwxFðx,L0Þthat accounts for the
additional flexibility of the beam due to the damage at
L0, that is
~
xFðx,L0Þ ¼xFð Þ þx wxFðx,L0Þ ð1Þ
For 05x5xF the first term expands to
xFðxÞ ¼
FxðLxFÞ
6EIL ðxFð2LxFÞ x
2Þ ð2Þ
(the case xF5x5L may be derived by symmetry) while the compensation term due to the flexibility of the crack is
wxFðx,L0Þ ¼
~
M Lð 0,xFÞ
x 1L0 L
, 0xL0 L0 1Lx
, L0xL (
ð3Þ
where M L~ð 0,xFÞ is the bending moment at the crack position L0 due to a force F applied at xF, and is the equivalent stiffness of a spring model for the crack, which is
¼ EI
[image:3.595.146.462.67.279.2]5:346h Cð Þ ð4Þ
CðÞ ¼1:862423:953þ16:375437:2265
þ76:816126:97þ1728143:979
þ66:5610
ð5Þ
Note that the second case in equation (3) is obtained by symmetry, replacingxandL0withL–xandLL0
respectively.
Accordingly,Keq, the equivalent cracked beam
stiff-ness, is the inverse of ~L=2 L2,L0
for a unit load. Thus, putting F¼1 and x¼L=2 we obtain ~
M L0,L2
¼12ðLL0Þ or 12L0 respectively for L04 L=2 and L05L=2, which may be substituted into
equation (3), and from equation (2) we obtain L=2ðL=2Þ ¼L3=48EI. Then, by inverting equation (1)
with these values
Keq¼ L2
0 4þ
L3 48EI
1
, L0L2
LL0 ð Þ2
4 þ
L3 48EI
1
, L0L2 8
> < >
: ð6Þ
Finally, the equivalent applied force for the SDOF model is, by definition, Peq¼Keq~xF
L
2,L0
. Six states must be considered, three for a crack on the left (L0L2), and three others for a crack on the right
(L0L2). We expand ~xF using equations (2) and (3)
to obtain for the case L0L2
Peq¼FKeq
xFL0ðLL0Þ 2L þ
xFð3L24x2FÞ
48EI ,
LxF
ð ÞL2 0 2L þ
xFð3L24x2FÞ
48EI ,
LxF
ð ÞL2 0 2L þ
xFL
ð ÞL28Lx
Fþ4x2F
ð Þ 48EI 8 > > > > > < > > > > > :
ð7Þ
for 0xFL0, L0xF L2 and L2xFL respect-ively. Likewise, for L0L2, the formulae are
Peq¼FKeq
xFðLL0Þ2 2L þ
xFð3L24x2FÞ
48EI ,
xFðLL0Þ2 2L þ
xFL
ð ÞL28Lx
Fþ4x2F
ð Þ
48EI ,
L0ðLxFÞðLL0Þ
2L þ
xFL
ð ÞL28Lx
Fþ4x2F
ð Þ 48EI 8 > > > > > < > > > > > :
ð8Þ
for 0xFL2, L2 xFL0andL0xFL, respect-ively. In all the above equations,xF¼VtwhereVis the velocity of the moving load. Note that in equations (7) and (8), the term has the dimension N:m and, there-fore, all the terms after the brace have the dimensionm
N.
As such, considering the fact thatKeqhas the dimension N
m, then bothFandPeqhave dimension N.
To obtain the equivalent mass Meq a key
require-ment of the SDOF dynamic model is to replicate the
fundamental frequency of the beam as
!1¼ ffiffiffiffiffiffiffiffiffi
Keq
Meq
s
ð9Þ
A corollary of the assumption that the crack does not affect the mode shape is that the equivalent mass is the same for both the uncracked and cracked beam. It can therefore be determined by equating the above expression for!1with the well-known fundamental
fre-quency for an undamaged uniform SSB (e.g., Irvine, 2012)
!1 ¼
L 2 ffiffiffiffiffiffiEI
m r
ð10Þ
taking Keqto be that for the undamaged beam (48LEI3). Thus
Meq¼ 48
4mL ð11Þ
Having determined Meq, Keq and Peq, the
SDOF differential equation of the vibration of the undamped cracked beam at its midspan can be written as
Mequ t€ð Þ þKequ tð Þ ¼PeqðVtÞ ð12Þ
To normalize the above equations, a nondimen-sional load position variable ¼VtL is introduced, which takes values from 0 to 1 as the force moves from the left end of the beam to the right. Accordingly, by this change of variable we have
MeqV2
KeqL2
d2uðÞ
d2 þuðÞ ¼
PeqðLÞ
Keq
ð13Þ
We further introduce a dimensionless crack location,
l¼L0=L.
The dynamic response of the beam,uðÞ, is the solu-tion to equasolu-tion (13) with initial condisolu-tions uð0Þ ¼
duð0Þ=d¼0. Since the right-hand side of this equation is nontrivial, code has been written to solve it using MATLAB’s inbuilt numerical ordinary differential equation solver functions.
2.2. A simple FE model of the beam
results in this paper are generated using the SDOF model because of its computational efficiency.
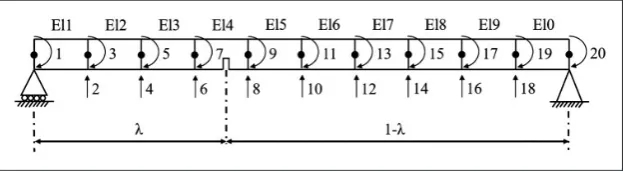
Details of the FE model for the undamped vibration of a cracked SSB subjected to a moving load can be found in several references (Peng et al., 2007; Rowley, 2007; He and Zhu, 2016). In the FE model, the beam is divided into line elements with two nodes, each with four degrees of freedom—the vertical translation and rotation of its two nodes. These degrees of freedom correspond to principal axes of the beam, so are uncoupled from lateral and torsional degrees of free-dom, hence the latter do not influence results and may be neglected. It was found that ten elements, giving the 20 active degrees of freedom shown in Figure 2, were sufficient to achieve good accuracy at the frequencies of interest. The sought output is the translational degree of freedom of the beam at its midspan, namely the tenth degree of freedom.
Damage in structures can also be in the form of fatigue defects, which can appear over a more extended area of the beam rather than being localized. This form of defect can be modeled by reducing the effective modulus of elasticity of a portion of the beam (Kurata et al., 2010). Therefore, one way to simulate a defect is to introduce an equivalent stiffness reduction factor,, based on continuum crack mechanics (Sinha et al., 2002). In the element containing the crack the flexural rigidity of the intact beamEIis multiplied by , where 01, and ¼1 and ¼0 correspond respectively to an intact element and an entire loss of the stiffness of the element. The factoris applied only to a single element; however, it is applied to the whole element and does not take into account the location of the crack within that element. Therefore, we further assume that the crack exists exactly at the center of the defective element, preserving the necessary element stiffness symmetry.
Several researchers have proposed different models to calculate the stiffness reduction of the beam at the
crack position (Brown and Srawley, 1966;
Dimarogonas, 1996; Wang, 1996; Ostachowicz and Krawczuk, 2001; Zheng and Fan, 2003; Alsabbagh
et al., 2009); however, these all contain empirical con-stants. Indeed, the crack model of Caddemi and Morassi (2007) used in the SDOF method of this paper is no exception (see equations (4) and (5)). Hence the choice of method will affect numerical simulations.
Therefore, in this paper, in order to achieve a local stiffness reduction (FE model) that is consistent with the global stiffness reduction (SDOF model), first the static deflection of the cracked beam is calculated using the SDOF model. Then,for the cracked element is set to achieve the same value for the static deflection of the cracked beam in the FE model.
A test case is presented in the following sub-section to demonstrate the equivalence of the SDOF and FE models for both the damaged and undamaged beams.
2.3. Numerical simulation, validation, and
observations leading to the proposed
damage detection method
[image:5.595.311.547.441.568.2]Throughout this paper, without loss of generality, the mechanical constants and moving load properties used by Roveri and Carcaterra (2012) have been adopted for the current simulations and are given in Table 1, while the variables were the crack depth and location param-eters, ¼a=h and l¼L0=L, and the moving load
[image:5.595.149.461.599.685.2]Figure 2. The beam is divided into 10 elements. There is no vertical translation at the supports, accordingly there are 20 active degrees of freedom (11 rotations and nine translations, labeled 1–20), of which the deflection time history of the beam mid-span (tenth degree of freedom) is of interest.
Table 1. System constants.
Quantity Value
Modulus of elasticity E 200 GPa
Density 7800 kg/m3
Poisson’s ratio 0.3
Beam length L 20 m
Cross-section depth h 0.2 m
Cross-section width w 0.2 m
Moving load magnitude F 1000 N
velocity,V. The moving load is considered to pass over the beam with a uniform velocity.
In all graphs in this paper, the displacements are normalized with respect to the midspan static deflection in the undamaged beam due to the loadFapplied at the midspan, which is
L=2 L
2 ¼
FL3
48EI¼6:25 mm ð14Þ
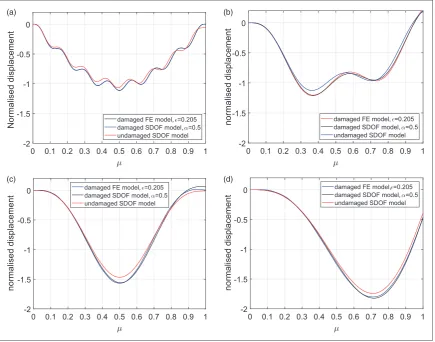
[image:6.595.70.516.329.685.2]As a test case for the FE validation of the SDOF model, it is assumed that a crack of depth¼0:5 exists at the center of the fourth element, that is, l¼0:35. The midspan static deflection predicted by the SDOF model is approximately 6.493 mm, which is matched in the FE model with ten elements using a stiffness reduc-tion factor of¼0:205.
Figure 3 shows the deflection-time histories in the undamaged beam predicted by the FE and SDOF models for different moving load velocities.
The Figure 3 captions also show the time taken for the load to traverse from position ¼0 to ¼1, expressed as the number of periodsTof the first vibra-tion mode oscillavibra-tion.
Results for the slowest moving loads (V¼5 m/s, Figure 3 (a)) can clearly be decomposed into a small dynamic response (evident in Figure 3 (a) as 4.59 peri-ods of the first mode oscillation) superimposed on the static deflection (which rises to a unit magnitude at ¼0:5, then returns to zero at¼1), hence the nor-malized deflection only slightly exceeds unity. However, there is growing and significant asymmetry and dynamic amplification as the load speed increases, for example, reaching a peak of nearly 1.8 and shifted to ¼0:8 when V¼30 m/s (Figure 3 (b)). This indicates a delay in the beam response due to the beam’s inertia, followed by dynamic overshooting of the static response.
This means that the SDOF and FE results are in excellent agreement. It has already been noted that the dynamic component of the response in Figure 3(a)
0 0.1 0.2 0.3 0.4 0.5 0.6 0.7 0.8 0.9 1 -1.5
-1 -0.5 0
Normalised displacement
FE model SDOF model
0 0.1 0.2 0.3 0.4 0.5 0.6 0.7 0.8 0.9 1 -1.5
-1 -0.5 0
Normalised displacement
FE model SDOF model
0 0.1 0.2 0.3 0.4 0.5 0.6 0.7 0.8 0.9 1 -1.5
-1 -0.5 0
Normalised displacement
FE model SDOF model (a)
(c)
(b)
occurs at the beam’s first natural frequency, which the SDOF model is designed to capture.
Figure 4 compares the SDOF and FE results for the damaged beam, at load speeds more typical of what will be used later, plotting also the undamaged beam results for reference.
A key observation is that the difference between the SDOF and FE results is much less than the difference between the damaged and intact results, justifying again the use of the SDOF model and further demon-strating that the global stiffness reduction technique used in the SDOF model aligns well with the local stiff-ness reduction of the FE model.
3. Solving the inverse problem to
determine a damage sensitive
feature (DSF)
In the previous section, the direct problem of the vibra-tion of a cracked beam subjected to a moving load is
solved. In this section, a method for detecting the crack location and size is proposed based on the velo-city-time history of the beam at its midspan. A crit-ical velocity is first introduced, at which the damage can be pinpointed on the beam with a higher level of precision.
3.1. Definition of a critical velocity
Consider the undamaged case. We seek a velocity for which the moving load reaching the beam’s right end coincides with a zero midspan displacement, and will call this thecritical velocity. This is of interest because when damage exists the midspan displacement at this time will change, thus providing an easy means of detecting the damage.
If the beam has unit impulse responsegðÞ, then by convolution, and expressing u and Peq also in terms
of the dimensionless variable, the midspan displace-ment when the moving mass reaches the beam’s
0 0.1 0.2 0.3 0.4 0.5 0.6 0.7 0.8 0.9 1 -2
-1.5 -1 -0.5 0
Normalised displacement damaged FE model, =0.205damaged SDOF model, =0.5 undamaged SDOF model
0 0.1 0.2 0.3 0.4 0.5 0.6 0.7 0.8 0.9 1 -2
-1.5 -1 -0.5 0
normalised displacement damaged FE model, =0.205damaged SDOF model, =0.5 undamaged SDOF model
0 0.1 0.2 0.3 0.4 0.5 0.6 0.7 0.8 0.9 1 -2
-1.5 -1 -0.5 0
normalised displacement
damaged FE model, =0.205 damaged SDOF model, =0.5 undamaged SDOF model
0 0.1 0.2 0.3 0.4 0.5 0.6 0.7 0.8 0.9 1 -2
-1.5 -1 -0.5 0
normalised displacement
damaged FE model, =0.205 damaged SDOF model, =0.5 undamaged SDOF model
(a) (b)
[image:7.595.88.524.322.664.2](c) (d)
right end is
uð1Þ ¼L V
Z1
0
PeqðÞgð1Þd
¼L V
Z1 2
0
PeqðÞgð1Þdþ
L V
Z1
1 2
PeqðÞgð1Þd
ð15Þ
However, we observe in equation (7) (or equation (8)) that PeqðÞ ¼Peqð1Þ for the undamaged case, thus by a change of variable we can rewrite the second integral and combine with the first to give
uð1Þ ¼L V
Z 1 2
0
PeqðÞ½gðÞ þgð1Þd ð16Þ
Over the interval 012, and combining equa-tions (6) and (7), Peq¼Fð342Þ for the intact beam, we note also that the unit impulse response func-tion for a simple spring-mass system is gðÞ ¼
1
Meq!1sin !1
L V
, where VLis the time, and!1¼ ffiffiffiffiffiffiK
eq
Meq
q
is
the first mode undamped natural frequency. The dis-placement, normalized by the absolute value of the midspan static deflection (L=2 L2 ¼KFeq, and noting
that it is negative), is then
uð1Þ
L=2 L2
¼KeqL FV
Z1 2
0
PeqðÞ½gðÞ þgð1Þd
¼3 sin½ð
22þ2Þcos2
33
ð17Þ
where ¼TVL ¼2!LV. Recall that T is the first mode period.
The sought critical velocities are obtained from the values of that give uð1Þ ¼0. These are solutions to sin¼0, that is, n¼1, 2, 3. . .(n¼1, 3, 5. . .), but also solutions to cos¼222þ2, that is, n¼1:5255, 2.4899, 3.5052, 4.4968, etc. (n¼2, 4, 6, 8. . .). The first critical velocity is obtained from1¼1, so the critical
velocity may easily be determined experimentally from the intact beam’s first natural frequency and length between supports as
V1cr¼L
T ð18Þ
For the purpose of simulation, we refer to
equa-tion (10), the fundamental period is T¼2L2 ffiffiffiffi m EI q , and
so the first (and highest) critical velocity is
V1cr¼
2L ffiffiffiffiffiffi EI m r
ð19Þ
There are infinitely many lower critical velocities
Vncr¼ 1
n
V1cr ð20Þ
For the example of this paper (Table 1) V1cr is 22.96 m/s, and we see from equation (17) that the dis-placement is zero at this velocity, and at 15.05, 11.48, 9.22, etc. m/s. It is noted that the critical velocity will be higher (for example) for beams that are stiffer, lighter or shorter than that modeled by Roveri and Carcaterra (2012), on which the present simulations are based. However, provided that the appropriate critical velocity is used the results will be identical.
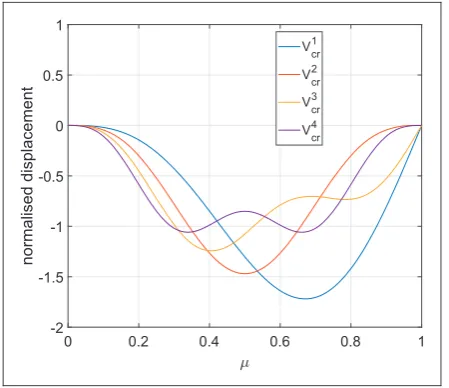
Figure 5 plots full displacement-time histories for several critical velocities. The odd critical velocities (solutions to sin¼0) show a steep slope at ¼1, while even ones are flat, so the former will show more change when the beam has small damage. The odd crit-ical velocities also show much greater asymmetry, a further important beneficial point that will be discussed in detail later.
3.2. Proposing a DSF
As can be seen from equation (18), the critical velocity has an inverse relationship with the length of the beam
Land direct relationship with the root of flexural rigid-ity of the beam EI. This makes the application of the proposed Vcr for crack detection on a real structure
more practical as discussed in the following sub-sections.
Let us assume that the beam has an open crack with arbitrary crack parameters and l, where specifies
0 0.2 0.4 0.6 0.8 1 -2 -1.5 -1 -0.5 0 0.5 1 normalised displacement V1 cr V2 cr
V3cr
[image:8.595.304.529.68.262.2]V4cr
the crack severity and 05l51 specifies the location of the crack on the beam.
It is obvious that the beam response varies as the beam becomes more flexible due to the crack. The first period of the cracked beam T~ increases, which affects the impulse response, but the equivalent load function Peq changes as well (equations (6), (7), and
(8)). Both affect equation (17). This means that if the load velocity is not changed when the crack is intro-duced, the deflection at the time when the load arrives at the opposite support will no longer be equal to zero. The degree to which the deflection of the beam varies from zero when the load arrives at ¼1 is strongly related to the crack parameters and can therefore be considered as a DSF for damage detection. On the other hand, because initial conditions are that the deflection of the beam at its midspan at the start of the experiment (¼0) is also equal to zero, in order to obtain the maximum integrity with regards to noisy measurements an alternative formula for the proposed DSF can be introduced as
DSF¼ðuð1Þ uð0ÞÞ Sf
L=2 L2
¼ L V
R1
0 u_ðÞdSf
L=2 L2
ð21Þ
whereSf is the sampling frequency and has the value
1000 Hz in the present work. The latter form of the DSF is just a normalized area under the velocity time history of the beam at its midspan. Time-velocity responses of structures have been used by some researchers for early earthquake damage detection (Rahmani et al., 2015). They are typically derived from acceleration measure-ments, which are more convenient to make than direct displacement measurements. The numerator of equa-tion (21) can be obtained in MATLAB by using the function trapz. By using the integral of the velocity rather than the deflection of the beam at the end of the experiment, equation (21) may reduce the effect of noise in the signal. The velocity of the beam can be measured using laser vibrometry devices, which are also very accurate. Double integration of acceleration measurements may further reduce noise but may increase baseline shifts.
The variation of DSF withandlfor a beam with a single crack is shown in Figure 6, calculated using the following procedure:
1. Keq,MeqandV¼V1crwere calculated using equa-tions (6), (11), and (19), respectively (the choice of
V¼V1
cr will be explained in the next section); 2. equation (13) was solved to obtain uðÞ for all
combinations of and l, with Peq evaluated at xF¼Lusing equations (7) and (8); and
3. the DSF was obtained using equation (21).
3.3. Choice of critical velocity
If the load moves at a critical velocity then, by defin-ition, the proposed DSF will be zero when the beam is undamaged. However, considering that there are infin-itely many critical velocities, it is not immediately obvi-ous which critical velocity will produce the DSF that gives the strongest indication of the damage parameters.
To resolve this, Figure 7 shows the DSF for the case of a crack of severity¼0:5, plotted as a function of crack positionlon the beam for different critical velo-cities of the load. Figure 7 (a) shows that the first crit-ical velocity is a good choice for damage detection. The skewness and smoothness of the DSF graph for the case whenV¼V1cr, are both desirable features. The smooth-ness ensures that there is reasonable sensitivity of loca-tion detecloca-tion over the majority of the beam length and avoids potential ambiguities caused by nonunique solu-tions, while the asymmetry is a feature that, we will see below, can be exploited to simultaneously detect both location and severity of the crack. The even critical velocities tend to be more symmetric, while critical velocities of higher indexntend to be less smooth, bor-dering on being nonmonotonic in each half of the beam.
As an interesting aside, Figure 7 (b) shows a similar DSF plot for a moving load velocity of 2V1
[image:9.595.318.540.63.251.2]cr, that is, significantly higher than the highest critical velocity. Not only does the DSF need to be referenced to a nonzero value for the undamaged beam case, which makes it more difficult to quantify and also susceptible to noise, but the DSF plot at high velocities tends to Figure 6. Damage sensitive feature graph (Sf¼1000 Hz) for different crack depthand position using the first critical velocityV1
become almost completely symmetric. We will see that this would prevent the simultaneous detection of loca-tion and severity under the proposed damage detecloca-tion method. The same discussion is valid for the second critical velocity as can be seen from Figure 7 (c).
The next sub-section examines further properties of the proposed DSF, before a damage detection strategy is proposed in the section that follows.
3.4. Investigating the properties of the
proposed DSF
In this sub-section, without loss of the generality, we focus mainly on the properties of the first critical vel-ocity as the proper velvel-ocity for the damage detection purpose. It can be shown that the conclusions will apply to other critical velocities as well, though less conclusively, as foreshadowed in the previous section.
As might be expected from Figure 7, using the first critical velocity one obtains a fairly smooth graph for the proposed DSF when both andl are considered. However, one of the most important properties of the introduced DSF is that it is not completely symmetric. This means that for a fixed crack depththe calculated DSF for the same crack at land 1l are not equal. For instance, when ¼0:3 the calculated DSF when the crack exists at l¼0:2 is –2.16, whereas the DSF whenl¼0:8 is –13.05.
This asymmetry allows us to detect the damage loca-tion. To this end, we introduce a two-stage damage detection method in the next section: it first uses the recorded midspan velocity time history when the load moves from left to right, and then the history for a load moving from right to left. We find this procedure also yields the crack severity.
First though, we investigate more properties of the proposed DSF. Referring to equation (18), and keeping
in mind that for a prismatic beam m ¼wh and
I¼121wh3, we have
V1cr¼h L
ffiffiffiffiffiffiffiffi E
48
s
ð22Þ
Equation 22 shows that for two prismatic beams with the same material the critical velocity is a function of the ratio h
L only. In fact, this holds for prismatic beams with geometrically similar cross-sections of any shape. The width w does not have any effect on the critical velocity.
It is worth mentioning that one may couple the pro-posed method with some preliminary model updating technique, so as to work with an updated (less errone-ous) model when generating the contour plot of the Figure 6.
The following properties of the proposed DSF can be directly deduced from the above discussions:
1. the DSF graph is not symmetric and, hence, for a fixed crack depth , the calculated DSF for the crack positionsland 1lare not equal; 2. the proposed DSF is not sensitive to the
magni-tude of the applied force as it is normalized by the static deflection of the beam due to the same load; and
3. the proposed DSF is independent of the width of the beam w, and does not change when L/h is maintained as constant. In this paper L=h¼100. Hence, the DSF graph of Figure 6 and the critical velocities are identical for all similar SSBs with
L=h¼100.
To illustrate the third point, it is noted from equa-tion (13) that the damage influences the DSF via the
[image:10.595.55.530.71.217.2](a) (b) (c)
Figure 7. Calculated damage sensitive features (Sf¼1000 Hz) for a crack with severity¼0:5 as functions of position along the beam for 2V1
KeqandPeqterms. From the definitions of these terms
(equations (6)–(8)) it is seen that the relative effect of the crack depends on the ratio L=EI, which in turn depends only on the ratioL/hand the crack parameter
CðÞ(equations (4) and (5)).
4. Concurrent determination of both
location and severity of damage
4.1. Noise-free case
Now that the properties of the proposed DSF have been stated, we can introduce a damage detection pro-cedure to simultaneously find both the location and severity of an open crack in an SSB using the proposed moving load experiment. To uniquely solve for these two variables, two experiments must be conducted. For this, we exploit the first property of the proposed DSF identified above, namely its asymmetry.
First, the load is moved over the beam from left to right, as shown in Figure 8 (a). The resulting DSF does not uniquely define either or l—two different cracks with different and l might have equal DSF—however, it does constrain the possible combin-ations, which can be represented as a contour of Figure 6. As an example, consider the case of a crack of severity¼0:3 located atl¼0:6. The DSF for this combination with a load moving at speed V1
cr is –37.4964, and the contour of this value is shown as the red line in Figure 9 (a).
Next, the load is moved from right to left, shown in Figure 8 (b). Possible outcomes from this experiment
are represented by a reversed version of the surface of Figure 6, that is, withl replaced by 1l. Hence, for the DSF measured from this second experiment, another contour relating possible combinations of and l can be drawn. In the above example the DSF for the load moving from right to left at speed V1
cr is –24.1246, and this contour is shown as the blue line in Figure 9 (a).
The point at which these two contours intersect,
ð,lÞ ¼ ð0:3, 0:6Þ, defines the parameters of the crack. We see in Figure 9 (b) that any pair of red and blue contours intersect only once, hence the location and severity of the crack may be uniquely defined.
In this example the load has been moved at velocity
V1
cr. It was suggested above that the skewness and smoothness of the DSF graph are both desirable fea-tures, ensuring that there is reasonable sensitivity of location detection over the majority of the beam length and avoiding potential ambiguities caused by nonunique solutions. Critical velocities of even index were rejected because of the symmetry of the resulting DSF graph. The problems with the results being non-unique when using critical velocities of higher odd indi-ces are clearly demonstrated in Figure 10, and become progressively worse as the index is increased. ThusV1cr
is confirmed as the best candidate.
Accordingly, a damage detection procedure can be summarized as follows:
1. a load is moved over the beam with the velocity
V1
[image:11.595.146.466.489.684.2]cr, first from left to right and then from right to left, and vertical velocity-time history of the center
(a) (b)
[image:12.595.54.530.70.277.2](c)
Figure 10. (Color online) Damage sensitive feature contours (Sf¼1000 Hz) for left-right and right-left experiments for higher critical velocities: (a) third critical velocity; (b) fifth critical velocity; and (c) seventh critical velocity.
[image:12.595.72.512.344.718.2](a) (b)
of the beam is recorded in both cases (see Figure 8);
2. the DSF is computed for each case; and
3. the intersection of the relevant contours of Figure 9(b) defines the location and the severity of the crack.
4.2. Assessment of accuracy of crack
characterization in the presence of noise
Since most real data will be contaminated by noise, it is necessary to demonstrate the robustness of the method in the presence of noise. In this sub-section, the per-formance of the proposed damage detection technique is examined with simulated noise of the form suggested by He et al. (2017)
^_
uL=2¼u_L=2þ k
100Nnoiseðu_L=2Þ ð23Þ
whereu_L=2 is the calculated accurate noise-free velocity
vector at the beam’s midspan, ðu_L=2Þ is its standard
deviation, the noise level (expressed as a percentage) isk, Nnoise is a vector with the same length as u_L=2 of
random independent variables following a standard normal distribution, andu^_L=2is the vector of simulated
noisy velocity data.
In order to evaluate the capability of the proposed method against noisy measurements, three damage scenarios are considered, summarized in Table 2.
In the first scenario a relatively large crack exists on the beam at a point almost midway between the right support position and the midspan of the beam. In the second scenario the crack, also large, is closer to the midspan of the beam. Finally, the third scenario is a case of a relatively small crack, but again near the mid-span of the beam.
In order to evaluate the effect of noisy measurements on damage detection, 2% noise of the form of equa-tion (23) has been introduced to the data simulated in MATLAB and the DSF has been calculated after using a low pass filter with a cut-off frequency of 50 Hz. The simulation was run 1000 times with different random number seeds for each scenario, and the length of the vector between the predicted pair,^ l^and the exact pointð,lÞhas been calculated for each case. To indi-cate the 95% confidence range, the 5% farthest among the 1000 points have been excluded. The remaining points are plotted in Figure 11.
As can be seen in Figure 11, the most reliable damage detection occurs when the DSF is largest, that is, the large crack close to the midspan of the beam (second scenario), followed by the large crack at a point farther from the midspan (first scenario).
It is also clear from the scatter of the predictions that for a relatively small crack, even when it is close to the midspan, there is significantly more uncertainty in the detected severity and location (third scenario).
Sometimes the measured vibration data can be sen-sitive to environmental effects such as diurnal tem-perature variation (Sohn, 2006; George et al., 2017). As such a higher level of 10% noise is now considered. Figure 12 shows the histogram of the obtained DSF for the undamaged and damaged beam having a crack with ¼0:5 and l¼0:3 after 1000 simulations. As can be seen from Figure 12 (a), in the case of a healthy beam the average DSF is –0.0130, which rep-resents almost no crack on the beam. For the case of a crack with¼0:5 andl¼0:3, Figure 12 (b) shows a mean value of –33.9738 which is close to the exact value of –33.6246; similarly the mean value of the DSF for the left to right experiment (Figure 12 (c)) is –90.8038 which is exactly equal to the correct value. These results show that even when more noise is pre-sent the location and severity of the damage can be accurately detected by conducting several repetitions of the experiment and averaging out the obtained DSF results.
Figure 11. Contour of the possible crack area obtained for the first damage scenario after 1000 simulations per each
experiment.
Table 2. Damage scenarios.
Scenario
First 0.4 0.7
Second 0.4 0.4
[image:13.595.318.539.129.370.2]5. Conclusions
In this paper a new damage detection method is pro-posed for detection of a crack in an SSB subject to a moving load. The proposed method is able to determine both the location and severity of the crack, and is robust in the presence of moderate noise.
To that end, two experiments must be conducted. In the first experiment the load is moved over the beam from left to right and the velocity-time history of the beam is measured at its midspan. In the second experi-ment the load is moving from right to left. In particular, it is shown that the first (highest) critical velocity V1
cr always leads to a reliable and unique solution for the crack parameters ð,lÞ.
In order to see how the noisy measurements can affect the results, 2% noise has been introduced to the simulated data. The results show, unsurpris-ingly, that the accuracy of the crack detection improves for bigger cracks closer to the midspan of the beam.
For real-world situations the impact of the higher modes, noise, damping, and other environmental effects may make the analysis considerably more complex but it may be possible in future work to solve these and related problems using techniques such as supervised machine learning alongside the proposed approach. If these problems are solved it may also open the tech-nique to using multiple sensors to improve the robust-ness of the method. However, while there are many
(a) (b)
[image:14.595.57.527.67.464.2](c)
further questions that could be explored, this paper provides a proof of concept that multiple crack param-eters may be determined from multiple independent experiments.
Declaration of Conflicting Interests
The author(s) declared no potential conflicts of interest with respect to the research, authorship, and/or publi-cation of this article.
Funding
The author(s) received no financial support for the research, authorship, and/or publication of this article.
ORCID iD
Mohsen Mousavi https://orcid.org/0000-0002-0436-5176 Damien Holloway https://orcid.org/0000-0001-9537-2744
References
Aied H, Gonza´lez A and Cantero D (2016) Identification of sudden stiffness changes in the acceleration response of a bridge to moving loads using ensemble empirical mode decomposition. Mechanical Systems and Signal Processing66–67: 314–338.
Alsabbagh ASY, Abuzeid OM and Dado MH (2009) Simplified stress correction factor to study the dynamic behavior of a cracked beam. Applied Mathematical Modelling33(1): 127–139.
Andreaus U, Casini P and Vestroni F (2007) Non-linear dynamics of a cracked cantilever beam under harmonic excitation.International Journal of Non-Linear Mechanics 42(3): 566–575.
Bakhtiari-Nejad F and Mirzabeigy A (2013) Vibration ana-lysis of a beam with breathing crack under moving load effect. In:4th International Conference on Theoretical and Applied Mechanics, Singapore, 11–12 October 2013, pp.55–59.
Brown W and Srawley J (1966) Plane strain crack toughness testing of high strength metallic materials. In:Plane Strain Crack Toughness Testing of High Strength Metallic
Materials. West Conshohocken, PA: ASTM
International, pp.8–15.
Caddemi S and Morassi A (2007) Crack detection in elastic beams by static measurements. International Journal of Solids and Structures44(16): 5301–5315.
Dimarogonas AD (1996) Vibration of cracked structures: A state of the art review. Engineering Fracture Mechanics 55(5): 831–857.
George RC, Posey J, Gupta A, et al. (2017) Damage detection in railway bridges under moving train load. In: Atamturktur HS, Moaveni B, Papadimitriou C, et al. (eds) Model Validation and Uncertainty Quantification, Volume 3. Cham, Switzerland: Springer, pp.349–354.
He WY and Zhu S (2016) Moving load-induced response of damaged beam and its application in damage localization. Journal of Vibration and Control22(16): 3601–3617. He WY, Ren WX and Zhu S (2017) Damage detection of
beam structures using quasi-static moving load induced displacement response.Engineering Structures145: 70–82. Irvine T (2012) Bending frequencies of beams, rods, and pipes. Available at: http://leehite.org/documents/Euler_ Irvine.pdf (accessed 7 May 2019).
Kurata M, Kim JH, Lynch JP, et al. (2010) A probabilistic model updating algorithm for fatigue damage detection in aluminum hull structures. In:ASME 2010 Conference on Smart Materials, Adaptive Structures and Intelligent Systems, Philadelphia, Pennsylvania, USA, 28 September–1 October 2010. New York: American Society of Mechanical Engineers, pp.741–750.
Li J and Zhao X (2006) A super-element approach for struc-tural identification in time domain. Frontiers of Mechanical Engineering in China1(2): 215–221.
Li ZH and Au FTK (2014) Damage detection of a continuous bridge from response of a moving vehicle. Shock and VibrationArticle ID 146802. Available at: https://www.hin-dawi.com/journals/sv/2014/146802/ (accessed 7 May 2019). Link M and Weiland M (2009) Damage identification by multi-model updating in the modal and in the time domain.Mechanical Systems and Signal Processing23(6): 1734–1746.
Meredith J, Gonza´lez A and Hester D (2012) Empirical mode decomposition of the acceleration response of a prismatic beam subject to a moving load to identify multiple damage locations.Shock and Vibration19(5): 845–856.
Nguyen KV (2013) Comparison studies of open and breath-ing crack detections of a beam-like bridge subjected to a moving vehicle.Engineering Structures51: 306–314. Ostachowicz WM and Krawczuk M (2001) On modelling of
structural stiffness loss due to damage. In:Key Engineering Materials, volume 204. Zurich: Trans Tech Publications, pp.185–200.
Pakrashi V, O’Connor A and Basu B (2010) A bridge–vehicle interaction based experimental investigation of damage evolution.Structural Health Monitoring9(4): 285–296. Peng Z, Lang Z and Billings S (2007) Crack detection using
nonlinear output frequency response functions.Journal of Sound and Vibration301(3–5): 777–788.
Rahmani M, Ebrahimian M and Todorovska MI (2015) Time-wave velocity analysis for early earthquake damage detection in buildings: Application to a damaged full-scale RC building. Earthquake Engineering & Structural Dynamics44(4): 619–636.
Roveri N and Carcaterra A (2012) Damage detection in struc-tures under traveling loads by Hilbert–Huang transform. Mechanical Systems and Signal Processing28: 128–144. Rowley CW (2007)Moving force identification of axle forces
on bridges. PhD Thesis. University College Dublin. Sinha JK, Friswell M and Edwards S (2002) Simplified
Sohn H (2006) Effects of environmental and operational vari-ability on structural health monitoring. Philosophical Transactions of the Royal Society A: Mathematical, Physical and Engineering Sciences365(1851): 539–560. Wang CH (1996) Introduction to Fracture Mechanics. DSTO
Aeronautical and Maritime Research Laboratory Melbourne, Australia. Available at: https://afendirojan. files.wordpress.com/2010/04/dsto-gd-0103.pdf (accessed 7 May 2019).
Zheng D and Fan S (2003) Vibration and stability of cracked hollow-sectional beams. Journal of Sound and Vibration 267(4): 933–954.