This is a repository copy of The role of Mg in the crystallization of monohydrocalcite.
White Rose Research Online URL for this paper: http://eprints.whiterose.ac.uk/80229/
Version: Accepted Version
Article:
Rodriguez-Blanco, JD, Shaw, S, Bots, P et al. (2 more authors) (2014) The role of Mg in the crystallization of monohydrocalcite. Geochimica et Cosmochimica Acta, 127. 204 - 220. ISSN 0016-7037
https://doi.org/10.1016/j.gca.2013.11.034
[email protected] https://eprints.whiterose.ac.uk/
Reuse
Unless indicated otherwise, fulltext items are protected by copyright with all rights reserved. The copyright exception in section 29 of the Copyright, Designs and Patents Act 1988 allows the making of a single copy solely for the purpose of non-commercial research or private study within the limits of fair dealing. The publisher or other rights-holder may allow further reproduction and re-use of this version - refer to the White Rose Research Online record for this item. Where records identify the publisher as the copyright holder, users can verify any specific terms of use on the publisher’s website.
Takedown
If you consider content in White Rose Research Online to be in breach of UK law, please notify us by
Elsevier Editorial System(tm) for Geochimica et Cosmochimica Acta Manuscript Draft
Manuscript Number: GCA-D-13-00124R1
Title: The role of Mg in the crystallisation of monohydrocalcite.
Article Type: Article
Corresponding Author: Dr. Juan Diego Rodriguez-Blanco, PhD
Corresponding Author's Institution: Nano-Science Center
First Author: Juan Diego Rodriguez-Blanco, PhD
Order of Authors: Juan Diego Rodriguez-Blanco, PhD; Samuel Shaw, PhD.; Pieter Bots, PhD.; Teresa Roncal-Herrero, PhD.; Liane G Benning, Prof.
Abstract: Monohydrocalcite is a member of the carbonate family which forms in Mg-rich environments at a wide range of Mg Ca ratios Mg aq Ca aq Although found in modern sedimentary deposits and as a product of biomineralization, there is a lack of information about its formation mechanisms and about the role of Mg during its crystallization. In this work we have quantitatively assessed the mechanism of crystallization of monohydrocalcite through in situ synchrotron-based small and wide angle X-ray scattering (SAXS/WAXS) and off-line spectroscopic, microscopic and wet chemical analyses. Monohydrocalcite crystallizes via a 4-stage process beginning with highly
supersaturated solutions from which a Mg-bearing, amorphous calcium carbonate (ACC) precursor precipitates. This precursor crystallizes to monohydrocalcite via a nucleation-controlled reaction in stage two, while in stage three it is further aged through Ostwald-ripening at a rate of 1.8±0.1
nm/h1/2. In stage four, a secondary Ostwald ripening process (66.3±4.3 nm/h1/2) coincides with the release of Mg from the monohydrocalcite structure and the concomitant formation of minor
hydromagnesite. Our data reveal that monohydrocalcite can accommodate significant amounts of Mg in its structure MgCO and that its Mg content and dehydration temperature are directly proportional to the saturation index for monohydrocalcite (SIMHC) immediately after mixing the stock solutions. However, its crystallite and particle size are inversely proportional to these parameters. At high supersaturations (SIMHC=3.89) nanometer-sized single crystals of monohydrocalcite form, while at low values (SIMHC=2.43) the process leads to low-angle branching spherulites. Many carbonates produced during biomineralization form at similar conditions to most synthetic monohydrocalcites, and thus we hypothesize that some calcite or aragonite deposits found in the geologic record that have formed at high Mg/Ca ratios could be secondary in origin and may have originally formed via a
School of Earth and Environment Earth Surface Science Institute University of Leeds
Leeds LS2 9JT UK
Email: [email protected] tel: +44(0)113 3435225
17/02/2013
Dear Executive Editor,
We would like to submit the manuscript listed below for possible publication in Geochimica et Cosmochimica Acta.
Title: The role of Mg in the formation of monohydrocalcite.
Authors: Juan Diego Rodriguez-Blanco, Samuel Shaw, Pieter Bots, Teresa Roncal-Herrero and Liane G. Benning
This manuscript describes an experimental study in which we elucidated the formation mechanism of monohydrocalcite from a poorly-ordered precursor and the role of Mg in its crystallization. Combining in situ synchrotron-based with various off-line laboratory characterizations allowed us to derive complementary quantitative data that explain the monohydrocalcite crystallization via a multiple stage process.
We believe that our paper is of interest to a broad geochemical community and that our results may help explain a number of important biogeochemical processes (including biomineralization and their link to past variations in ocean chemistry).
All authors have read and accepted the manuscript in its current format and we all confirm that this paper represents original work from which no part has been published, nor is being considered for publication, elsewhere.
We suggest Jacques Schott as possible Associate Editor.
A few suggested reviewers are included below:
Prof. Mark Hodson
Environment Department. University of York. Heslington, York. United Kingdom. Email: [email protected]
Dr. Knud Dideriksen
Nano-Science Center, University of Copenhagen, Denmark Email: [email protected]
17/02/2013
2
Prof. Hans G. Machel
Department of Earth & Atmospheric Sciences, University of Alberta, Canada Email: [email protected]
Dr. Jens-Petter Andreassen
Department of Chemical Engineering, Norwegian University of Technology and Science (NTNU), Norway. Email: [email protected]
Dr. Keisuke Fukushi
Institute of Nature and Environmental Technology, Kanazawa University, Japan Email: [email protected]
Yours sincerely,
Prof. Liane G. Benning
Cohen Biogeochemistry Laboratory Direct Line: +44 (0)113 34-35220 School of Earth & Environment Dept.Office: +44 (0)113-34-35222 University of Leeds Fax: +44 (0)113 34-35259
Leeds LS2 9JT E-Mail: [email protected]
UK
Date Oct 15th 2013
Dear Frank,
Thank you very much for the comments and suggestions to improve our manuscript.
Please find below in blue the detailed replies to the reviewersÕ comments. Based on these we have made corrections to the whole manuscript to improve clarity. In our replies we explain in
detail the aqueous speciation calculations (done with PHREEQC) and describe how using this
approach we calculated the saturation index of monohydrocalcite and other carbonates. We
also describe the necessary calculations to determine the Mg content in our monohydrocalcite.
These calculations are relatively standard in PHREEQC and thus we did not include them in
the Supplementary Information Section. However, if you as the AE consider that this is
necessary, we are happy to include these calculations in the Supplementary Information.
In addition we have addressed the comments of Prof Keisuke Fukusjhi regarding (a)
the possibility of having metastable nequehonite formed in our experiments, and (b) the
speciation of Mg in our monohydrocalcite. All our characterization data clearly indicate an
absence of nesquehonite in our experiments and thus our results do not support Prof.
FukushiÕs hypothesis. However, we have taken his suggestions and ideas into account and
discussed them both in the manuscript and in this reply.
We hope now the manuscript is acceptable for publication in GCA.
Yours Sincerely,
Reviewer #1: I enjoyed reading this clearly written paper that describes an elegant set of experiments monitoring the precipitation of ACC and its subsequent crystallisation to monohydrocalcite. These are
techniques I'd love to go and use having read your paper -it is great the way you can follow these
reactions in real time.
I have a few trivial queries that it would be good to consider when you have a chance before the final
version of the manuscript is produced. I have one substantive point, which is why I've ticked
"Substantive modification required" just so the point can be checked by yourselves and the AE, it could
be that I'm wrong and it isn't an issue. So, to let suspense build I'll start with a couple of trivial points...
Abstract - SI <subscript> MHC is not defined before it is given - could be worth a mention though an
informed reader can work it out.
This has been now defined in the abstract.
In the Experimental section at the start you describe your experimental protocol for the SAX / WAX. It
would be helpful here to say what concentrations you were using - I presume the first line of Table 2
gives this info, but it isn't clear.
Similarly at line 160 when you mention the off line experiments - are these the 350 mM Ca, 150 mM Mg
ones.
I think the confusion can be resolved by making clear the concentrations used in this section of text and
also altering Table 2 slightly so that it is clear which set of conditions relate to the first experiment (the
first line of data) and which to the subsequent off line experiments - the rest of the lines of data.
We thank the to reviewer for highlighting this issue. We have added all the requested information to the
manuscript. Specifically we have text to describe the concentration of ions in the stock solution used in
the on-line and off-line experiments, (lines 136-137 and also 162-163, respectively), and rewritten the
caption for table 2.
This is my big question
Line 175 - I had a bit of a problem here but it might just be me. It's too late now but it would surely have
been better to measure the carbonate ion concentrations. You assume that the concentration of
(CO3)2- is equal to the sum of the concentration of Mg2+ and Ca2+. I wonder 2 things. At the pH you
are dealing with, c. 9 won't c. half the carbonate be present as bicarbonate? If that is the case shouldn't
you be adjusting the value of (CO3)2- you are using. Secondly at pH of 9 won't the concentartion of
OH- be non-trivial in terms of the mass balance in your system where (H+) + (Ca2+) + (Mg2+) = (OH-)
+ ((CO3)2-) + ((HCO3)1-). What difference will this make to all your calculated SIs? I think this is
something that you need to address either in the manuscript or to explain to the editor why I'm being
required",
The reviewer is correct in her/his assertion that we may not have explained the calculations correctly. In
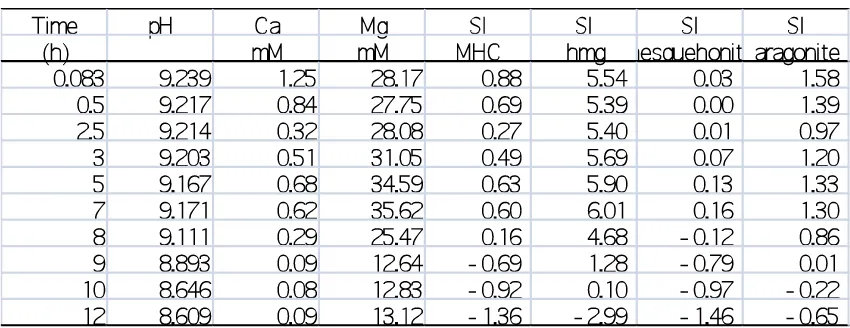
our experiments carbonate was not measured directly in the solutions. The way we determined total
carbonate in solution and the carbonate speciation followed 3 steps:
1. After mixing the initial solutions, dissolved [Ca] and [Mg] were measured in the supernatant
solution at various time steps as explained in the method section and as shown in Fig 7.
2. Using these values we assumed that all the Ca and Mg removed form our initial solution (prior
to mixing) was in the form of Ca/Mg carbonate. Therefore, the number of moles of carbonate
removed form solution must be equal to the total moles of Ca + Mg removed form solution.
3. The concentrations of Ca, Mg (measured), total carbonate (calculated) and pH (measured)
were then entered into PHREEQC to calculate the speciation of carbonate in solution and the
saturation index with respect to MHC and other calcium/magnesium carbonate phases.
We have taken all of these factors into account (as described above) and have updated the manuscript
(line 172- 178) to clarify this point.
Lines 198-200 - why the difference in the temperature range used for your amorphous and crystalline
solids?
The water content of monohydrocalcite is frequently calculated by TGA above 100 ¡C because the loss
of water from 25 to 100 ¡C is considered to correspond to adsorbed and not structural water. Other
authors we cite in our manuscript also measured the water content of monohydrocalcite using TGA
from 100 ¡C, so we have followed the same procedure to be able to compare all data. See for example:
Hull, H., Turnbull, A. G. (1973). A thermochemical study of monohydrocalcite. Geoch. Cosmochim. Ac.,
37, 685-694.
Skinner, H. C. W., Osbaldiston, G. W., and Wilner, A. N. (1977). Monohydrocalcite in a guinea pig
bladder stone, a novel occurrence. Am. Mineral., 62, 273-277.
In the case of the amorphous calcium carbonate (ACC) we needed to consider the loss of weight from
25 to 550 ¡C because this hydrated poorly-ordered precursor is unstable and, depending on its Mg
content, it can crystallise at ambient temperatures after a few hours or days. This loss of structural
water can occur ambient temperature, hence the reason to use the range 25-550 ¡C to estimate its
water content.
Line 221 - again, perhaps I'm misunderstanding here - you have a formula of Ca0.74Mg0.26 etc. surely
this indicates that XMgCO3 = 0.26 but in Table 2 you have XMgCO3 = 0.164. is this a typo?
It is not a typo, however we have now clarified it on line 230.
Line 256 - should be "indicating"
Generally actually you need to have "a" in front of words that don't start with a vowel, only use "an" for
words that start with a vowel.
Corrected. Thank you.
Line 323 - can you explain the basis for your estimation.
Quantification using X-ray diffraction showed that the final content of hydromagnesite in our
experiments was ~4.5 % (i.e. ~ 95.5 % of monohydrocalcite). From these quantitative XRD data and
the final solid composition (mixture of monohydrocalcite and hydromagnesite) obtained from chemical
analysis, it is possible to calculate the composition the monohydrocalcite.
Line 469 - this section suggests that the previous material related to the experiment described in Table
1 and the first line of Table 2 - I think you need to make this all clearer.
We thank the reviewer for pointing this out. The text has been updated to clarify this point (line 493).
Line 650 - PO4 and AsO4 don't exist - you need charges on these.
Corrected. Thank you.
Line 694 - big not bug
Corrected. Thank you.
In the figs. could you use different patterning as well as different colours - my b&w print out made it
hard to spot the different lines you were talking about.
No details about specific figures are given. However:
1) We have been very careful with colours in the figures and have printed them prior to submission to
2) Furthermore all colour figures also include labels, numeric data, symbols with different sizes and
shapes, and even arrows indicating the key information, so the reader can identify the data we are
referring to. In some cases we refer to specific stages in the crystallisation of monohydrocalcite, so the
data is easier to find.
3) Most of the lines in our pictures (e.g.: Fig 3, 4, 9) need to be continuous lines: it would not make
sense to plot fit lines, SAXS patterns or TGA data using different patterning.
table 2 - the column SI<subscript>MHC - which solution is this for? Presumably either the initial
MgCl2/CaCL2 solution or the Na2CO3 solution - in either case how can the solution be saturated with
respect to MHC - presumably it is the MgCl2/CaCl2 solution and the saturation is due to equilibrium
with atmospheric CO2? Again, if you could clarify this it would be helpful.
Table 2 of the original manuscript shows calculated SIMHC in the mixed solutions without any
precipitation. This was we could calculate the saturation index of the solution from which the calcium
carbonate has formed. This is not Òbefore mixingÓ and we apologies for this oversight, and the incorrect
use of this term. We have updated table 2 and the relevant section in the manuscript to clarify this issue
Reviewer #2:
This paper descries the role of Mg for MHC formation by using synchrotron based
time-resolved XRD and classical off-line approach. The results and implication of the present study are
very interesting. However, the discussion is not enough to clarify the role of Mg for MHC formation. The
author should be addressed more about the chemical speciation of Mg in MHC.
This paper described that Mg is accommodated in the MHC structure during stage II to III
without the sufficient evidences. This implies that Mg does not form the discrete hydrous Mg carbonate
during II to III. On the other hand, our recent paper (Nishiyama et al. 2013GCA) showed that the MHC
formation requires the paragenesis of hydrous Mg carbonate (most likely fine grained nesquehonite)
from the equilibrium calculation. We considered that hydromagnesite is the alteration product from the
hydrous Mg carbonate. The authors should discuss more about the chemical speciation of Mg.
On the other hand, I think our conclusion is still valid for the authors experiments and should
be considered in the paper. Table 1 shows the SI of MHC and nesquehonite of the solution before the
precipitations by using the authors results (Table 2 in the manuscript). The SIs were calculated by
using REACT in Geochemists Workbench with "thermo.com.V8.R6+" database. The
bicarbonate/carbonate concentrations were calculated from charge balance of the solutions. Although
the activity is calculated with extended Debye-Huckel equation but it must be valid for the experiments
with lower saturation states. Even for the experiment with highest saturation state, the calculated SI of
MHC (3.76) is close to the authors calculation by using Pitzer equation (3.89). This table clearly shows
that the formations of MHC correspond to the conditions of equilibrium or superstation with respect to
nesquehonite, which is consistent with our conclusion. Table 2 also shows the SIs of relevant minerals
from the authors results for the evolution of the aqueous solution compositions during the MHC
formation (Table 1 in the manuscript). The results show that the solution before hydromagnesite
formation (8h) is almost equilibrium with respect to nesquehonite (SI within ±0.2). This is also
[image:10.595.74.493.634.767.2]consistent with our results (Nishiyama et al. 2003).
Table 2
We thank Prof Fukusjhi for his review and comments. We have modified our manuscript to take his
suggestions into consideration.
We assert, however, that with our new data we have clarified the role of Mg in monohydrocalcite
formation because we have shown that:
1. Mg in solution and high supersaturation levels are required to form monohydrocalcite.
2. The crystallisation of monohydrocalcite takes place via the formation of an Mg-bearing
poorly-ordered precursor (Mg-ACC). Mg plays an essential role in the stability of this precursor phase
controlling the pathway of transformation to monohydrocalcite.
3. Significant amounts of Mg are incorporated into monohydrocalcite structure. The starting
concentration of Mg in solution (Mg/Ca/CO3 ratio) and the initial supersaturation immediately after
mixing the stock solutions are key factors that control the content of Mg in monohydrocalcite.
4. The kinetics of monohydrocalcite growth depends on the Mg content in the solid and the
concentration of Mg in the aqueous solution.
5. The dehydration process, solubility, unit cell parameters, crystallite size and morphology of
monohydrocalcite are dependent on its Mg content.
6. The higher energy required to dehydrate the Mg2+-aquo ion compared to Ca2+-aquo is essential to
understand the longer lifetime of the Mg-ACC precursor and the kinetics of monohydrocalcite growth.
7. Finally, we show a simple methodology to synthesize monohydrocalcite with specific Mg content,
particle size and shape by varying the starting Mg/Ca/CO3 ratio and the initial supersaturation.
Furthermore, Nishiyama et al (2013) GCA state that the formation of monohydrocalcite requires the
paragenesis of hydrous Mg carbonate (e.g. nesquehonite). All the different solid characterization
techniques applied in our work have however revealed that the only crystalline carbonates that could
be unambiguously identified were monohydrocalcite and hydromagnesite. No other phases were
detected. In particular:
1. Our XRD data did not reveal the presence of nesquehonite or other crystalline hydrous carbonates at
starting supersaturation in the crystallization of monohydrocalcite did not show any evidence of
nesquehonite.
2. An in-depth analysis of the time-resolved synchrotron-based WAXS data did not reveal
nesquehonite or other crystalline hydrous carbonates.
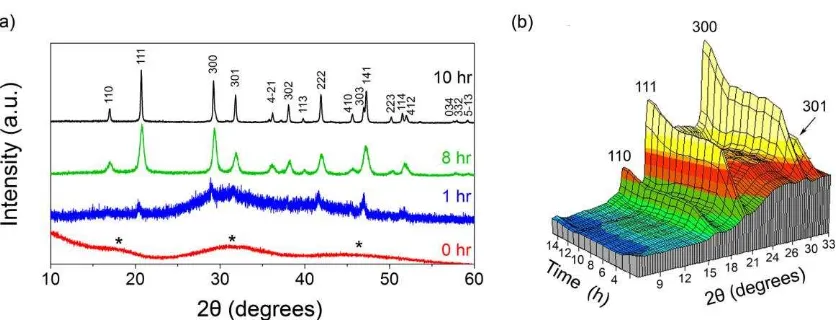
3. Our HR-TEM images only showed a poorly-ordered Mg-ACC precursor during the first stage or the
experiment, followed by monohydrocalcite (stages II to IV) and hydromagnesite at stage IV. No other
solid phases were observed.
However, the calculations of saturation indexes for nesquehonite carried out by Prof. Fukushi show that
the aqueous solution was nearly saturated with respect to nesquehonite and therefore suggest the
potential formation of this mineral. Our conclusion is that despite the combination of conventional XRD,
synchrotron-based WAXS and high-resolution microscopy, which do not show the presence of
nesquehonite, we cannot completely discard the fact that small quantities of nanocrystalline
nesquehonite or other hydrous carbonate may have been present during the experiment.
We have therefore included this hypothesis in the manuscript (lines 458-467) and also calculated the
saturation indexes of nesquehonite in our experiment (now included in Table 1).
Specific comments:
Line 481 and Figure 9a: We observed that Mg content in the solid product decreases by washing with
deionized water (probably because of the high solubility of hydrous Mg carbonate coexisting with MHC).
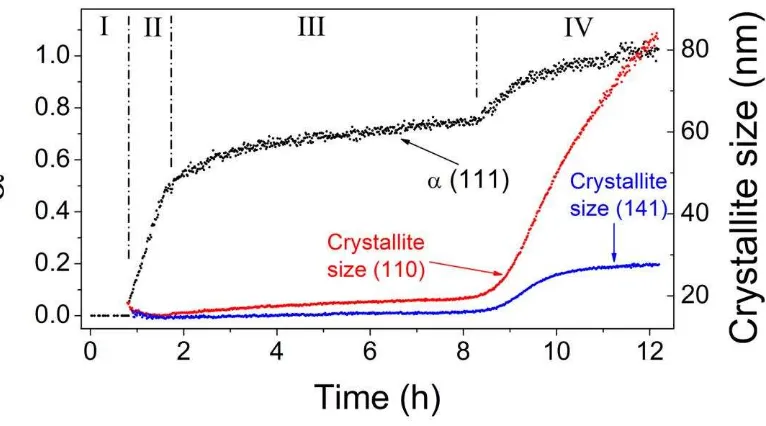
The MHC sample used in the experiments by Munemoto and Fukushi (2008) washed by sufficient
amount of deionized water. So the Mg content in the sample should not be reflected from the saturation
state of initial solution.
This information has been updated in the text. Thank you.
Fig. 8 and Table 1: The SI values of hydromagnesite plotted in the Fig. 8 are different from that in Table
1.
These data is now corrected. Thank you.
Reference:
Nishiyama, R., Munemoto, T., Fukushi, K. (2013) Formation condition of monohydrocalcite from
Page 1 of 41
The role of Mg in the crystallisation of
1monohydrocalcite.
23 4
Juan Diego Rodriguez-Blanco1,2, Samuel Shaw1,3, Pieter Bots1,3, Teresa Roncal-Herrero1, and 5
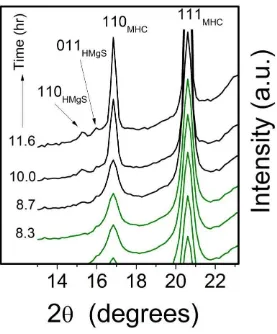
Liane G. Benning1,* 6
7
1School of Earth and Environment. University of Leeds. Leeds LS2 9JT. United Kingdom. 8
2Now at the Nano Science Center, University of Copenhagen. 2100 Copenhagen, Denmark. 9
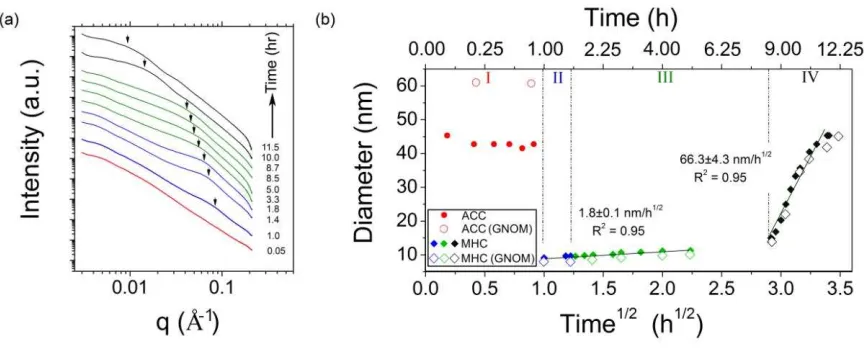
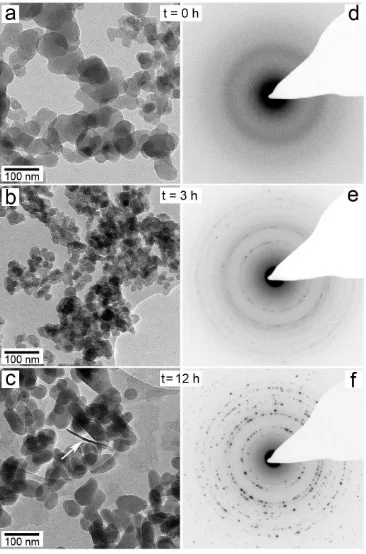
3
School of Earth, Atmospheric and Environmental Sciences, The University of Manchester, Oxford Road, 10
Manchester, M13 9PL. 11
* corresponding author: [email protected] 12 13 14 ABSTRACT 15 16
Monohydrocalcite is a member of the carbonate family which forms in Mg-rich 17
environments at a wide range of Mg/Ca ratios (Mg2+aq/Ca2+aq≥ 0.17 < 65). Although found in
18
modern sedimentary deposits and as a product of biomineralization, there is a lack of 19
information about its formation mechanisms and about the role of Mg during its 20
crystallization. In this work we have quantitatively assessed the mechanism of crystallization 21
of monohydrocalcite through in situ synchrotron-based small and wide angle X-ray scattering 22
(SAXS/WAXS) and off-line spectroscopic, microscopic and wet chemical analyses. 23
Monohydrocalcite crystallizes via a 4-stage process beginning with highly supersaturated 24
solutions from which a Mg-bearing, amorphous calcium carbonate (ACC) precursor 25
precipitates. This precursor crystallizes to monohydrocalcite via a nucleation-controlled 26
reaction in stage two, while in stage three it is further aged through Ostwald-ripening at a rate 27
of 1.8±0.1 nm/h1/2. In stage four, a secondary Ostwald ripening process (66.3±4.3 nm/h1/2) 28
coincides with the release of Mg from the monohydrocalcite structure and the concomitant 29
formation of minor hydromagnesite. Our data reveal that monohydrocalcite can 30
accommodate significant amounts of Mg in its structure ( MgCO3=0.26) and that its Mg
31
content and dehydration temperature are directly proportional to the saturation index for 32
monohydrocalcite (SIMHC) immediately after mixing the stock solutions. However, its
33
crystallite and particle size are inversely proportional to these parameters. At high 34
Page 2 of 41
supersaturations (SIMHC=3.89) nanometer-sized single crystals of monohydrocalcite form,
35
while at low values (SIMHC=2.43) the process leads to low-angle branching spherulites. Many
36
carbonates produced during biomineralization form at similar conditions to most synthetic 37
monohydrocalcites, and thus we hypothesize that some calcite or aragonite deposits found in 38
the geologic record that have formed at high Mg/Ca ratios could be secondary in origin and 39
may have originally formed via a metastable monohydrocalcite intermediate. 40
41
Keywords: monohydrocalcite, carbonates, magnesium, synchrotron, SAXS, WAXS, 42 scattering. 43 44 45 1. INTRODUCTION 46 47
A variety of calcium carbonate minerals are stable at Earth surface conditions. These 48
include the common polymorphs calcite, vaterite and aragonite, and the less common and 49
hydrated phases monohydrocalcite (CaCO3H2O) and ikaite (CaCO36H2O).
50
Monohydrocalcite forms in a variety of modern natural environments including saline spring 51
waters (Ito, 1993), marine polar systems (e.g., Antarctic lakes, or Ikka Fjord, Greenland; Bird 52
et al., 1991; Dahl and Buchardt, 2006), basaltic caves (Broughton, 1972; Onac, 2000; 53
Léveillé et al., 2000), cold/humid mine galleries and lacustrine deposits. Representative of the 54
latter environment is for example, the oldest known monohydrocalcite, 800 ka. (Solotchina et 55
al. (2009), that was found in deep sediments at Lake Hovsgol, NW Mongolia. Other 56
lacustrine examples include Lake Kivu in Africa, or Lake Fellmongery and Lake Butler in S. 57
Australia (Stoffers and Fischbeck, 1974 and Taylor, 1975). Monohydrocalcite is usually 58
found in association with other carbonates like Mg-calcite, aragonite, Ca-rich dolomite 59
(CaMg(CO3)2) or Mg carbonates like hydromagnesite (Mg5(CO3)4(OH)2·4H2O) and
60
nesquehonite (MgCO3·3H2O) (Fischbeck and Mueller, 1971; Broughton, 1972; Nishiyama et
61
al., 2013). Monohydrocalcite is also formed as a product of biomineralization by certain 62
molluscs (Lowenstam, 1981), flatworms (calcareous corpuscles of Platyhelminthes; Señorale-63
Pose et al., 2008), vertebrates (otoliths; Carlström, 1963), guinea pigs (bladder stones; 64
Skinner et al., 1977) or is even found as a decay product in Saguaro cacti (Garvie, 2003, 65
Page 3 of 41
(Rivadeneyra et al., 2004). However, despite its occurrence in a wide variety of systems little 67
is known about the mechanism and kinetics of its formation pathway. 68
At Earth surface temperatures and pressures, monohydrocalcite is thermodynamically 69
unstable relative to anhydrous calcite and aragonite. In the presence of a Mg-free aqueous 70
fluid it will slowly (>2 days at 100 °C, several days/weeks at ambient temperature) transform 71
to calcite (Stoffers and Fischbeck 1974; Taylor, 1975). Yet, even minor concentrations of 72
aqueous magnesium will lead to its transformation to aragonite over 25 days at ambient 73
temperatures (Brooks et al., 1950; Kamiya et al., 1977; Dahl and Buchardt, 2006; Munemoto 74
and Fukushi, 2008; Fukushi et al., 2011). This effect is believed to be due to the inhibiting 75
effect of Mg2+ on calcite crystallization (Chen et al., 2004; Mucci and Morse, 1983, Davis et 76
al., 2000; Bots et al., 2011). The instability of monohydrocalcite with respect to calcite and 77
aragonite explains the relatively low abundance of this phase within modern environmental 78
systems and the geological record. 79
The mechanism of monohydrocalcite crystallisation in many systems is unknown, but 80
some studies indicate that it can form from an amorphous precursor (Kamiya et al., 1977; 81
Loste et al., 2003; Fukushi et al., 2011; Nishiyama et al., 2013). Such a crystallization 82
pathway has been shown to be common for many Ca-Mg carbonates (e.g., vaterite, aragonite, 83
dolomite; Bots et al., 2012; Blanco et al., 2012; Sand et al., 2012; Rodriguez-84
Blanco et al., 2013; Ihli et al., 2012), and other carbonate and phosphate systems (Roncal-85
Herrero et al., 2009; Roncal-Herrero et al., 2011; Vallina et al., 2013), but this amorphous to 86
crystalline transition is not ubiquitous (Van Driessche et al., 2012). In the carbonate system, 87
these studies have shown that the transformation of the amorphous calcium carbonate (ACC) 88
precursor to stable crystalline phases (i.e., vaterite, dolomite) occurs via a nucleation 89
dominated (spherulitic) growth mechanism. Despite its presence in a variety of natural 90
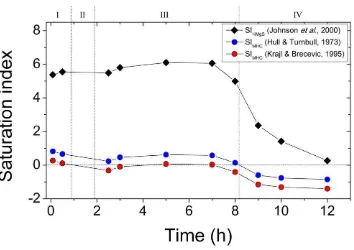
settings and biominerals, a quantitative evaluation of the kinetics and mechanisms of 91
monohydrocalcite formation from an amorphous precursor is lacking. 92
Monohydrocalcite has a hexagonal structure with space group P3112 and an atomic
93
structure consisting of irregular 8-folded Ca-O polyhedra, with a central Ca2+ ion surrounded 94
by carbonate groups and water molecules (Effenberger, 1981; Neumann and Epple, 2007; 95
Swainson, 2008). The presence of the water makes its structure more open and less dense 96
compared to anhydrous CaCO3 (e.g., calcite or aragonite). Interestingly, monohydrocalcite is
97
described as a pure ‗calcium‘ carbonate phase in mineralogical databases, but a number of 98
studies have shown that Mg is ubiquitous in all synthetic and natural monohydrocalcite 99
Page 4 of 41
2007; Nebel et al., 2008; Fukushi et al., 2011; Nishiyama et al., 2013). The Mg content of 101
monohydrocalcite is likely to be linked to the overall fluid chemistry and in particular to the 102
Mg contents of the fluid in which it forms. In both natural and most synthetic 103
monohydrocalcites the presence of high concentrations of Mg relative to Ca in the 104
precipitating solution (Mg2+aq/Ca2+aq ≥ 0.17 < 65) is a prerequisite for its formation (e.g.,
105
Munemoto and Fukushi, 2008; Neumann and Epple, 2007; Last et al., 2010; Kimura and 106
Koga, 2011). Recently, Nishiyama et al (2013) have also shown that the crystallinity and 107
particle size of synthetic monohydrocalcite decrease with Mg content. This clearly shows that 108
Mg is a key component in monohydrocalcite, and must be present in the fluids in which it 109
crystallizes. However, the exact mechanisms by which Mg controls the formation and 110
stability of monohydrocalcite are unknown. 111
This study aims to determine the mechanism of monohydrocalcite crystallisation in 112
solution via an ACC precursor. We evaluate the role of Mg during this process and test the 113
hypothesis that a nucleation-dominated process controls the formation of monohydrocalcite 114
from the Mg-containing precursor ACC. This has been done through a series of experiments 115
where the nucleation and crystallization of monohydrocalcite from Mg doped-ACC was 116
followed in situ and in real time with synchrotron-based X-ray scattering combined with 117
microscopic and wet chemical characterization of the solids and solutions throughout the 118
reaction. Our results demonstrate that the formation of monohydrocalcite takes place via a 4-119
stage process that starts with the precipitation of an Mg-rich ACC precursor. This precursor 120
crystallizes in stage two to monohydrocalcite through a nucleation-controlled dissolution-121
reprecipitation reaction. In stage three Ostwald-ripening dominates, while in stage four, a 122
secondary monohydrocalcite crystallization, also through Ostwald ripening, occurs 123
concomitantly with the loss of some of its structural Mg. We also show that, depending on 124
the aqueous Mg/Ca ratio and supersaturation, monohydrocalcite can accommodate large 125
amounts of Mg in its structure (up to ~25% Ca replaced by Mg) and that the aqueous 126
chemistry of the starting solution controls the crystallite size, unit-cell dimensions and 127
particle size/shape of the forming monohydrocalcite. Based on these findings we discuss the 128
implications of this monohydrocalcite crystallization pathway, on its occurrence in various 129
Page 5 of 41
Experiments were carried out at 21 °C by rapid addition (under constant and vigorous 135
stirring) of a CaCl2/MgCl2 solution (700 mM CaCl2; 300 mM MgCl2; Ca/Mg ratio of 7/3) to
136
a 1000mM Na2CO3 solution to achieve a (Ca+Mg)/CO3 ratio of 1/1. In all cases immediately
137
upon mixing a white gel precipitated. The crystallization of this white gel was followed on-138
line using in situ and time resolved small and wide angle X-ray Scattering (SAXS/WAXS) on 139
beamline I22 (Diamond Light Source Ltd., UK). Solutions were mixed using a stopped-flow 140
apparatus (Bio-Logic, Paris, France) and the resulting white suspensions were continuously 141
circulated with a peristaltic pump through a capillary cell in line with the synchrotron beam. 142
Simultaneous SAXS (RAPID detector; Marchal et al., 2009) and WAXS (HOTWAXS 143
detector; Bateman et al., 2007) patterns were collected over 12 hours at 1 min/frame. The 144
time resolved scattering patterns were detector-response corrected, and background 145
subtracted using a scattering pattern from the starting Na2CO3 solution. Individual WAXS
146
patterns were fit using XFIT (Cheary and Coelho, 1992) and the areas under the Bragg peaks 147
normalized to values from 0 to 1 to express the degree of reactions ( ) as a function of time
148
(Rodriguez-Blanco et al., 2011). Crystallite size was calculated from the Bragg peak full-149
width half-maximum (FWHM) using the Scherrer equation (Scherrer, 1918) and the unit cell 150
parameters were determined with TOPAS (Coelho, 2006), using the Swainson (2008) model 151
for the monohydrocalcite structure. 152
The variations in the scattering peak position in the SAXS patterns were used to 153
derive the changes in the particle sizes of the solids throughout the experiments via the 154
expression: 155
156
d = 2 /q [1]
157 158
where d (nm) is particle diameter and q (nm-1) is the scattering vector (de Moor et al, 1999; 159
de Moor et al, 1999b). These particle size results were also cross-validated by whole SAXS 160
pattern fitting using GNOM (Svergun, 1992). 161
Experiments equivalent to the online SAXS/WAXS experiments (i.e., 1000mM 162
Na2CO3 solution mixed with a 700 mM CaCl2 and 300 mM MgCl2 solution) were performed
163
to follow the reaction process via time-dependent solid characterization and solution 164
analyses. At specific time steps aliquots of the reacting suspension were removed and 165
immediately vacuum filtered (0.2 m polycarbonate membranes). The resulting solids were 166
washed with water and isopropanol following Rodriguez-Blanco et al (2008). An aliquot of 167
Page 6 of 41
solution samples for aqueous Ca and Mg concentrations ([Ca2+aq] and [Mg2+aq]) using ion
169
chromatography (Dionex LC 220) following Bots et al (2011). Throughout all experiments 170
the pH was recorded at a 10 second time resolution using an Orion pH meter and WinWedge 171
v3.4.1 software (TAL technologies) with a precision of 0.001. Finally, the total carbonate 172
concentration in solution was determine by assuming that all Ca and Mg precipitated formed 173
Ca/Mg carbonate, therefore the moles of Ca + Mg removed form solution must equal the total 174
moles of carbonate removed. The total carbonate was then calculated from the difference 175
between the initial concentration and the amount removed at each time point. From these 176
solution data the saturation indexes (SI) with respect to different Ca and Mg-bearing 177
carbonates were calculated using PHREEQC (Parkhurst, 1995) and are presented in Table 1. 178
This was done using the Pitzer activity coefficient models (Pitzer, 1979) and two solubility 179
products, Ksp(MHC), for monohydrocalcite (10-7.60; Hull and Turnbull, 1973) and (10-7.05; Krajl
180
and Brečević, 1995). The saturation index of monohydrocalcite is defined as: 181
[2] 182
183
To determine the effect of initial supersaturation (i.e. saturation index of the aqueous 184
solution for monohydrocalcite immediately after mixing the stock solutions) on the 185
crystallization reaction, experiments were also performed following the same procedure but 186
starting at different initial supersaturations with respect to monohydrocalcite, yet keeping a 187
1/1 (Ca+Mg)/CO3 ratio (Table 2) in all cases. Using the [Ca2+aq] and [Mg2+aq] concentrations
188
obtained from the analyses of the dissolved solids, the molar fraction of MgCO3 in each solid
189
sample, XMgCO3, was calculated following:
190
[3] 191
192
where MMgCO3 and MCaCO3 correspond to the molar concentration of MgCO3 and CaCO3,
193
respectively. 194
195
The mineralogy of the solids from off-line experiments was characterized by powder 196
X-ray diffraction (PXRD) using a Bruker D8 X-ray Diffractometer (CuK 1, 5-90° two theta, 197
SIMHC =log
a
Ca2+×aCO 32
-Ksp(MHC)
c MgCO3 =
MMgCO
3
MMgCO
Page 7 of 41
0.001°/step; 0.1 or 1 sec/step). The PXRD patterns were also used to derive the crystallite 198
size using the Scherrer equation (Scherrer, 1918). All samples were imaged by high-199
resolution transmission electron microscopy (HR-TEM; Philips CM200 field emission gun 200
TEM equipped with a Gatan Imaging Filter, GIF-200 and a Gatan camera for selected area 201
electron diffraction, SAED, pattern collection) or scanning electron microscopy (SEM; LEO 202
1530 Gemini). Finally, the water content of the samples was determined using 203
thermogravimetric analyses (TGA, Mettler Toledo, 25-800 °C in air, 10°C/min). The total 204
water content for the initial white precipitate was calculated from the difference in weight 205
between 25 and 550°C in accordance with the method of Radha et al. (2012) for determining 206
the water content of ACC. For crystalline samples the difference in weight between 100 and 207
550°C was used, in accordance with the method of Hull and Turnbull (1973) for determining 208
the water content of monohydrocalcite. 209
210 211
3. RESULTS AND DISCUSSION 212
213
Our data revealed that over the 12 hours of our experiments monohydrocalcite formed 214
through a multi-stage crystallisation pathway. The first stage of the reaction was 215
characterized by the formation of a Mg-bearing amorphous calcium carbonate phase. In stage 216
two, this amorphous phase crystallised to nanoparticulate monohydrocalcite. The rate of 217
crystallization slowed considerably during stage three, coincident with only minor changes 218
in the solution composition (e.g., pH). Finally, in the fourth stage of the reaction secondary 219
growth of the nanoparticulate monohydrocalcite was observed. This was accompanied by the 220
simultaneous decrease in [Mg2+aq] and the formation of minor amounts of hydromagnesite
221
(Mg5(CO3)4(OH)2·4H2O). Each of these four stages is described in detail below:
222
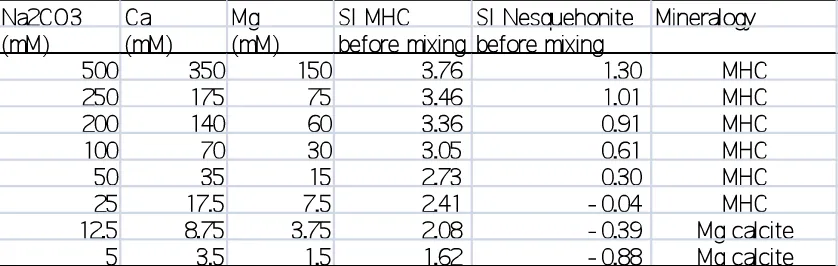
In Stage I of the reaction a white gel precipitated immediately upon solution mixing. 223
The PXRD patterns of this gel (Fig. 1a, lower pattern) showed no Bragg peaks and only three 224
humps located at 2 (=1.54 Å) 17, 31 and 45°, indicating the solid is poorly-ordered. These 225
three broad humps (asterisks in Fig. 1a), are located at the same positions as those observed 226
for Mg-free amorphous calcium carbonate (ACC; Rodriguez-Blanco et al., 2008). Based on 227
the chemical analyses of this amorphous phase (Table 1, 0.83 hour sample) and the TGA 228
results, the formula for this compound was determined to be Ca0.74Mg0.26CO3·1.18H2O. In
229
Page 8 of 41
(Nebel and Epple, 2008; Wang et al., 2009; Rodriguez-Blanco et al., 2012), we will term this 231
poorly-ordered phase, Mg-ACC, following the notation of Günther et al (2005). Throughout 232
this first stage, Mg-ACC was the only solid phase present. In both the on-line and off-line 233
experiments and regardless of conditions, the Mg-ACC started to crystallize after 234
approximately 50 minutes to 1 hour, initiating Stage II. During this stage the background 235
intensity in the PXRD patterns decreased with time, and Bragg peaks for monohydrocalcite 236
formed, grew and sharpened (Fig. 1a). The on-line time resolved WAXS data (Fig. 1b) shows 237
the simultaneous growth of the monohydrocalcite (110), (111), (300) and (301) peaks, after ~ 238
1 hour. The whole reaction is clearly illustrated when the change in area for a specific Bragg 239
peak, expressed as the degree of reactions ( ), is plotted as a function of time (Fig. 2). Stage 240
II of the reaction lasted for about 1 hour and was characterized by the rapid increase in 241
monohydrocalcite peak area. After the fast growth in stage II, a much slower growth phase, 242
between ~ 2 and 8 hours followed (stage III). During this stage, only minor changes in Bragg 243
peak intensities / areas were observed (Fig. 1b and 2). The final stage of the reaction -stage 244
IV- started after about 8.3 hours. During this stage a secondary growth in the 245
monohydrocalcite Bragg peak areas was observed. This growth phase lasted about 2-3 hours 246
and the peak areas reaching a stable maximum after ~ 11 hours. This same evolution was 247
observed for all other monohydrocalcite Bragg peaks. An PXRD examination of off-line 248
experimental solids sampled during stage IV revealed the presence of a second, but minor 249
phase of hydromagnesite (ICDD PDF 01-070-1177; Fig. S1). Quantitative X-ray refinement 250
with TOPAS (Coelho, 2006) determined that its abundance was ~4.5%. The on-line time 251
resolved WAXS patterns (Fig. 3) also revealed small hydromagnesite (110) and (011) Bragg 252
peaks that began to grow at the onset of stage IV, in parallel with the second stage of 253
monohydrocalcite crystallization. 254
Analysis of the SAXS data (Fig. 4) indicates that the Mg-ACC that formed in stage I 255
consisted of particles with a diameter of between 40 and 60 nm in size, a size that remained 256
constant throughout this first stage. This is consistent with particle sizes derived from the 257
TEM imaging of the Mg-ACC particles, which indicted an average diameter of ~ 40 nm 258
(n=100; Fig. 5a; Table 1). However, the Mg-ACC particle diameters varied between 15 and 259
210 nm revealing a high degree of polydispersity. The corresponding SAED patterns revealed 260
only diffuse rings for the Mg-ACC, confirming its poorly-ordered nature (Fig. 5d). During 261
stage II, a distinct scattering peak appeared in the SAXS patterns (arrows in Fig. 4a) 262
indicating that the crystals formed in the experiment were relatively monodispersed. The 263
Page 9 of 41
with time indicting particle growth (Fig. 4a). From the position of this peak and using 265
equation [1] the particle size of the monohydrocalcite crystals was determined (Fig. 4b). At 266
the beginning of stage II, when the first Bragg peaks for monohydrocalcite appeared in the 267
WAXS data (Fig. 1b and Fig. 2), the corresponding SAXS data revealed an average diameter 268
of ~9 nm for the newly forming monohydrocalcite crystals. During the rest of stages II and 269
III these monohydrocalcite nanocrystals grew only slightly and very slowly reaching a 270
maximum diameter of ~15 nm after 8 hours. This same trend in average particles sizes was 271
confirmed (open symbols in Fig. 4b) through selected full pattern evaluation with GNOM 272
(Svergun, 1992). TEM microphotographs of the monohydrocalcite that formed in stage II and 273
persisted throughout stage III (Fig. 5b) revealed that the monohydrocalcite consisted of 274
nanocrystals, which exhibited sub-spherical to slightly elongated morphologies. Their 275
average dimensions were 287 (L) x 205 (W) nm, with the minimum size being around 276
14x10 nm (n=100). The corresponding SAED pattern showed diffraction rings with only 277
poorly developed spots (Fig. 5e), evidencing the presence of very small but crystalline 278
nanocrystals. At the onset of stage IV, and simultaneously with the secondary growth in 279
Bragg peak areas for monohydrocalcite, the SAXS data also revealed a steady increase in the 280
monohydrocalcite nanocrystal diameters, which reached a maximum of ~45 nm at the end of 281
the reaction. Photomicrographs of a sample obtained after 10 hr (stage IV; Fig. 5c) showed 282
euhedral or subhedral single monohydrocalcite crystals with sizes of 7720 (L) x 4710 (W) 283
nm. Again large variations in dimensions were observed, with the largest and smallest 284
crystals being 155x80 and 40x30 nm (n=100). SAED pattern from these crystals exhibited 285
clearly defined spots within the diffraction rings (Fig. 5f). HR-TEM images of the sample 286
taken from the end of stage IV (Fig. 5c, white arrow) revealed the presence of 287
hydromagnesite as a minor phase consisting of ~100x5 nm platy crystals, confirming the 288
WAXS and PXRD observations (Fig. 3 and Fig. S1). 289
Evaluating the corresponding WAXS patterns for the Scherrer crystallite size (Fig. 2) 290
showed a reasonable agreement with the particle size determined from the SAXS and TEM 291
data, and also confirmed that the forming monohydrocalcite crystals were anisotropic. For 292
example, based on the Bragg peak (110) the data reveals that the monohydrocalcite crystals 293
formed during stage II had a crystallite size of ~15 nm, increasing to ~ 20 nm during stage 294
III, which is in agreement with the particle sizes derived from the SAXS and TEM data. Once 295
stage IV of the crystallization was initiated, the monohydrocalcite nanocrystallite size 296
Page 10 of 41
but closer to that derived from the TEM data. However, although this general trend was the 298
same in all other Bragg peaks, the crystallite sizes in all stages were dramatically different 299
between the different Bragg peaks. For example, the final crystallite size from the (141) peak 300
at the end of stage 3 was 16 nm, half that of the (110) peak, and at the end of the reaction it 301
only reached a value of 28 nm (Fig. 2), almost three times smaller than the final crystallite 302
size from the (110) peak, indicating a clear anisotropic growth of the monohydrocalcite 303
nanocrystals. This is consistent with the elongated particle morphology observed by TEM. 304
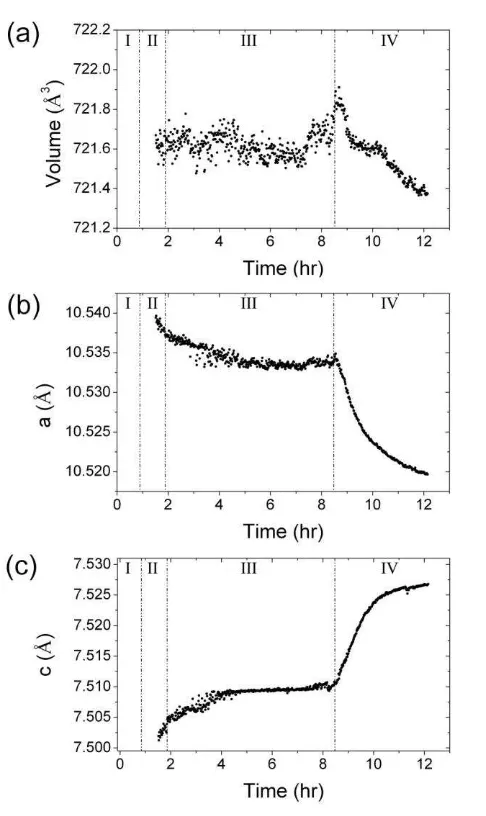
Analysis of the WAXS data also revealed changes in unit cell dimensions during the 305
formation of monohydrocalcite (Fig. 6). Once formed, the unit cell volume (721.6 Å3) 306
remained virtually constant during stages II-III with a slight decrease during stage IV ( V -307
0.2 Å3; Fig. 6a). However, more substantive changes were observed in the a and c axis 308
dimensions (Fig. 6b and c, respectively). Their evolution mirrored each other, with the a-axis 309
decreasing and the c-axis increasing in length ( c = - a 0.02 Å). These changes were small 310
during stages II and III, but became more significant during the secondary monohydrocalcite 311
crystallization (stage IV). 312
The changes in solution and solid phase chemistry during the formation and 313
crystallisation of monohydrocalcite showed a clear link between the evolution of pH, 314
[Ca2+aq], [Mg2+aq] and molar fraction of Mg in the solids (Fig. 7) over the four stage of the
315
reaction. The reaction started with a pH of 11.60 (the pH of the initial Na2CO3 solution),
316
which upon mixing with the Ca/Mg solution rapidly dropped to 9.17. During stage I the pH 317
increased slightly reaching a value of 9.24, while the formation of monohydrocalcite in stage 318
II did not change the pH. In stage III only a small decrease in pH to a value of 9.16 was 319
evident. However, at the end of stage III and during stage IV the pH dropped dramatically to 320
8.65. The [Ca2+aq] was 1.25 mM during stage I and decreased to ≈ 0.6 mM by stage III. It
321
then decreased further reaching a concentration < 0.1 mM at the end of stage IV (Fig. 7). 322
[Mg2+aq] was 28 mM during stages I and II, but increased by ~ 20 % to 35 mM during stage
323
III. During stage IV it decreased by 40% to 13 mM. These changes in [Mg2+aq] were mirrored
324
throughout the whole reaction by the change in MgCO3 in the solids (Fig. 7). Furthermore, the
325
timing of these changes in aqueous composition were all coupled with the increase in 326
monohydrocalcite particle size (Fig. 4 and 5) and formation of hydromagnesite (Fig. 3). 327
From the MgCO3 values and the TGA results, the formula of the stage II
328
monohydrocalcite was derived to be Ca0.74Mg0.26CO3·0.99H2O. However, although the total
329
MgCO3 increased during stage IV (Fig. 7), this does not represent the Mg in monohydrocalcite
Page 11 of 41
but primarily the contribution from the minor (~ 4.5%) hydromagnesite (Mg5(CO3)4(OH)2
331
4H2O). Using the quantitative XRD results and the composition of the final solid obtained
332
from chemical analysis ( MgCO3 = 0.26, Table 1) we calculated that the molar fraction of Mg
333
in monohydrocalcite at the end of stage IV was only ~ 0.065 moles, which is a 75% decrease 334
compared to the Mg content of the stage II monohydrocalcite (0.26 moles). The remaining 335
Mg was transferred into the newly formed hydromagnesite. 336
One last line of evidence that supports the observations above is the evolution of the 337
saturation states during the reaction. PHREEQC modelling of the solution during the reaction 338
showed that immediately after the precipitation of Mg-ACC upon mixing, the aqueous 339
solution was supersaturated with respect to both monohydrocalcite and hydromagnesite (Fig. 340
8) and that the SI for both phases varied little during stages I to III (SIMHC 0.5; SIHMgS 6).
341
The biggest change in both SI occurred at the onset of stage IV, where SIMHC became
342
undersaturated ( -0.85) while SIHMgS dropped to 0.2. This change in SI was concomitant
343
with the removal of Mg from solution and the associated drop in pH, due to the formation of 344
hydromagnesite. There are however, two factors that need to be taken into account when 345
SIMHC is calculated. Firstly, two solubility products for monohydrocalcite are available in the
346
literature: 10-7.60 (Hull and Turnbull, 1973), and 10-7.05 (Krajl and Brečević, 1995) and this 347
results in a ~0.55 difference in the calculated SIMHC (Fig. 8). Secondly, the total ionic strength
348
in our experiments was high (≤1 M) and thus even an error of 1% in the ionic strength of the 349
starting solution could also result in variations up to ~0.5 units in the calculated SIMHC.
350 351 352
3.1. Stability of the precursor Mg-ACC and the mechanism of monohydrocalcite 353
nucleation and growth 354
355
The formation of monohydrocalcite proceeded, in all our experiments, through a 356
poorly-ordered Mg-ACC precursor, which precipitated from solutions with an initial 357
[Ca2+aq]:[Mg2+aq] of 7:3. The resulting phase was considerably more stable (crystallization
358
started at ~50 minutes) compared to pure ACC (no Mg; crystallization started <2 minutes; 359
Ogino et al., 1987; Rodriguez-Blanco et al., 2011; Rodriguez-Blanco et al., 2012, Bots et al., 360
2012), or Mg-ACC formed in a solution with [Ca2+aq]:[Mg2+aq] of 9 to 1 (crystallized to
361
calcite within ~ 14 minutes; Rodriguez-Blanco et al., 2012). However, the Mg-ACC in the 362
Page 12 of 41
calcium was replaced with magnesium (i.e., [Ca2+aq]:[Mg2+aq] = 1:1), which did not
364
crystallize at ambient temperatures even after longer reaction times (>1 day; Rodriguez-365
Blanco et al., 2013). The increasing stability of ACC with increasing Mg contents is not 366
unexpected, and confirms both abiotic (Rodriguez-Blanco et al., 2011; Rodriguez-Blanco et 367
al., 2013; Ajikumar et al., 2005) and biotic (Politi et al,. 2010; Loste et al., 2003; Raz et al., 368
2003) data that demonstrate the importance of Mg in stabilizing amorphous precursors and 369
delaying crystallization. The most likely cause of these effects is the high dehydration energy 370
of the Mg-aquo ion compared to the Ca ion (di Tommaso and de Leeuw, 2010). Hydrated and 371
poorly-ordered ACC is less thermodynamically stable than the dehydrated and more-ordered 372
ACC. This dehydration and local ordering in the amorphous precursor precedes its 373
crystallization (Radha et al., 2010; Bots et al., 2012). Hydrated Mg located within the 374
nanoporous structure of ACC (Goodwin et al., 2010) would retard its dehydration and 375
breakdown, slowing its transformation to crystalline phases. 376
In stage I and prior to the formation of monohydrocalcite, the pH increased by a small 377
amount (0.07 units) (Fig. 7), which likely corresponds to the release of OH- due to the onset 378
of Mg-ACC dissolution. Kojima et al (1993) showed that ACC incorporates minor amounts 379
of OH- ions into its structure when it forms at a basic starting pH. The Mg-ACC in our on-380
line experiment started forming at a pH of 11.5 (the pH of the carbonate starting solution; 381
Fig. 7) and thus minor OH- in our Mg-ACC is not unexpected. Its dissolution would release 382
OH- ions, thus explaining the slight pH increase following: 383
384
Ca(OH)2x(CO3)1-xyH2O Ca1-x(CO3)1-x + Ca2+x, aq + (OH)-2x, aq + yH2O [4]
385 386
The first monohydrocalcite crystals formed during stage II were significantly smaller 387
than the initial Mg-ACC nanoparticles (Fig. 4b), yet once monohydrocalcite started forming, 388
its diameter remained virtually constant throughout stage II and III. Analysis of the WAXS 389
data shows that the amount of monohydrocalcite crystallising increased at a constant rate 390
throughout stage II of the reaction (Fig. 2). However, this increase was not due to particle 391
growth (Fig. 4b) and we suggest that the formation of monohydrocalcite during stage II 392
proceeds via the nucleation of new crystalline solids, i.e., via a nucleation-controlled reaction. 393
The constant rate of monohydrocalcite crystallization with time (i.e., linear increase in the 394
amount of monohydrocalcite) during most of stage II indicates a zeroth order reaction, and a 395
Page 13 of 41
indicating a constant dissolution of Mg-ACC coupled with the constant nucleation of 397
monohydrocalcite. Taking all this into account, we propose that the transformation form Mg-398
ACC to monohydrocalcite occurs via a simultaneous dissolution of Mg-ACC and nucleation 399
of monohydrocalcite at a constant rate. Nucleation controlled growth has been shown for 400
several other crystalline carbonate phases formed from amorphous Ca-Mg carbonates (e.g., 401
vaterite and proto-dolomite; Bots et al., 2012; Rodriguez-Blanco et al., 2013). These studies 402
suggested that the large difference in solubility between the amorphous precursor and the 403
crystalline phases as well as the high supersaturations with respect to all crystalline phases, 404
promotes nucleation. This nucleation process will continue until all of the amorphous 405
precursor has been consumed, leading to a constant nucleation rate. 406
Stage IV of the reaction is key to understanding the effect of Mg on the formation of 407
monohydrocalcite. The SAXS data (Fig. 4b) shows a dramatic increase in particle size. 408
During stage IV, this increase can be fitted to a straight line when plotted as a function of t1/2, 409
indicating a surface-controlled Ostwald-ripening mechanism (Wagner, 1961; Tobler et al., 410
2009). TEM images and both WAXS and PXRD data confirm that larger and better 411
developed monohydrocalcite crystals formed during this stage of the reaction, supporting the 412
Ostwald-ripening mechanism. The photomicrographs of monohydrocalcites from stages III 413
and IV (Fig. 5 b and c) show an unambiguous increase in the nanocrystal sizes and a 414
corresponding change in the SAED patterns from rings with faint spots to discrete spots, 415
indicting an increase in particle size. 416
Ostwald ripening usually occurs during the later stages of crystallisation reactions and 417
involves particle growth without the formation of new material (Wagner, 1961). All 418
nanoparticles formed in stages III are undoubtedly crystalline, but some of them are too small 419
(<10 nm) to produce a significant amount of diffraction. Therefore scattering from these 420
crystal is observed in the background of the PXRD/WAXS patterns during stages II and III 421
(e.g. Fig. 1 after 1 hour of reaction). This behaviour is similar to that observed for ultra-small 422
iron oxides crystallites which are too small to diffract singly (Machala et al., 2007; Ahmed et 423
al., 2010). The intensity of the background in the XRD/WAXS patterns decreased during 424
stages III and IV, while the Bragg peaks increased in intensity and became sharper. These 425
changes in background and Bragg peak intensity are not due to the formation of more 426
monohydrocalcite, but reflect the growth of the monohydrocalcite nanoparticles to a size 427
where they diffract strongly, due to the Ostwald ripening process. The linear fits to the 428
Page 14 of 41
(slopes) for the Ostwald-ripening process during stages III (slow; 1.8±0.1 nm/h1/2) and IV 430
(fast; 66.3±4.3 nm/h1/2). 431
The rapid change in monohydrocalcite ripening rate is coincident with the formation 432
of hydromagnesite; its formation lead to the fast removal of Mg from solution and triggered 433
the rapid increase in monohydrocalcite growth rate. We suggest that structural Mg from 434
monohydrocalcite during the ripening process was released into the solution leading to the 435
observed increase in [Mg2+aq] during stage III (Fig. 7). This ultimately drove the
436
monohydrocalcite composition toward a pure CaCO3·H2O end-member. The high
437
concentration of Mg in solution during stage II suppressed the ripening rate, and produced a 438
feedback effect, which decreased the rate of ripening even more (decrease in the slope of the 439
degree of reaction plot during stage III; Fig. 2). The presence of Mg in solution is known to 440
suppress the dissolution and growth of calcium carbonates (e.g., calcite; Chen et al., 2004; 441
Mucci and Morse, 1983; Davis et al., 2000). Thus, is not unexpected that the high 442
concentration of {Mg2+aq] present during stage III significantly reduced the dissolution and
443
reprecipitation process during the Ostwald ripening. Although the aqueous solution was 444
supersaturated with respect to hydromagnesite throughout the reaction, this progressive 445
increase in [Mg2+aq] eventually triggered the nucleation of hydromagnesite at the end of stage
446
III (Fig. 3). Its formation removed [Mg2+aq] from solution (Fig. 7) and induced a dramatic
447
drop in pH following: 448
449
4Mg2+ + 3HCO3- + 6H2O Mg4(CO3)3(OH)2·4H2O + 5H+ [5]
450
(hydromagnesite) 451
452
The main consequence of this Mg removal from the aqueous solution was an acceleration of 453
the monohydrocalcite ripening reaction, which was translated into a rapid growth in particle 454
size and the formation of highly crystalline low-Mg monohydrocalcite. 455
PHREEQC calculations (Table 1) also revealed that the aqueous solution was in 456
equilibrium or slightly supersaturated with respect to nesquehonite (Mg(HCO3)(OH)·2(H2O))
457
during stages II and II, but became undersaturated in this mineral at stage IV. Nesquehonite 458
was never detected using conventional XRD, synchrotron-based WAXS or HR-TEM 459
imaging. However, Nishiyama et al (2013) suggested that the formation of monohydrocalcite 460
would require the paragenesis of a hydrous Mg-bearing carbonate e.g., nesquehonite, that 461
would transform to hydromagnesite after longer reaction times. Despite the lack of 462
Page 15 of 41
nanocrystalline nesquehonite were present during stages II and III, and that these eventually 464
transformed to hydromagnesite during stage IV. 465
The inhibiting effect of Mg has been described previously for other Ca-Mg carbonates 466
(Bischoff, 1968; Berner, 1975; Reddy and Wang, 1980; Mucci and Morse, 1983; Davis et al., 467
2000). For example, Zhang and Dawe (2000) have suggested that the calcite growth rate is 468
inversely proportional to the Mg concentration in solution. This effect has been attributed to 469
the stronger hydration shell of Mg in comparison to Ca (di Tommaso and de Leeuw, 2010; 470
Moomaw and Maguire, 2008). The higher energy, which Mg needs to dehydrate before 471
incorporating into a carbonate structure controls the kinetics of crystal growth (Mucci and 472
Morse, 1983; Nancollas and Purdie, 1964; De Boer, 1977). Therefore, monohydrocalcite 473
growth would be favoured at lower Mg concentrations. 474
475
3.2. Monohydrocalcite chemical and structural variability 476
477
The molar fraction of Mg in monohydrocalcite ( MgCO3) was ~0.25 during stages II
478
and III (i.e., before the formation of hydromagnesite). This is close to the maximum values in 479
the literature for natural or synthetic monohydrocalcites ( MgCO3= ~0.01-0.34; Brooks et al,
480
1950; Sapozhnikov and Tsvetkov, 1959; Marschner, 1969; Hull and Turnbull, 1973; Taylor, 481
1975; Skinner, 1977; Neumann and Epple, 2007; Nebel et al., 2008; Munemoto and Fukushi, 482
2008; Nishiyama et al., 2013). Many of these studies do not include information about the 483
exact conditions at which monohydrocalcite formed (temperature, solution composition, 484
synthesis method, etc.), therefore the factors controlling MgCO3 in monohydrocalcite are
485
difficult to evaluate. However, we suggest that the high level of Mg in the monohydrocalcite 486
crystallised from Mg-ACC in this study (Fig. 7) is likely due to the high supersaturation of 487
the initial solution with respect to all carbonate phases. 488
To test the effect of supersaturation on the incorporation of Mg into the resulting 489
monohydrocalcite, a set of batch experiments were performed at different initial 490
supersaturations (Table 2). Regardless of supersaturation, immediately after mixing the initial 491
solutions an amorphous precursor formed. Experiments with initial SIMHC>2.43 resulted in
492
the crystallization of monohydrocalcite, while only Mg-calcite was obtained at lower 493
supersaturations (Table 2 and Fig. S2). No other Ca/Mg-bearing phases were observed. 494
PXRD analyses of the monohydrocalcite revealed that its crystallite size was inversely 495
proportional to the starting supersaturation (Table 2), varying between 35 nm at SIMHC = 2.43
496
to 16 nm at SIMHC = 3.89. Furthermore, the MgCO3 of the monohydrocalcite increased with
![Fig. 7. Evolution of the pH, the concentrations of [Ca2+aq], [Mg2+aq] and of the Mg molar](https://thumb-us.123doks.com/thumbv2/123dok_us/7958809.198376/51.595.95.518.70.286/fig-evolution-ph-concentrations-ca-mg-mg-molar.webp)