City, University of London Institutional Repository
Citation
:
Micic, T. (2013). Risk perception vs. risk reality. Paper presented at the 11th International Conference on Structural Safety and Reliability for Integrating Structural Analysis, Risk and Reliability, 16 - 20 June 2013, New York, USA.This is the accepted version of the paper.
This version of the publication may differ from the final published
version.
Permanent repository link:
http://openaccess.city.ac.uk/8001/Link to published version
:
Copyright and reuse:
City Research Online aims to make research
outputs of City, University of London available to a wider audience.
Copyright and Moral Rights remain with the author(s) and/or copyright
holders. URLs from City Research Online may be freely distributed and
linked to.
City Research Online: http://openaccess.city.ac.uk/ [email protected]
1 INTRODUCTION
In recent years the public policy in developed economies is striving to create a risk free society on many levels. This is clearly impossible and very ex-pensive objective when built infrastructure is cerned. Slovic (1998) has pointed out that risk con-troversies (arising between value judgement and technical analysis) require comprehensive approach that includes participation from a large number of interested parties. Once many interested parties are involved the problem of accounting in an objective manner for their priorities and perceptions has to be addressed. With the pressure for adaptation to changing climate, for sustainability and cost effi-ciencies there will be inevitable effects on risk per-ceptions for those participating in infrastructure procurement and the public so developing sound methodologies that can address the relationship be-tween perceived and engineering risk is of interest to us.
Both as a noun or a verb ‘risk’ is one of those frequently used words that can be easily misunder-stood. It is often understood as a measure of the in-dividual’s exposure to danger (without being spe-cific on what the danger in question might be). Engineering risk formulation however is rather ex-plicit and a function of the likelihood of adverse event and its consequences.
Already in 1998 Pidgeon has pointed out to so-cial science research that identifies importance of social, cultural and institutional processes to
peo-ple’s evaluation of risk as well as fundamental value commitments that particular groups identify. He also pointed to differences between ‘public’ and ‘professionals’ in respect to risk assessment criteria have not been addressed in a consistent manner.
It is easy to identify how confusion in under-standing of risk as a concept can arise. As a ‘public’ scenario we consider a simple action such as cross-ing a river bridge that is a standard infrastructure component. A member of the public walking along the banks has several options, not to cross, swim, take a boat, use the bridge, etc. Surely, his decision will depend on environmental factors but it will in-clude risk recognition for each of the options. There might be some intuitive risk quantification in this decision process. Without specific numerical infor-mation the member of the public is making the deci-sion following their perception of risk associated with options and subsequently deciding on the level that is acceptable to them. We really don’t know all parameters that will influence this decision, utility, fear for life, lust, etc. Establishing a mathematical model that can capture this processing of informa-tion on risk would be most beneficial.
On the other hand considering an alternative sce-nario, the engineer who is designing the bridge will also consider risks associated with the structure. He will quantify the risk in respect to certain states that the bridge can take by considering the likelihood of the state being reached and associated conse-quences. This approach is laden with assumptions about quantities but all other considerations that a
RISK PERCEPTION vs. RISK REALITY
T. Micic
City University London, UK
part of the ‘public’ scenario will not feature in the design process.
Here we try to explore if there is a form to estab-lish the functional dependence between the two sce-narios. This is a crucial issue as in developed coun-tries the stakeholders can have diverse priorities (profit, speed of delivery, green agenda, etc.). Fur-thermore, for existing infrastructure that has been in use for some time there are increasing sources of data through monitoring, use of sensors, etc. that lend themselves to quantitative analysis. Finally, the availability of ever more sophisticated analytical tools, enables engineers to generate constantly in-creasing quantitative information. It is difficult to identify if the ‘public’ is accepting this quantitative information.
2 BUILT INFRASTRUCTURE RISK
Built infrastructure could sometimes refer to power supply systems, telecommunication systems but we will only consider, a more traditional, form such as bridges, roads, railways, etc. These infrastructure components (systems in themselves) are often taken for granted by the wider public. It is only when faced with consequences of major disruption caused by rare events such as earthquake, or in UK sudden flooding that questions arise how are we accounting for risks associated with built infrastructure and what are acceptable levels of risk for the public. While rare events attract attention of the public es-tablishing acceptable risk levels in respect to normal operation is not talked about too much but is possi-bly more critical and has greater impact on day-to-day management of infrastructure. In some extreme cases where there is pressure for cost efficiencies there will be inevitable effect on risk that public might become exposed to from the built infrastruc-ture. Significantly when there is the need to consider the effect that future climate scenarios might have on risks associated with infrastructure there is a very strong case to make sure that the true risk is identi-fied.
2.1 Uncertainties associated with existing infrastructure
Many issues that have been identified above are im-plying uncertainty and it is evident that decision making in the near future will require a novel ap-proach that reconciles uncertainty, perceptions, physical models, data availability and technology. Rule based expert systems have been widely im-plemented in many engineering applications to aid decision-making. Unfortunately, they have signifi-cant limitations due to the lack of flexibility in re-spect to evidence introduction and fixed output in-formation. In addition, when a new rule is
introduced careful analysis is needed to establish its effect. A more modern alternative, neural networks, has significant disadvantage that a new network is needed if any new variable is introduced therefore limiting their practical application.
For most existing infrastructure components the uncertainty in available design stage information, data for the interim period such as records of con-struction, inspections, abnormal load processing, etc. will be very high. There also exists a distinct difference in the quality of data for say loading vari-ables such as the traffic volume and composition and infrastructure condition (strength of steel in the bridge girder). Furthermore, decision making has to reconcile that the future exposure conditions are highly uncertain. If we focus on a highway bridge future environmental conditions, maintenance and repair schedules will be highly uncertain. The cur-rent practice is often to account for uncertainty us-ing standard probabilistic analysis to establish quan-titative measure of likelihood of certain limit states. Then the engineering risk is evaluated as a function of this likelihood and the consequence of the limit state. An easy to understand consequence is loss of life but not all critical conditions are associated with loss of life and acceptability of consequences is evi-dently more complex problem where public percep-tion of risk needs to be accounted for.
2.2 Engineering risk evaluation
If we consider traditional infrastructure the uncer-tainty has to be addressed on many levels, such as accuracy of behaviour models, physical variability, life cycle influences, etc. In particular, when the en-gineering risk is evaluated it still remains to be es-tablished what is an acceptable risk to different stakeholders that are associated with infrastructure. For built infrastructure when engineers refer to per-formance they often think of the ultimate and ser-viceability limit states as the expected target per-formance. However, the risk levels associated with these limit states are notional due to the nature of probabilistic analysis and variety of consequences that can arise from limit state realization. There is no significant evidence of consistent drive to estab-lish the acceptable risk levels, considering funda-mentally different nature of limit states. For exam-ple it is likely that the ultimate limit state would be associated with likelihood of fatality as opposed to the serviceability limit states that are far less critical in terms of fatality but more visible due to discom-fort.
the same manner public regulatory bodies, such as UK’s Health and Safety Executive have imple-mented ALARP principles across industries irre-spective to the experience that they are more suitable for process industries. Recent revisions to the Flood and Water Management Act 2010 has altered tradi-tional approach to embankment dam assessment so that the driving principle has become that the fail-ures are low probability high consequence events and therefore the risk associated with their failure is entirely the function of consequences. Inevitably, as a result of such simplified approach while on one hand fatalities are unlikely to occur through failure of such infrastructure, significant costs can arise due to disruption of services, flooding, loss of transport links, etc.
It is difficult to find evidence that acceptable en-gineering risk levels have been co-ordinated be-tween professionals or modified to account for pub-lic perception. Due to diversity of built infrastructure components decision making in the near future will require a more comprehensive approach that recon-ciles uncertainty, physical models, data availability and technology and expected target performance. In addition, when the government is seeking to transfer responsibility as has been the case in Public-private-partnership contracts those who take it on board would need to have in place sensible target perform-ance. This is highly relevant for built infrastructure where stakeholders are a particularly diverse group. Engineers have, so far, not engaged with the field preferring to rely on quantification despite reality that all quantities are only notional.
3 RISK PERCEPTION
Risk perception can be seen as a generic term but we will accept that it relates to individual’s beliefs, attitudes, judgements and feelings in addition to their cultural and social disposition, Schwartz (1992). It has been recognized for some time in psy-chological research that risk perception is a complex phenomena and different techniques have been es-tablished to identify main drivers when risk percep-tion is concerned. For us it is of interest to apply a technique that can capture the risk perceptions from different stakeholders within the construction proc-esses. It is only recently that there have been at-tempts to address the effect that intuitive judgement, attitudes towards natural disasters and man made ones can have on risk perception, Nordensted & Ivanisevic (2010).
3.1 Motivational Values
Long established research, Schwartz (1992) has shown in the past that demographic variables (gen-der, age, etc.) as well as educational background are
reflected in motivational values and could have some influence on risk perceptions. If we follow more recent evidence from Nordenstedt & Ivanis-evic, (2010) we can further accept that motiva-tional values (benevolence, universalism, self-direction, stimulation, hedonism, achievement, power, security, conformity and tradition) are useful for estimates of risk perception as they transcend demographic boundaries.
Relatively simple and widely accepted approach to evaluation of motivational values can be carried out using Schwartz Portrait Value Questionnaire. There are several forms of this questionnaire but here the 40 question format is implemented as the respondents tend to engage irrespective of their background. The questions are of the form that re-quires the respondents to express how much they are like a fictitious person. For each of the motiva-tional values there are from 3 to 5 questions ar-ranged in a random order to avoid the inertia in re-sponses. Thus for the question:
“He thinks it is important that every person in the world be treated equally. He believes everyone should have equal opportunities in life”
one is offered a question:
How much like you is this person?
and respondents have an option to select one of 6 levels of agreement from:
Not like me at all up to Very much like me
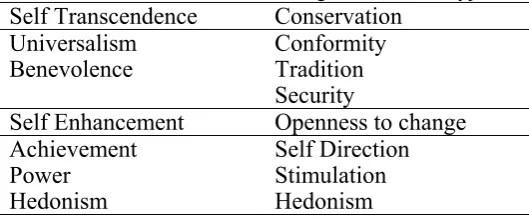
[image:4.595.303.568.592.701.2]Motivational values can be considered using al-ternative formats and a usual approach is to identify 4 higher order value types as defined in Table 1.
Table 1 Motivational values and higher order value types
Self Transcendence Conservation Universalism
Benevolence ConformityTradition Security
Self Enhancement Openness to change Achievement
Power Hedonism
Self Direction Stimulation Hedonism
have been considered students responses had signifi-cant similarity with other historic survey results for students and that there was little difference between responses of white collar and manual workers. They also report on motivational values contribution to Self-transcendence in particular. The implication of these findings is that Schwartz Portrait Value Ques-tionnaires do represent a viable tool to establish mo-tivational values for the case of diverse stakeholder groups as we have in construction procurement.
3.2 Psychometric paradigm
It has been a widely used practice to implement a form of questionnaire that asks individuals to rate a number of hazards in order to establish risk percep-tions. Furthermore, there has been evidence that di-mensions of ‘dread’ and ‘unknown’ most signifi-cantly affect the perception of risk. To capture the risk perception between several countries for exam-ple, Nordensted & Ivanisevic (2010) implemented a 20 questions format, 10 for each dimension of ‘dread’ and ‘unknown’ respectively. Sample haz-ards implemented by Nordensted & Ivanisevic (2010) were AIDS, drinking alcohol, climate change, terrorism, fire in the home, motor vehicles, commercial airplanes, cancer, nuclear power plants and stress. The analysis by Nordensted & Ivanis-evic (2010) provides evidence that the link between motivational values and risk perceptions is in evi-dence and that it can lend itself to further improve-ment in understanding risk perceptions for diverse groups. This is seen as a rather appealing feature for consideration of risk perceptions within construction industry.
4 METHOD APPLICATION FOR SAMPLE
STAKEHOLDER GROUP
For example we have considered a small sample group that represents stakeholders in the civil engi-neering procurement, graduate civil engineers. The aim is to capture stakeholder’s motivational values and subsequently risk perceptions. As our sample included different demographics with comparable educational base, we are able to identify relative importance between motivational values and relate our findings to earlier studies such as the one by Koivula & Verkasalo (2006).
Starting with the implementation of the 40 ques-tions Schwartz Portrait Value Questionnaire to iden-tify expressed motivational values using a sample of 36 participants that represent a distinct group of stakeholders. From the analysis of questionnaire outcomes we have confirmed that the profile in terms of motivational values is close to the previous
study carried out by Koivoula & Verkasalo (2006). In particular, as we have considered a group of indi-viduals who share several demographic characteris-tics we have found that:
The highest number of respondents identified with traits associated with universalism. Thus, universalism can be identified as the most im-portant motivational value for this stakeholder group.
Power was not identified as highly relevant mo-tivational value for our group.
However considering the cumulative, higher moti-vational value, self-transcendence was clearly estab-lished as dominant, in a sense that it is the strongest driver for the group. This is in line with our expec-tations.
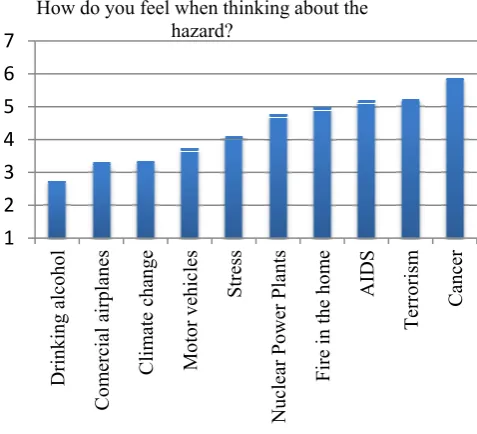
The psychometric paradigm is implemented ask-ing individuals to rate hazards to explain the risk perception. Following Nordensted & Ivanisevic (2010) two dimensions are considered, dread and unknown and 10 hazards identified as above. The respondents were asked to rate their fear (dread) within 7-point scale from ‘no fear’ to ‘very great fear’ (fear is sometimes considered as more accept-able form of words).
[image:5.595.320.559.478.695.2]Sample outcome of our survey is provided in Ta-ble 2. As we are dealing with a homogenous group with a distinct higher order motivational value self-transcendence so the processing is limited and out-comes are simply scored between 1 and 7.
Figure 1 Sample outcome of the risk perception survey for the stakeholder group
We have selected a couple of relevant risks that could be of interest to construction industry to fol-low the relationship between the ‘fear’ and ‘un-known’. Sample outcomes are presented in Table 2.
1 2 3 4 5 6 7
Dri
nki
ng al
cohol
Co
m
ercial airp
lan
es
Clim
ate change
M
ot
or vehi
cl
es
Stress
Nuclear Power
Plants
Fire in
th
e
ho
m
e
AIDS
Terrorism Cancer
It is possible to identify that climate change is asso-ciated with less fear despite lesser ‘knowledge’ about the hazard then for nuclear power plants. For general sample with more diverse demographics, considered across several nations and shown in Nordensted & Ivanisevic, (2010), differentials be-tween the two hazards perceptions were more pro-nounced. This can have implications both in design and assessment when decisions are made on signifi-cant limit states. Furthermore if decisions are being made in respect to future climate scenarios per-ceived risks should indicate particular consideration of the effects of the projected climate change that need to be addressed.
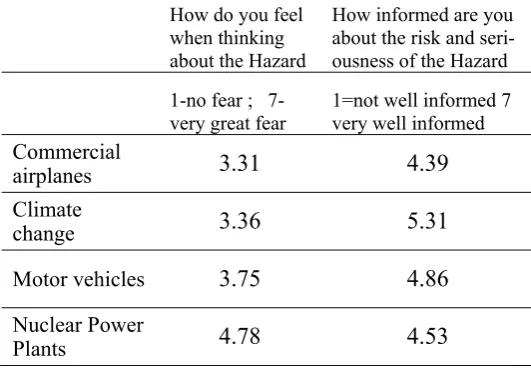
Table 2 Sample scores from risk perception survey How do you feel
when thinking about the Hazard
How informed are you about the risk and seri-ousness of the Hazard 1-no fear ;
7-very great fear 1=not well informed 7 very well informed
Commercial
airplanes 3.31 4.39
Climate
change 3.36 5.31
Motor vehicles 3.75 4.86
Nuclear Power
Plants 4.78 4.53
The sample group identified nuclear power plants as representing significantly higher fear (dread) then climate change, motor vehicles or commercial aero-planes but also revealing that their understanding of risks associated with climate change is much higher then about nuclear power plants. For a group of spe-cialists stakeholders this is surprizing, as they would have been familiar with the concept of safety factors and possibly have some knowledge about specific safety factors implemented for different types of structures. Intuitively one would expect that the group is aware of high levels of uncertainty associ-ated with climate scenarios and the very cautious approach to design and operation of nuclear power plants. These contradictions are a signal that inves-tigating risk perceptions for distinct stakeholder groups would be very beneficial. It is possible that, as a consequence, the infrastructure target risk lev-els in design, construction and in service will inevi-tably have to be reviewed and in particular the communication to wider public about them would need to be more sophisticated. This very much con-firms what Pidgeon (1998) indicated a while ago.
Furthermore, we consider for us of most interest nuclear power plants and climate change and relate those two hazards to familiar and well used trans-portation means, i.e. commercial airplanes and
mo-tor vehicles. What is striking is that for constrained sample such as ours there is no visible functional dependence between how well informed the indi-vidual is and their fear associated with the hazard. Some other fundamental information processing is in place here. It might be the utility that modifies one’s perception of risk. In our case there is no evi-dence that knowledge about the hazard is only im-portant parameter.
4.1 Regulator’s view
The relevance of our enquiry is most significant for those trying to regulate processes integral to delivery of built infrastructure. Complexities of stakeholders approach to risk have always been evident but here they are in some limited way quantified, however when regulation is applied in form of codes etc. regulators aim to erase the risk or at least reduce it to a very low level. On one hand that is a positive aim but, in reality and on evidence presented here, an impossible not to mention very expensive endeav-our.
We can relate regulatory situations and chal-lenges to the already mentioned revised Flood and Water Management Act 2010 to demonstrate the need for explicit approach to definition of accept-able risk. As a consequence of the Act a rather large number of very old structures with mostly sparse re-cords about their condition, maintenance etc. will need to be assessed in terms of risk that they pose to the vicinity. It has been demonstrated by Preziosi & Micic (2012) that if in addition to current status, fu-ture climate scenarios are considered relatively harmless weather events could increase significantly the engineering risk associated with small homoge-nous embankment dams Simply including the in-crease in notional likelihood of failure will affect the engineering risk. However, there is at present no guidance on establishing site specific relevant ac-ceptable engineering risk levels. If there is no dif-ferentiation between sites and modes of failure strictly defined probabilities of limit states occurring could mean enormous programme of strengthening that is most likely unnecessary.
5 FURTHER DEVELOPMENTS
It is inevitable that only through further development this cross-discipline approach can bring significant benefits.
The methodology in place, mainly Schwartz Por-trait Value Questionnaire and psychometric ex-periment should be applied to establish motiva-tional values and perceptions of risk for further relevant stakeholder groups.
acceptabil-ity of risk. We might find that motivational val-ues have a major role in establishing the latter.
Investigate further quantitative measure that would reflect the risk perception but also quanti-fied engineering risk in regulatory documenta-tion such as recommendadocumenta-tions for code devel-opment.
The major breakthrough from furthering this re-search would be in identifying the methodology that will enable delivery of structures that are less expen-sive with risk levels proportional to the purpose rather then arbitrary, historical, levels. Subsequently, significant improvements in consistency and effi-ciency in infrastructure procurement can be expected through application of updated regulatory instru-ments. The main issue remains to find appropriate forms of mapping between quantitative and descrip-tive outcomes. While for a small scale problem (such as homogenous earthfill embankment dam) this might appear feasible to achieve for diverse sys-tems such built infrastructure this will represent an area where significant contributions are expected.
For existing infrastructure, owners often pursue a predetermined sequence of well defined inspection, maintenance and repair activities. However, there is increasing evidence that such processes are ineffi-cient and new management strategies for changing priorities in respect to the infrastructure could emerge on the basis of the current work.
6 CONCLUSIONS
We have ventured away from standard engineering practice and implement alternative methodology that integrates psychology associated with risk percep-tion. The motivational values for sample group of construction associated stakeholders were estab-lished using 40 question Schwartz Portrait Value Questionnaire (PVQ). The risk perceptions were es-tablished using conventional survey method where 10 hazards were considered. While limited in scale our current work has confirmed that:
It is possible to rank the fear in respect to diverse hazards using proposed methodology.
Risk perceptions of specific stakeholder group can be identified.
Differences in risk perceptions between stake-holder groups could be identified.
Even for low probability events such as failure of nuclear power plant it is possible to identify the scale of risk perception of the specific stake-holder group.
By considering multiple stakeholder groups it will be possible to identify if risk perception dif-ferentiation is present.
It has been identified that availability of quanti-tative measure for risk perception infrastructure
related processes such as design, assessment, in-spection, could be reviewed.
Ultimately an explicit methodology to establish site specific performance requirements that re-flect the expectations of stakeholders might be feasible.
Despite the limited scale of the surveys it is iden-tified that there could be the case that the approach to risk in general in construction industry is some-times too conservative and as a consequence too ex-pensive and not sustainable If the approach to risk perception characterization is implemented across different disciplines design and, by extension, as-sessment can be significantly less conservative. We expect that as a result of this research structures would be safe and fit for purpose.
7 REFERENCES:
Koivula, N & M. Verkasalo; 2006; Value structure among stu-dents and steelworkers; Journal of applied Social Psychol-ogy, Vol 36, 5, pp. 1263-1273
Nordenstedt, H. and J. Ivanisevic; 2010, Values in risk tion-Studying relationship between values and risk percep-tion in three countries; J. of Disaster Risk Studies, Vol. 3, No.1.; pp. 335-345.
Pidgeon, N.; 1998, Risk assessment, risk values and the social science programme: why do we need risk perception re-search; Reliability Engineering. and System Safety; Vol. 59, pp. 5-15.
Preziosi, M-C. & Micic, T. 2012. Methodology for the prob-abilistic assessment of embankment dams for predicted climate scenarios. In: Proceedings of the Institute of Civil
Engineers: Geotechnical Engineering, Issue GE3, 165(3):
179-193.
Schwartz, S.H; Universals in the Content Snd structure of Val-ues: Theoretical Advances and Empirical Tests in 20 Coun-tries; Advances in Experimental Social Psychology, Vol.25; pp. 1-65.
Slovic, P.; 1998, The risk game; Reliability Engineering and System Safety; Vol. 59, pp. 73-77.