1 Validation of thigh-based accelerometer estimates of postural allocation in 5-12 year-olds
1
Christiana M.T. van Loo (corresponding author)
2Early Start Research Institute, Faculty of Social Sciences, University of Wollongong,
3Australia
4[email protected]
56
Anthony D. Okely
7Early Start Research Institute, Faculty of Social Sciences, University of Wollongong,
8Australia
9[email protected]
1011
Marijka J. Batterham
12School of Mathematics and Applied Statistics, University of Wollongong, Australia
13[email protected]
14
15
Trina Hinkley
16Deakin University, Geelong, Australia, Institute for Physical Activity and Nutrition (IPAN),
17School of Exercise and Nutrition Sciences
182 20
Ulf Ekelund
1,221
1
Norwegian School of Sports Sciences, Norway
222
MRC Epidemiology Unit, University of Cambridge, United Kingdom
23[email protected]
24
25
Søren Brage
26MRC Epidemiology Unit, University of Cambridge, United Kingdom
27[email protected]
2829
John J. Reilly
30University of Strathclyde,
School of Psychological Sciences and Health,
Scotland
31[email protected]
3233
Rachel Jones
34Early Start Research Institute, Faculty of Social Sciences, University of Wollongong,
35Australia
36[email protected]
373
Xanne Janssen
39
University of Strathclyde,
School of Psychological Sciences and Health,
Scotland
40[email protected]
41
42
Dylan P. Cliff
43Early Start Research Institute, Faculty of Social Sciences, University of Wollongong,
44Australia
45[email protected]
4647
4 Abstract
49
Objectives: To validate activPAL3TM (AP3) for classifying postural allocation, estimating time spent in
50
postures and examining the number of breaks in sedentary behaviour (SB) in 5-12 year-olds. 51
Design: Laboratory-based validation study. 52
Methods: Fifty-seven children completed 15 sedentary, light- and moderate-to-vigorous intensity 53
activities. Direct observation (DO) was used as the criterion measure. The accuracy of AP3 was 54
examined using a confusion matrix, equivalence testing, Bland-Altman procedures and a paired t-test 55
for 5-8y and 9-12y. 56
Results: Sensitivity of AP3 was 86.8%, 82.5% and 85.3% for sitting/lying, standing, and stepping, 57
respectively, in 5-8y and 95.3%, 81.5% and 85.1%, respectively, in 9-12y. Time estimates of AP3 were 58
equivalent to DO for sitting/lying in 9-12y and stepping in all ages, but not for sitting/lying in 5-12y 59
and standing in all ages. Underestimation of sitting/lying time was smaller in 9-12y (1.4%, limits of 60
agreement [LoA]: -13.8-11.1%) compared to 5-8y (12.6%, LoA: -39.8-14.7%). Underestimation for 61
stepping time was small (5-8y: 6.5%, LoA: -18.3-5.3%; 9-12y: 7.6%, LoA: -16.8-1.6%). Considerable 62
overestimation was found for standing (5-8y: 36.8%, LoA: -16.3-89.8%; 9-12y: 19.3%, LoA: -1.6-63
36.9%). SB breaks were significantly overestimated (5-8y: 53.2%, 9-12y: 28.3%, p<0.001). 64
Conclusions: AP3 showed acceptable accuracy for classifying postures, however estimates of time 65
spent standing were consistently overestimated and individual error was considerable. Estimates of 66
sitting/lying were more accurate for 9-12y. Stepping time was accurately estimated for all ages. SB 67
breaks were significantly overestimated, although the absolute difference was larger in 5-8y. 68
Surveillance applications of AP3 would be acceptable, however, individual level applications might be 69
less accurate. 70
71
5 Sedentary behaviour, physical activity, child, accelerometry, activpal, breaks
6 Introduction
74
High levels of sedentary behaviours (SB) and prolonged bouts of SB are negatively associated 75
with health outcomes in adults,1,2 independent of the amount of time engaged in moderate-to-vigorous
76
intensity physical activity (MVPA).3 Frequent interruptions in sedentary time could reduce this risk.4,5
77
Although some studies among children and adolescents6-8 suggest that the total volume or pattern of SB
78
is associated with adverse health outcomes, overall, the evidence among young age groups is 79
inconsistent.9-11 The accurate measurement of SB in observational and experimental research in children
80
is essential to better understand the potential influence of SB on health outcomes. 81
Assessing subtle differences between SB and light-intensity physical activity (LPA) using 82
traditional hip-mounted accelerometers and cut-point methodologies seems to be difficult, because 83
these methods categorise SB based on the lack of movement,12 and some LPAs such as standing tend
84
to be misclassified as SB.13,14 Activity monitors or data reduction approaches that are sensitive to
85
changes in posture offer potential for improved measurement of SB and LPA. An example is the 86
activPAL3TM (AP3; PAL Technology Ltd., Glasgow, Scotland), an activity monitor worn on the thigh
87
that uses triaxial acceleration data (20Hz) to assess the position and movement of the limb. The AP3 88
software uses proprietary algorithms to classify periods spent sitting/lying, standing or stepping. Before 89
being used in observational and experimental studies in children, it is important to determine if the 90
device accurately detects postures and precisely estimates time spent sedentary and non-sedentary. 91
Furthermore, it is important to evaluate the device’s accuracy to detect breaks in SB in order to 92
understand their influence on health outcomes. 93
The uni-axial activPALTM (AP1) has been validated in young children (3-6y),15-17 but to our
94
knowledge only one study has evaluated AP1 in school-aged children.18 Aminian et al.18 included 25
95
participants aged 9-10y who performed 4 sedentary and 7 ambulatory activities, plus a selection of 3 96
activity patterns including sit-to-stand and stand-to-sit transitions to simulate real-world conditions. 97
High correlations were found between direct observation (DO) and time spent in different postures and 98
7 determine the relative strength of the relationship between measurement outcomes and do not provide 100
information about potential systematic differences or the agreement between estimates.19,20 Data on the
101
measurement agreement or potential systematic bias of the monitor was only reported in 4-6y.16 No
102
studies have investigated whether potential measurement errors of the monitor lie within a clinically 103
acceptable range. This study aimed to examine the classification accuracy and validity of AP3 for 104
estimating sitting/lying, standing and stepping time and the number of SB breaks in 5-12 year-old 105 children. 106 107 Methods 108
Fifty-seven children (5-12y) who were without physical or health conditions that would affect 109
participation in physical activity were recruited. The study was approved by the University of 110
Wollongong Health and Medical Human Research Ethics Committee. Parental written consent and 111
participant verbal assent were obtained prior to participation. 112
Participants were required to visit the laboratory on two occasions. Anthropometric measures 113
were completed using standardized procedures after which BMI (kg/m2) and weight status were
114
calculated.21 Children completed a protocol of 15 semi-structured activities (Supplementary Table 1)
115
from sedentary (e.g. TV viewing, writing/colouring), light (e.g. slow walk, dancing), and moderate-to-116
vigorous (e.g. soccer, running) intensity. Activities were equally divided over 2 visits and completed in 117
a structured order of increasing intensity for 5 min, except for lying down (10 min). 118
The single unit accelerometer AP3 (53 x 35 x 7mm, 15.0g) was placed mid-anteriorly on the 119
right thigh and initialised with minimum sitting or upright period of 1s. Event records created by the 120
AP3 software were used to classify periods spent sitting/lying, standing or stepping and transitions from 121
sit/lie to upright (breaks in SB). 122
DO was used as the criterion measure. Children were recorded on video completing the 123
activities as well as during transitions between activities. A single observer coded all videos using 124
8 posture was coded. Subsequently, a second-by-second classification system was generated using 126
customised software, in order to synchronise DO data with AP3’s 1s epochs. Every second following 127
the time stamp inserted by the observer was classified the same as the posture occurring at the time 128
stamp itself until the next time stamp was created, indicating that the child’s posture had changed. 129
Postures were coded as sitting/lying (gluteus muscles resting on ground, feet, legs or any other surface, 130
or lying in prone position), standing (both feet touching the ground), “other standing” (e.g. squatting, 131
standing on one foot, kneeling on one or two knees), stepping (moving one leg in front of the other, 132
including stepping with a flight phase), “other active” (e.g. jumping, sliding/side gallop) and “off 133
screen” for DO. Seconds coded as “other standing” were recoded as standing, because these postures 134
required the engagement of large postural muscles and did not involve the gluteus muscles resting on 135
any surface. Seconds coded as “other active” were recoded as stepping. In the event of two postures 136
occurring within the same second in either DO or AP3 data, this second was duplicated at the 137
corresponding time point for the AP3 or DO output, in order to evaluate classification accuracy. This 138
method was in line with previous validation studies.15,16 For estimated time spent in postures, codes of
139
duplicated seconds for either DO (0.02% of total DO data) or AP3 (0.04% of total AP3 data) were 140
assigned 0.5 sec to avoid artificially inflating the total time observed. The synchronised DO and AP3 141
epochs were excluded when DO was coded as “off screen”, which occasionally occurred when moving 142
between different locations during transitions. Videos of 5 randomly selected participants were analysed 143
twice by the same observer and once by a criterion observer to test inter- and intra-observer reliability. 144
Inter- and intra-observer reliability was examined using Cohen’s Kappa and single measure intra-class 145
correlation coefficients (ICC) from two-way mixed effect models (fixed-effects = observer; random 146
effects = participants), using the consistency definition. Cohen’s Kappa coefficient for inter-observer 147
reliability was 0.941. Inter-observer ICC was 0.974 (0.974 - 0.974) and intra-observer ICC was 0.963 148
(0.962 - 0.963). 149
Prior to analyses, participants were divided into two age groups (5-8y and 9-12y) because 150
younger and older children potentially engage in and move between sitting, standing and non-standard 151
postures differently.16,22 Normality of the data was confirmed and analyses were performed for each
9 group. The accuracy of AP3 for classifying sitting/lying, standing and stepping was established using 153
sensitivity (true positive rate) and specificity (true negative rate), and summarised using a confusion 154
matrix.23 The equivalence of time estimates between AP3 and DO for each posture was examined at the
155
group level using the 95% equivalence test. The methods are equivalent if the 90% confidence interval 156
(CI) of time estimated by AP3 entirely falls within the predefined equivalence region of ±10% of the 157
average time coded by DO.24,25 Measurement agreement and systematic bias for estimated time spent
158
in postures were evaluated at the individual level using Bland-Altman procedures.20 Pearson
159
correlations were used to evaluate the ability of AP3 to estimate the relative number of SB breaks 160
compared to DO. The difference between the absolute number of SB breaks was tested using a paired 161
sample t-test. Analyses were performed using the statistical computing language R v.3.1.2 and SPSS 162 v.19.0. 163 164 Results 165
Descriptive characteristics of participants are presented in Supplementary Table 2. All 166
participants completed the protocol and had valid AP3 data. Videos from one of the visits were 167
unavailable for 3 children (age 5, 9 and 10y). Out of the remaining 267,952 1s epochs of DO from 5-168
8y and 345,226 epochs from 9-12y, 27,493 epochs and 25,042 epochs were coded as “off screen” and 169
excluded from analyses, respectively, leaving 240,459 (89.7%) valid epochs for 5-8y and 320,184 170
(92.7%) for 9-12y. Mean DO time for 5-8y was 167.0 ± 22.4min, of which 77.8 ± 12.0min was classified 171
as sitting/lying, 26.9 ± 8.6min as standing and 62.2 ± 9.3min as stepping. Mean DO time for 9-12y was 172
161.8 ± 26.1min, of which 73.0 ± 14.3min, 26.3 ± 8.7min and 62.5 ± 10.5min were classified as 173
sitting/lying, standing and stepping, respectively. 174
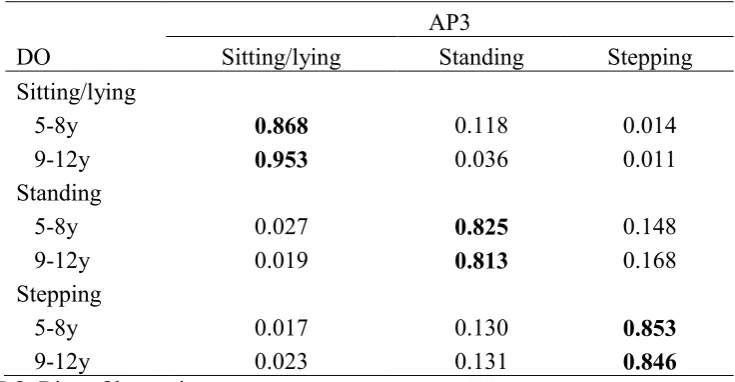
The sensitivity and misclassifications for AP3 are presented in Table 1. Sensitivity of 86.8%, 175
82.5% and 85.3% in 5-8y was acceptable for sitting/lying, standing and stepping, respectively. In 9-176
12y, sensitivity of 95.3% was excellent for sitting/lying and sensitivity of 81.5% and 85.1% was 177
10 sitting/lying, standing and stepping in 5-8y, respectively, and 97.8%, 92.0% and 94.7% in 9-12y, 179
respectively. Sitting/lying was misclassified as standing for 11.8% of the time in 5-8y, whereas this was 180
only 3.6% in 9-12y. 14.8% and 16.8% of standing was misclassified as stepping for 5-8y and 9-12y, 181
respectively. Furthermore, 13.0% and 13.1% of stepping was misclassified as standing for 5-8y and 9-182
12y, respectively. 183
At the group level (Figure 1), estimates of AP3 were equivalent to DO for sitting/lying time in 184
9-12y (p<0.001) and stepping time in both age groups (5-8y, p=0.004; 9-12y, p=0.001). Estimated 185
sitting/lying time in 5-8y and standing time in both age groups were not equivalent to DO (p>0.05). 186
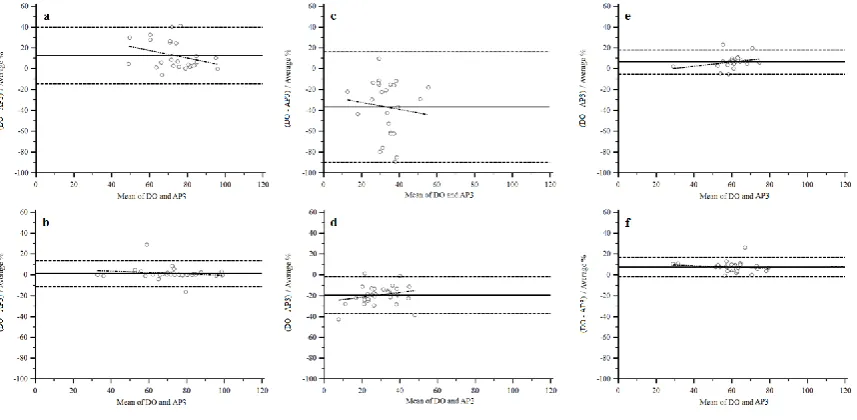
Bland-Altman procedures (Figure 2) demonstrated underestimation for sitting/lying time in both age 187
groups. The mean difference in 5-8y was 12.6% (limits of agreement [LoA]: -39.8-14.7%), however 188
the difference and LoA in 9-12y were considerably smaller (1.4%, LoA: -13.8-11.1%). Stepping time 189
was underestimated in both age groups (5-8y, mean difference: 6.5%, LoA: -18.3-5.3%; 9-12y, mean 190
difference: 7.6%, LoA: -16.8-1.6%), whereas the overestimation for standing time was considerably 191
larger (5-8y, mean difference: 36.8%, LoA: -16.3-89.8%; 9-12y, mean difference: 19.3%, LoA: -1.6-192
36.9%). At the individual level, LoAs were notably wider for sitting/lying and standing time in 5-8y, 193
whereas LoA for stepping time was similar for both age groups. No systematic bias was found for the 194
postures (p>0.05). Although the correlation of the number of SB breaks detected by AP3 was significant 195
(5-8y, Pearson’s r=0.73, p<0.001; 9-12y, Pearson’s r=0.81, p<0.001), the absolute number of breaks 196
was overestimated for both age groups, but more so for 5-8y (AP3: 24.2±8.6, DO: 15.8±4.6, p<0.001) 197
than 9-12y (AP3: 15.4±5.1, DO: 12.0±3.4, p<0.001). 198
199
Discussion 200
AP3 demonstrated acceptable sensitivity and specificity for classifying postures in both age 201
groups. Time spent sitting/lying and stepping was slightly underestimated in 5-8y (~6-13%) and 9-12y 202
(~2-8%), however measurement errors lay within a conventional range of ±10% of the criterion for 203
11 in both younger (36.8%) and older (19.2%) children and was not equivalent to DO. At the individual 205
level, wide LoA was found for sitting/lying time and very wide LoA for standing time in 5-8y. Less 206
individual variability was found for sitting/lying time in 9-12y, however the LoA for standing in this 207
age group was also considerably wide. The absolute number of breaks in SB was statistically 208
overestimated by AP3, although the difference for 9-12y (28.3%) was smaller than for 5-8y (53.2%). A 209
significant correlation was present between breaks detected by AP3 and DO in both age groups. 210
Aminian et al.18 reported a perfect correlation (r=1.00) between AP1 and DO for time spent
211
sitting/lying, standing and walking including activity patterns, and a high correlation for transition 212
counts (r=0.99). However, no information was presented on potential measurement errors and/or 213
systematic bias. Although the accurate assessment of postural allocation in our study was in line with 214
the high correlation between AP1 and DO in the previous study, AP3 estimated time spent standing less 215
accurately and the individual-level error for time spent sitting/lying in 5-8y and standing in both age 216
groups was substantial. 217
Compared to previous studies that tested AP1 in preschoolers, the sensitivity of AP3 for 218
sitting/lying was similar to Janssen et al.16 (87.6%) in 5-8y (86.8%), and similar to Davies et al.15
219
(92.8%) in 9-12y (95.3%). However, sitting/lying in our sample was classified more accurately in both 220
age groups compared to SB (sensitivity: 53.8%) reported by De Decker et al.17 Sensitivity of AP3 for
221
standing in our sample (5-8y: 82.5%, 9-12y: 81.3%) was lower compared to Davies et al.15 (91.8%),
222
but higher than Janssen et al.16 (75.6%). Sensitivity for stepping (5-8y: 85.3%, 9-12y: 84.6%) was higher
223
compared to both Davies et al.15 (77.9%) and Janssen et al.16 (52.5%). Errors for estimates of time spent
224
in postures in our sample were slightly different to those in studies of preschoolers. Overall errors for 225
sitting/lying were small in 9-12y in our study (1.4%), as well as in Davies et al.15 (-4.4%) and Janssen
226
et al.16 (5.9%), whereas sitting/lying time in 5-8y in our study was underestimated by 12.6%. The
227
minimal error for stepping time in our sample was consistent with errors in preschoolers (no difference15
228
and 10.0%16). The monitor overestimated standing time in all studies, although the overall errors in
229
preschoolers were smaller (7.1%15 and 10.0%16, respectively) compared to 5-8y (36.8%) and 9-12y
230
12 related to sitting being misclassified as standing by AP1,15,16 which could explain the relatively large
232
individual error for sitting/lying time in 5-8y and standing time in both age groups in our study. We 233
further investigated the videos and discovered that children for whom sitting/lying was overestimated 234
the most were 5-8y. These participants were seated on the edge of a chair with legs outstretched during 235
the rest periods between activities, causing AP3 to misclassify the posture as standing. This aligns with 236
previous reports15,16 suggesting that the non-standard postures that children sometimes engage in might
237
influence sit/lie misclassification by the monitor. 238
The absolute number of SB breaks estimated by AP3 in our study was significantly 239
overestimated by 8.4 breaks (53.2%) in 5-8y and 3.4 breaks (28.3%) in 9-12y. AP1 also overestimated 240
the number of SB breaks among preschoolers by 43.6%16 and 66.7%.22 The authors suggested that this
241
was related to the impact of non-standard postures on the estimates of SB breaks. Davies et al.22 and
242
Janssen et al.16 noted that 34.0% and 63.8% of transitions, respectively, were from non-standard
243
postures to upright postures. The number of transitions from “other standing” to upright postures in our 244
study was 23.2% of the total number of transitions in 5-8y and 36.5% in 9-12y, which might not explain 245
the larger overestimation of breaks in 5-8y. However, the definitions of non-standard postures in 246
previous studies16,22 included both non-standard sitting and non-standard standing. Because numerous
247
non-standard postures identified in previous research22 appeared to be more similar to standing than
248
sitting, in that they required the activation of large postural muscles (e.g. crouching and kneeling up), 249
these were classified separately in our methods as “other standing”. After visual inspection of the 250
videos, non-standard sitting postures, which were not coded separately in our study, may have 251
contributed to the overestimation of SB breaks. For example, if the child was sitting on a chair with 252
thigh parallel to the ground and moved to the edge of the chair with legs outstretched (non-standard-253
sitting), AP3 may have classified this movement as an additional break, relative to DO. As suggested 254
by Davies et al.22, the relative assessment of the number of SB breaks may be more important than the
255
absolute number for epidemiological applications to understand the physiological and health 256
consequences of the breaks. In agreement with previous studies in school-aged18 and preschoolers,22
13 our study demonstrated a significant correlation for SB breaks assessed by AP3 and DO in both age 258
groups, indicating that AP3 is accurate when evaluating the relative number of breaks. 259
The strengths of this study include the relatively larger sample and the wider age-range of 260
participants compared to previous studies.15,16,18 Furthermore, a wider range of non-ambulatory
261
activities was included compared to the activity protocol used previously with school-aged children.18
262
Data from the entire activity protocol in our study were analysed including transitions between 263
activities, resulting in a high time resolution, with the aim to include data of natural behaviours and 264
changes in postures. The analyses of classification accuracy and measurement agreement at the group 265
and individual level provided more insight into the magnitude and source of potential measurement 266
errors, relative to previous analyses in school-aged children. Findings in this study, however, need to 267
be confirmed in free-living conditions as our activity protocol was laboratory-based and might not 268
completely reflect children’s real-world movement patterns and postures. Furthermore, postural 269
allocation by the criterion measure DO might involve some subjectivity, which could have contributed 270
to differences between studies. Another consideration is whether or not our analyses, stratified by age 271
group, were sufficiently powered to detect statistical equivalence. Post-hoc power calculations 272
indicated that a sample size of n=21, n=87 and n=20 for sitting, standing and stepping, respectively, in 273
5-8y and n=33, n=96 and n=24, respectively, in 9-12y was required. In equivalence testing, if CI’s 274
clearly demonstrate the methods are not equivalent to the reference method, then the sample size is 275
adequate to conclude they are not equivalent. If results are ambivalent (CI’s partial crossing of the 276
equivalence region) and the sample size is not adequate, the results may be at risk of type 2 error. 277
Therefore, the analyses were slightly under-powered to conclude that AP3 estimates of sitting time in 278
5-8y and standing time in 9-12y were equivalent to DO. 279
280
Conclusion 281
AP3 demonstrated acceptable accuracy for classifying sitting/lying, standing and stepping in 282
14 time were more accurate in older children. However, AP3 overestimated time spent standing and the 284
absolute number of SB breaks. The group-level accuracy suggests that surveillance applications of AP3 285
would be acceptable, however, individual level applications might be less accurate. 286
287
Practical implications 288
AP3 demonstrated acceptable accuracy for classifying sitting/lying and stepping in school-aged 289
children, but was generally more accurate in 9-12y compared to 5-8y. 290
AP3 accurately estimated sitting/lying time in 9-12y and stepping time in 5-8y and 9-12y, 291
however, standing time and the absolute number of SB breaks were overestimated. 292
The application of AP3 in school-aged children seems acceptable at the group level, although 293
outcomes of AP3 should be interpreted with caution at the individual level. 294
295
Acknowledgements 296
We would like to thank all children and their parents for their participation. We also thank Melinda 297
Smith for her assistance with recruitment and data collection and Woranart Maneenin for video 298
analyses. This study was funded by the National Heart Foundation of Australia (G11S5975). DPC is 299
supported by an Australian Research Council Discovery Early Career Researcher Award 300
(DE140101588). ADO is supported by a National Heart Foundation of Australia Career Development 301
Fellowship (CR11S 6099). TH is funded by a National Health and Medical Research Council Early 302
Career Fellowship (APP1070571). The work of UE and SB is funded by the UK Medical Research 303
15 References
1. Healy GN, Matthews CE, Dunstan DW, et al. Sedentary time and cardio-metabolic biomarkers in US adults: NHANES 2003–06. Eur heart J. 2011;32:590-7.
2. Van der Ploeg HP, Chey T, Korda RJ, et al. Sitting time and all-cause mortality risk in 222 497 Australian adults. Arch Intern Med. 2012;172(6):494-500.
3. Helmerhorst HJ, Wijndaele K, Brage S, et al. Objectively measured sedentary time may predict insulin resistance independent of moderate-and vigorous-intensity physical activity. Diabetes.
2009;58(8):1776-9.
4. Peddie MC, Bone JL, Rehrer NJ, et al. Breaking prolonged sitting reduces postprandial glycemia in healthy, normal-weight adults: a randomized crossover trial. Am J Clin Nutr.
2013;98(2):358-66.
5. Dunstan DW, Kingwell BA, Larsen R, et al. Breaking up prolonged sitting reduces postprandial glucose and insulin responses. Diabetes care. 2012;35(5):976-83.
6. Mitchell J, Pate R, Beets M, et al. Time spent in sedentary behavior and changes in childhood BMI: a longitudinal study from ages 9 to 15 years. Int J Obes. 2012;37(1):54-60.
7. Cliff DP, Okely AD, Burrows TL, et al. Objectively measured sedentary behavior, physical activity, and plasma lipids in overweight and obese children. Obesity. 2013;21(2):382-385.
8. Cliff DP, Jones RA, Burrows TL, et al. Volumes and bouts of sedentary behavior and physical activity: associations with cardiometabolic health in obese children. Obesity.
2014;22(5):112-8.
9. Cliff D, Hesketh K, Vella S, et al. Objectively measured sedentary behaviour and health and development in children and adolescents: systematic review and meta-analysis. Obes Rev.
2016;17(4):330-344.
10. Fröberg A, Raustorp A. Objectively measured sedentary behaviour and cardio-metabolic risk in youth: a review of evidence. Eur J Pediatr. 2014;173(7):845-60.
16 12. Lubans DR, Hesketh K, Cliff D, et al. A systematic review of the validity and reliability of sedentary behaviour measures used with children and adolescents. Obes Rev.
2011;12(10):781-99.
13. Janssen X, Cliff DP. Issues related to measuring and interpreting objectively measured sedentary behavior data. Meas Phys Educ Exerc Sci. 2015;19(3):116-24.
14. Ridgers ND, Salmon J, Ridley K, et al. Agreement between activPAL and ActiGraph for assessing children’s sedentary time. Int J Behav Nutr Phys Act. 2012;9:15-23.
15. Davies G, Reilly JJ, McGowan AJ, et al. Validity, practical utility, and reliability of the activPAL in preschool children. Med Sci Sports Exerc. 2012;44(4):761-8.
16. Janssen X, Cliff DP, Reilly JJ, et al. Validation of activPALTM defined sedentary time and breaks in sedentary time in 4-to 6-year olds. Pediatr Exerc Sci. 2014;26(1):110-7.
17. De Decker E, De Craemer M, Santos-Lozano A, et al. Validity of the ActivPAL™ and the ActiGraph monitors in preschoolers. Med Sci Sports Exerc. 2013;45(10):2002-11.
18. Aminian S, Hinckson EA. Examining the validity of the ActivPAL monitor in measuring posture and ambulatory movement in children. Int J Behav Nutr Phys Act. 2012;9:119-28.
19. Oliver M, Schofield GM, Kolt GS. Physical activity in preschoolers: understanding prevalence and measurement issues. Sports Med. 2007;37(12):1045-70.
20. Altman DG, Bland JM. Measurement in medicine: the analysis of method comparison studies. The statistician. 1983:307-17.
21. Kuczmarski RJ, Ogden CL, Guo SS et al. 2000 CDC Growth Charts for the United States: methods and development. Vital Health Stat 11 2002; 246:1-190.
22. Davies G, Reilly JJ, Paton JY. Objective measurement of posture and posture transitions in the pre-school child. Physiol Meas. 2012;33(11):1913-21.
23. Provost F, Kohavi R. Glossary of terms. J Mach Learn. 1998;30(2-3):271-4.
17 25. Batterham MJ, Van Loo CMT, Charlton KE, et al. Improved interpretation of studies comparing methods of dietary assessment: Combining equivalence testing with the limits of
18 Table 1. Confusion matrix for classification accuracy (sensitivity) of activPAL3TM (AP3) for
postures.
AP3
DO
Sitting/lying
Standing
Stepping
Sitting/lying
5-8y
0.868
0.118
0.014
9-12y
0.953
0.036
0.011
Standing
5-8y
0.027
0.825
0.148
9-12y
0.019
0.813
0.168
Stepping
5-8y
0.017
0.130
0.853
9-12y
0.023
0.131
0.846
[image:18.595.74.442.132.323.2]19 Figure 1. 95% equivalence test for estimated time spent sitting/lying, standing and stepping.
Legend Figure 1:Times estimated by activPAL3TM (AP3) are equivalent to direct observation (DO) if
90% confidence intervals lie entirely within the equivalence region of direct observation. AP3: ○ =
20 Figure 2. Bland-Altman plots
Legend Figure 2: Bland-Altman plots with 95% limits of agreement for time spent sitting/lying (a:
5-8y, b: 9-12y), standing (c: 5-5-8y, d: 9-12y) and stepping (e: 5-5-8y, f: 9-12y). DO: direct observation,
AP3: activPAL3TM. Mean bias was calculated as percentages proportionally to the magnitude of the
measurements using DO-AP3; a positive value indicates underestimation of time spent in the posture
21 Supplementary Table 1. Activity Protocol
Activity Type
Activity Trial Intensity Description of Activity Trial
Resting Lying down Sedentary Lying down awake on a mattress in supine position - arms at sides - rest for 10 min.
Sitting TV viewing Sedentary Watching a movie in a comfortable chair. Instructed to minimise body movements.
Handheld e-game Sedentary Sitting on a chair at a desk playing an e-game on a handheld device.
Writing/colouring Sedentary Sitting on a chair at a desk, 5-8 y: colouring on paper using pencils, 9-12 y: copying words on a pad of paper using a pencil.
Computer game Sedentary Sitting on a chair at a desk playing an educational computer game.
Lifestyle Getting ready for school
Light Get dressed, set table, pour food, pack up, brush teeth, pack bag, leave for school.
Standing class activity
Light Standing activities with minimal movement such as writing/drawing on a white board.
Dancing Light Following a video with dance step instructions (Zumba®
fitness).
Tidy up Moderate Tidying up a 4x5 m area: pick up clothes, towels, toys and sport equipment and return them into boxes.
Basketball Moderate Shooting a basketball using a 2.29 m adjustable hoop, chase the ball within a 4.9x4.6 m area and bounce back to the start position at the boundary line apposite from the hoop.
Soccer Vigorous Kicking a foam soccer ball on a 5 m distance between a 1 m wide goal after dodging between a straight line of 5 cones (1 m apart). Instructed to jog back to start position after kicking the ball.
Locomotor course Vigorous Continuously completing a course including 4x 2-foot jump, jogging and sliding between cones around a 4x9.5 m area.
Ambulatory Slow walk Light Walking slowly at a self-selected comfortable speed around a 45 m indoor track. Examiner regulates constant speed by recording lap times.
Brisk walk Moderate Walking briskly at a self-selected brisk comfortable speed around a 45 m indoor track. Examiner regulates constant speed by recording lap times.
22 Supplementary Table 2. Participants' characteristics
5-8y (n=25)
9-12y (n=32)
Total (n=57)
Age (y) 7.0 ± 1.2 10.9 ± 1.2 9.2 ± 2.3 Sex
Boys (n) 11 (44.0%) 17 (53.1%) 28 (49.1%)
Girls (n) 14 (56.0%) 15 (46.9%) 29 (50.9%)
Height (cm) 123.0 ± 8.9 146.0 ± 9.2 135.9 ± 14.6 Body mass (kg) 24.1 ± 4.0 39.4 ± 9.9 32.7 ± 10.9 BMI percentile 52.8 ± 24.3 53.5 ± 31.9 53.2 ± 28.6 Overweight (n) 2 (8.0%) 5 (15.6%) 7 (12.3%)
Obese (n) - 2 (6.6%) 2 (3.5%)
Race
Caucasian (n) 24 (96.0%) 30 (93.8%) 54 (94.7%)
Asian (n) 1 (4.0%) 2 (6.2%) 3 (5.3%)
Characteristics of the participants are presented as mean ± SD, distributions of the sample are