ACCESSIBILITY PLANNING FOR CYCLISTS
Mr Andy Wells1, Dr Ben Waterson1#, Professor Mike McDonald1 and Mr David Tarrant2. 1
Transportation Research Group, School of Civil Engineering and the Environment, University of Southampton, Highfield, Southampton, SO17 1BJ
2
Gifford, Carlton House, Ringwood Road, Woodlands, Southampton, SO40 7HT
#
corresponding author, email: [email protected], tel: +44(0)23 8059 2345
Abstract
The UK Government's Accessibility Planning initiative aims to improve access to healthcare, jobs, shops, services and community facilities by non-car methods of travel, particularly for disadvantaged groups and areas. Every local authority in the UK is now required to report against a number of indicators in their Local Transport Plan and Local Development Framework, commonly the distance or time needed to access a particular location by walking, cycling and public transport. Accessibility for pedestrians and cyclists is typically measured using a crow-fly distance or the shortest distance on the road network, but these methods do not account for either cycle and pedestrian routes away from the road network, which improve accessibility, or physical and psychological barriers to movement, which reduce accessibility. This paper details a study of cyclists in Southampton, UK, which used Geographical Information Systems to compare the commonly used crow-fly and road network estimates with actual travel distances for cyclists, to assess whether improved distance measures could be derived to give better measures of accessibility. Using a case study of a large shopping centre, the use of crow-fly distance measures was found to significantly overestimate accessibility, suggesting that local authorities using crow-fly distance measures should be extremely cautious when presenting and analysing results. Using measures based on the road network alone was shown to slightly underestimate accessibility, with the error increasing as the number of cycle routes and other routes available to cyclists increases.
By creating a weighted average of the crow-fly and road network distance measurements, a better estimate of true shortest cycling distances was achieved. By effectively creating a road network based accessibility polygon and then expanding it slightly to account for the likely presence of cycle routes without having to know their exact locations, this paper describes a methodology for local authorities to improve the accuracy of accessibility assessments until networks including detailed cycle routes and other routes available to cyclists become available.
Acknowledgements
Universities’ Transport Study Group, Harrogate, UK – is available online at: http://www.utsg.net
1. Introduction
Transport planners are under increasing pressure to provide for cyclists due to changes in planning guidance, funding mechanisms and Government guidelines designed to encourage more environmentally-friendly forms of transport (Wardman et al., 1997; McClintock and Cleary, 1996). Cycling is also seen as a good way to encourage more exercise in order to reduce sedentary lifestyles and associated illnesses such as diabetes and heart disease (Killoran et al., 2006)
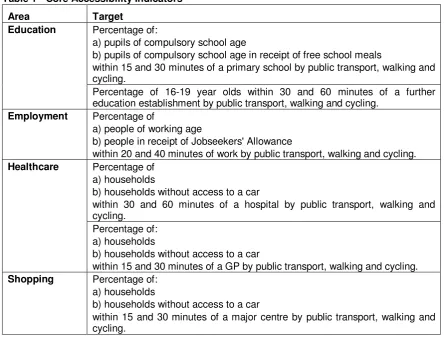
[image:2.595.83.528.332.669.2]The UK Government's Accessibility Planning initiative (Department for Transport, 2004a) is part of the government’s agenda to tackle social exclusion (Social Exclusion Unit, 2003). Accessibility Planning aims to improve access to healthcare, jobs, shops, services and community facilities by non-car methods of travel, particularly for disadvantaged groups and areas. Every local authority in the UK is now required to report against a number of indicators in their Local Transport Plan and Local Development Framework (Department for Transport, 2004b). Core Accessibility Indicators are mandated by the government for Local Transport Plans. These indicators are typically the distance or time to access common locations such as schools, employment, healthcare and shopping by different groups of people, using different modes of transport (Table 1). Additional indicators of local significance may be added to the mandated indicators to measure aspects specific to an area or local authority. Examples of these local indicators (from Nottinghamshire) can be seen in Table 2, but are always generally in the same spirit as those defined by national government.
Table 1 - Core Accessibility Indicators
Area Target
Percentage of:
a) pupils of compulsory school age
b) pupils of compulsory school age in receipt of free school meals
within 15 and 30 minutes of a primary school by public transport, walking and cycling.
Education
Percentage of 16-19 year olds within 30 and 60 minutes of a further education establishment by public transport, walking and cycling.
Employment Percentage of
a) people of working age
b) people in receipt of Jobseekers' Allowance
within 20 and 40 minutes of work by public transport, walking and cycling. Percentage of
a) households
b) households without access to a car
within 30 and 60 minutes of a hospital by public transport, walking and cycling.
Healthcare
Percentage of: a) households
b) households without access to a car
within 15 and 30 minutes of a GP by public transport, walking and cycling.
Shopping Percentage of:
a) households
b) households without access to a car
Table 2 – Example Additional Local Accessibility Indicators
Local Authority
Target
Nottinghamshire Percentage of residential areas within 400m walking distance of a bus/tram stop of at least every 30 minute frequency to a district centre.
Nottinghamshire Percentage of population within a 10 minute walk of an hourly or better bus service.
Typically, local authorities use a combination of a specially developed accessibility planning software package (called Accession) and existing geographical information systems (GIS) to carry out accessibility planning. This enables authorities to measure distances for cycling accessibility using one of two methods:
• The crow-fly method, where the distance is calculated as the straight line between two points,
regardless of road layout or other physical obstructions.
• The road network method, where the distance is calculated as that of the shortest path which could
be travelled by a car.
Time-based targets are usually measured using crow-fly or road network based distance measures multiplied by a constant speed of travel.
Cycle routes and other routes available to cyclists are not typically used in distance calculations at present, as they are currently not available in map datasets, such as Ordnance Survey’s Integrated Transport Network (ITN)*. Whilst local authorities acknowledge that the use of a combined road and cycle network for cycling accessibility would be preferable, data collection of all additional routes available to cyclists and manipulation of these routes within existing GIS is not a trivial task.
The aim of this paper therefore is to establish the impact of not including cycle routes and other routes available to cyclists in accessibility calculations. Specifically:
• To assess the effectiveness of existing crow-fly and road network based distance measures for
determining shortest travel distances for cyclists.
• To determine whether an improved shortest cycling distance measure for use in accessibility planning
can be generated based upon a combination of crow-fly and road network based distance measures.
• To compare the impact of all these alternative shortest cycling distance measures by carrying out an
example accessibility assessment using household data from the 2001 National Census .
*
Universities’ Transport Study Group, Harrogate, UK – is available online at: http://www.utsg.net
2. Distance Measurement and Estimation
The first stage in comparing cycling distance measures was to define the full network of routes available to cyclists. Using the MapInfo Professional Geographical Information System, the Ordnance Survey’s Integrated Transport Network dataset, containing road data for Southampton, UK, was augmented with data about additional routes available to cyclists. These additional routes were obtained using the existing Southampton City Bike Map for local authority defined cycle routes, the local knowledge of the authors, routes given by local cyclists on a map-based survey and individual site visits where appropriate. Many roads within the dataset which had been ‘stopped-up’ for motorised traffic, but which are still a valid through route for cyclists, were identified using the “detect close nodes” function in the tool RouteFinder for MapInfo. One-way streets were re-coded for bi-directional bicycle travel where on-street facilities to allow contra-flow cycling were known to exist, but unfortunately existing turn restrictions for motorised traffic had to be retained in the data, as the available tools did not allow these to be changed.
To ensure realism in the cycle routes used for comparison, a questionnaire survey of Southampton cyclists was undertaken. This produced data related to the actual journey origins, destinations, routes, travel distances and travel times for forty-six cyclists’ journeys spread across the city. For each origin-destination pair reported on the questionnaire survey, travel distances between origin and origin-destination could then be calculated based on the following three methods:
• Crow-fly distance (calculated directly from the GIS dataset)
• Shortest cycling distance using the road network (calculated using the ITN dataset alone) • The actual shortest cycling distance (calculated using the combined road and cycle network)
Additionally, cyclists’ actual routes between the origin and destination (as recorded by the cyclists on the questionnaires) were analysed for comparison with these shortest routes. Cyclists’ actual distances were measured using a custom GIS tool developed in this research, which combined the length of each link in a user-defined route, to determine the total distance.
0 1 2 3 4 5 6
0 1 2 3 4 5 6
Shortest cycling distance (km)
A
c
tu
a
l
c
y
c
li
n
g
d
is
ta
n
c
e
(
k
m
)
actua l = sh
[image:4.595.142.497.426.638.2]ortes t
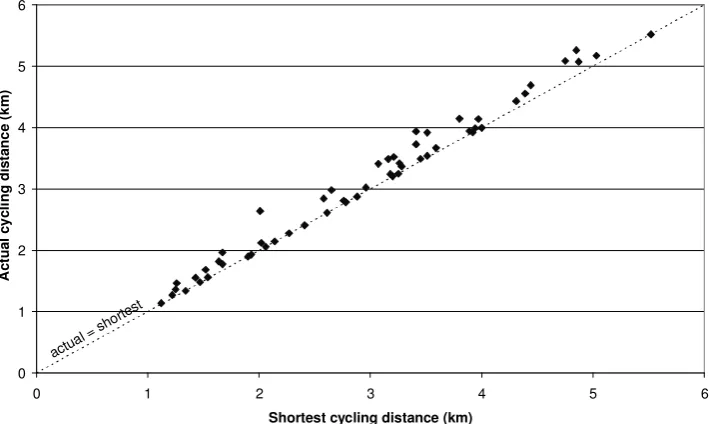
Comparing the routes recorded by the cyclists on the questionnaires with their equivalent shortest possible route using the combined road and cycle network (Figure 1) clearly shows that cyclists do not always choose the shortest option; of the forty-six journeys analysed in this research, only 27% used the shortest possible route. Although detailed consideration of the reasons underlying this result are beyond the scope of this paper, the first possible explanation for this is related to network knowledge, especially knowledge of route segments not available for motorised-traffic. The second possible explanation is related to cyclist route perception, especially perceived safety which is considered to be a key determinant of cyclist route choice, with the shortest route possibly being perceived as too dangerous.
0 1 2 3 4 5 6
0 1 2 3 4 5 6
Distance (km) shortest
[image:5.595.144.496.188.396.2]D is ta n c e ( k m ) u s in g r o a d n e tw o rk o r c ro w -f ly
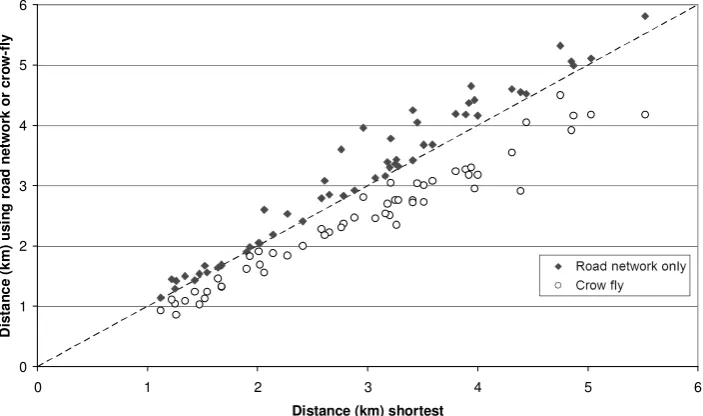
Figure 2 – Comparison of shortest, road network and crow-fly distance estimates
Accessibility indicators are measured on minimum distances and travel times, regardless of whether these routes would actually be chosen by cyclists and it is therefore necessary to compare the shortest possible routes with those obtained by the measurement methods currently available to local authorities. Based on the survey data, the cyclists’ shortest possible routes between their given origins and destinations using the combined road and cycle network, road network alone, and crow-fly distance are compared in Figure 2, with the overall results being:
• Crow-fly distance under-estimated the shortest distance by 17% on average
• Road network (ITN) alone distance over-estimated the shortest distance by 7% on average
Although the direction of these results is what would be expected (crow-fly underestimating due to neglecting physical constraints and road network overestimating by not taking advantage of ‘cycle shortcuts’), the magnitude of the errors identified in just this sample suggests that errors in distance measurement are likely to have a significant impact on the results reported against the accessibility indicators.
Universities’ Transport Study Group, Harrogate, UK – is available online at: http://www.utsg.net
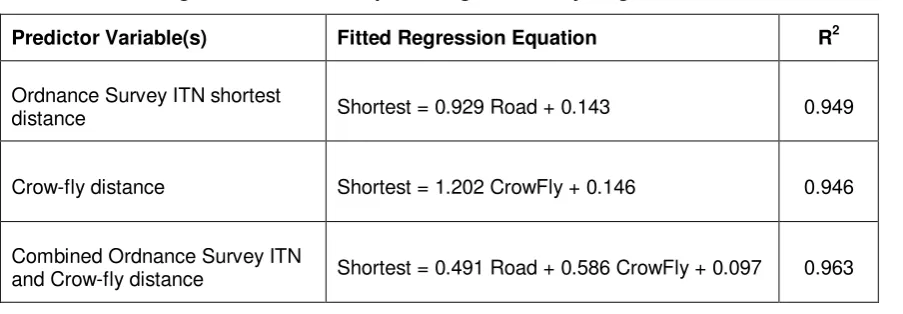
Table 3 - Linear Regression models for predicting shortest cycling distance
Predictor Variable(s) Fitted Regression Equation R2
Ordnance Survey ITN shortest
distance Shortest = 0.929 Road + 0.143 0.949
Crow-fly distance Shortest = 1.202 CrowFly + 0.146 0.946
Combined Ordnance Survey ITN
and Crow-fly distance Shortest = 0.491 Road + 0.586 CrowFly + 0.097 0.963
While the high degree of fit of all these models (R2 values all above 0.9) is as expected from the high degree of correlation apparent in Figure 2, a direct comparison in predictive accuracy against the survey dataset is unreliable as this would be based on the same data used for calibration of the equations. It does appear however that a weighted combination of the (overestimating) shortest road network method and the (underestimating) crow-fly method can be used to create an improved estimate of the actual shortest route distance faced by cyclists with consequential improvement in the accuracy of accessibility assessments based on it.
Four measures of shortest cycling distance have therefore been established in this research:
• The crow-fly distance
• The shortest cycling distance using the road network alone
• The shortest cycling distance estimated using the regression method based on the combined crow-fly
and road network distances
• The actual shortest cycling distance using the combined road and cycle network
The majority of the accessibility indicators are given as maximum travel times rather than distances. Before carrying out the final stage of this research, to compare the impact of these different distance measures on accessibility assessments, it is first necessary to develop a mechanism to convert from the time based nature of the indicators to a distance based measure where the four approaches can be compared.
Returning to the questionnaire survey of Southampton cyclists, and comparing the stated journey times and recorded route distances, provided a mean cycling speed for the cyclists surveyed of 13.8 km/h. While it clearly cannot be assumed in general that cyclists travel at a constant speed through all parts of a network (due to the effects of gradient, junctions, presence or absence of segregated cycling facilities, etc.), a detailed knowledge of, or the data required to, estimate how such speeds vary across a network is beyond the ability of most local authorities. Applying a constant speed of 13.8 km/h to the 15 minute travel time target of many of the accessibility indicators therefore equates the 15 minutes maximum with a distance of 3.45 km.
3. Accessibility Planning Case Study Methodology
Located within the centre of the city of Southampton, the West Quay shopping centre is the largest concentrated retailing area in the city (Southampton City Council, 2006). As such it can be used by the city council as one of the defined ‘major centres’ against which to measure accessibility using indicators such as the number of “households within 15 minutes of a major centre by cycling”.
By using each of the alternative measures of distance to generate a travel time polygon for this indicator, an example accessibility assessment can be produced using a GIS dataset representing household data for Southampton from the 2001 National Census. By comparing these example assessments it is possible to estimate the error in the measurement of accessibility that is produced for each method of calculating cycling distance for this indicator.
Crow-fly Distance
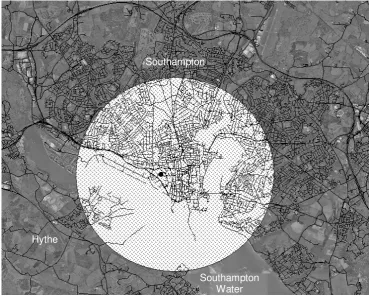
[image:7.595.133.503.377.673.2]Based on the mean speed of the cyclists surveyed (13.8 km/h), the 15 minute accessibility indicator, and using the crow-fly method; all households within 3.45 km of the shopping centre would be counted against the indicator. It is immediately clear from Figure 3 however that using crow-fly distance gives results which are clearly undesirable. Locations across the (Southampton Water) estuary from Southampton, in Hythe, fall within the 15 minute circle, even though in reality they are considerable further than this from the “major centre” by bicycle (approximately 18 km via the closest bridge). While it is straightforward to exclude households in Hythe from the accessibility assessment in this paper, this finding demonstrates the type of inaccurate situations that can result from using a crow-fly analysis in this way.
Figure 3 – Area within 15 minutes of shopping centre: Crow-fly method
Road Network Only Distance
Southampton
Universities’ Transport Study Group, Harrogate, UK – is available online at: http://www.utsg.net
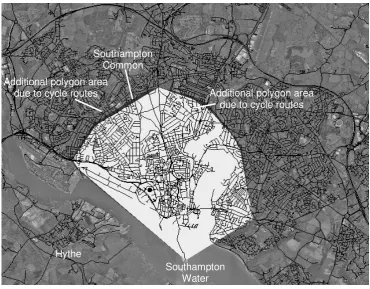
[image:8.595.133.504.135.424.2]Using the ‘Polygon Drivetime’ methodology within the RouteFinder package, a boundary can be drawn around all points within a 3.45 km road distance of the shopping centre (light coloured area in Figure 4). It is immediately clear that the area covered is far smaller in many directions than that of the crow fly distance in Figure 3, except along the major arterial routes where effectively a cyclist could travel in a straight line towards the shopping centre (if they chose to use such busy routes).
Figure 4 – Areas within 15 minutes of shopping centre: Road network and combined road and cycle network methods
Combined Road and Cycle Network Distance
The combined road and cycle network assessment represents the actual distances that cyclists face and as such enables the actual number of households meeting the accessibility indicator to be calculated. As would be expected, comparing (in Figure 4) the polygon formed by the road network alone with that formed using the combined road and cycle network, shows that the latter is slightly larger in directions where there are cycle routes away from roads or not available for general traffic (black areas in Figure 4), such as Southampton Common. More difference between these polygons would be expected for indicators of greater distance or areas where cycle routes give significant benefit over the road network in terms of travel distance.
Regression Models for Distance
The polygon methodology used for the road and combined road and cycle network measures above was repeated for each of the three linear regression based distance measures in Table 3. The polygon boundaries for the single input models were found by simply rearranging the equations in Table 3 for a 15 minute (0.25 hour) travel time and constant 13.8 km/h speed, to give a maximum allowed distance as follows:
• Road Network Polygon Distance Limit Estimate = ((0.25 x 13.8) – 0.143) / 0.929 = 3.56 km • Crow-fly Polygon Distance Limit Estimate = ((0.25 x 13.8) – 0.146) / 1.202 = 2.75 km
Using a similar methodology for reversing the formulation of the combined crow-fly and road network based model in Table 3 is not possible due to the presence of two variables. Instead it is necessary to use:
Additional polygon area due to cycle routes
Southampton Water Hythe
Southampton Common
1. The RouteFinder software to calculate the minimum road network distance between each node in the network and the shopping centre
2. The latitude and longitude measurements in the GIS dataset for each node to calculate the crow-fly distance to the shopping centre
[image:9.595.134.506.184.486.2]These two distances can then be combined using the weightings from the regression equation to generate a best estimate of cycling distance based on both crow-fly and road network measures between the shopping centre and every node in the network, enabling the accessibility polygon for the indicator to be created (Figure 4).
Figure 5 – Areas within 15 minutes of shopping centre:
Regression model based on crow-fly and road network distance method
4. Accessibility Planning Case Study Results
Clearly from Figures 3, 4 and 5, none of the estimated distance measures produce a polygon exactly matching that actually facing cyclists, i.e. the polygon produced using the combined road and cycle network. The accessibility indicator however is concerned not with the polygon itself but with the number of households that it covers and, for each of the distance measures defined above, Table 4 shows the number of “households within 15 minutes of the major centre” by cycling, based on the appropriate polygon and a GIS dataset representing household data for Southampton from the 2001 National Census.
The results in Table 4 show that, even with obviously incorrect locations in Hythe removed, the use of crow-fly distance to measure accessibility in this case study overestimates the number of households counted for this indicator by just over 30% (over 10,000 households) compared to measuring the distance correctly using the combined road and cycle network. In reality, the coastal location of Southampton limits the overestimate in this case, as much of the crow-fly area falls over or beyond the estuary of Southampton Water. For similar cities in non-coastal locations the overestimate may be even larger than the 30% identified in this example.
Table 4 - Households within accessibility indicator using different distance measures
Distance measure Number of households
within 15 minutes of
Universities’ Transport Study Group, Harrogate, UK – is available online at: http://www.utsg.net
“major centre” cycle network
Distance using the combined road network
and other routes available to cyclists 35673 ---
Crow-fly distance (excluding Hythe) 46566 +30.5%
Distance using the road network alone 34555 -3.1%
Modelled distance using regression
equation based on road distance only 37078 +3.9%
Modelled distance using regression
equation based on crow-fly distance only 30458 -14.6%
Modelled distance using regression equation based on both road and crow-fly distance.
35451 -0.6%
The overestimate of cycling distances by using only the road network, and the resulting smaller accessibility polygon, under-estimates the accessibility for this indicator and location by 3.1% compared to measuring the distance using combined road and cycle routes. When this is corrected for using the regression equation, the result for this accessibility indicator is actually an overestimate of accessibility. The best estimate of the correct number of households within 15 minutes of the West Quay shopping centre by cycling (-0.6%) is made by the regression method combining the crow-fly and road network distance estimates. The equation is effectively creating a road network based accessibility polygon and then expanding it to account for the likely presence of cycle routes, without having to know their exact locations. It is therefore recommended that until networks including detailed cycle routes and other routes available to cyclists become available, local authorities should use this methodology based on a combination of crow-fly and road network distances in accessibility assessments.
5. Discussion and Conclusions
The methods described here attempt to give a more accurate measure for distance or time based targets as defined by the government, using datasets already available to local authorities. However, there are still weaknesses present using these methods. Firstly, for time based targets, cyclists do not travel at a constant speed and different routes may present different delays, stops and starts; concern has already been expressed by others in relation to speeds used for walking when conducting accessibility assessments (White, 2006). There may also be psychological barriers to movement that distance or time based targets do not take into account, such as busy roads, difficult road crossings or neighbourhoods where cyclists feel unsafe to travel. If these factors are to be taken into account, more detailed datasets containing details of road conditions and junction signalisation will be needed, along with methods to apply the factors to the accessibility indicators.
Universities’ Transport Study Group, Harrogate, UK – is available online at: http://www.utsg.net
6. References
Department for Transport (2004a). “Accessibility Planning Guidance: Full Guidance.” available online at: http://www.dft.gov.uk/stellent/groups/dft_localtrans/documents/page/ dft_localtrans_033615.hcsp Accessed 06/11/2006
Department for Transport (2004b). “Core Accessibility Indicators.” available online at: http://www.dft.gov.uk/stellent/groups/dft_control/documents/contentservertemplate/ dft_index.hcst?n=15560&l=4 Accessed 25/10/2006
Killoran, A., Doyle, N., Waller, S., Wohlgemuth, C., and Crombie, H. (2006). "Transport interventions promoting safe cycling and walking." ISBN 1-84629-228-X, NHS National Institute for Health and Clinical Excellence (NICE).
Martens, K. (2004). “The bicycle as a feedering mode: experiences from three European countries.” Transportation Research Part D: Transport and Environment, 9 (4), pp 281-294.
McClintock, H., and Cleary, J. (1996). "Cycle facilities and cyclists' safety: Experience from Greater Nottingham and lessons for future cycling provision." Transport Policy, 3(1-2), 67-77.
Miller, H. J. (2004). "Place-based versus people-based accessibility." Access to Destinations: Rethinking the Transportation Future of our Region, Minneapolis, Minnesota.
Social Exclusion Unit (2003). Making the connections: Final report on transport and social exclusion. Southampton City Council (2006) Planning terms online:
www.southampton.gov.uk/building-planning/planning/dev-control/planningterms.asp#M Accessed 06/11/2006
Wardman, M., Hatfield, R., and Page, M. (1997). "The UK national cycling strategy: can improved facilities meet the targets?" Transport Policy, 4(2), 123-133.