AVERAGING TECHNIQUES AND ULTRASONIC POLE FIGURES
INTRODUCTION
J. F. Smith, Y. Li, and R. B. Thompson Ames Laboratory
Iowa State University Ames, Iowa 50011
There is considerable interest in the evaluation of texture via ultra-sonic measurements because of the advantages when compared to evaluation by diffraction techniques. First, ultrasonic measurements are much more rapid and have the potential of being used concurrently while processing. Second, ultrasonic measurements are nondestructive while diffraction tech-niques require coupons to be cut for samples. Third, ultrasonic measure-ments, like neutron diffraction, sample the bulk of the test material while, in contrast, x-ray diffraction samples a thin surface layer. The primary disadvantage of ultrasonic measurements is that the textural evalu-ation must be based on a quite limited amount of data whereas diffraction evaluation is normally based upon a very extensive number of measured points. In spite of this disadvantage, research has shown that ultrasonic measurements are potentially useful. Specifically, it has been establish-ed [1,2] that during ultrasonic measurements the textural contribution can be distinguished from stress contribution, and it has been shown [3-10] that ultrasonic measurements do give a measure of the type and amount of texture in metal sheet or plate.
The first ultrasonic texture measurement [3] actually sectioned a rolled test piece and measured bulk wave velocities in a variety of direc-tions. Techniques more applicable to nondestructive evaluation have sub-sequently been investigated; these include [4,5] measurements of acoustic birefringence, Lamb waves, and Rayleigh waves. The optimum technique or combination of teChniques remains to be established. The usual approach for texture evaluation has been to describe a crystallite orientation distribution function (CODF) by a mathematical series and to use the ultra-sonic measurements to evaluate the expansion coefficients in the series. This CODF can then be projected onto any desired plane to generate a pole figure. The present work is addressed to the averaging procedure which is part of this process.
CODFs and Pole Figures
The following truncated development follows the work of Sayers [11,
12]
and Hirao et al[13].
Both Roe[14-161
and Bunge[17]
have suggested a series expansion for the mathematical description of CODFs. Thus, withas the Euler angles between the axes of a crystallite and the sample axes, with t
=
cOSet and with the normalization condition as211' 211' 1
J J J
w (~, 1jI, cp) d ~ d 1jI d cp = I,o
0 -1 the CODF may be expanded in1
w
(~,
1jI, cp)!
I
Roe's notation to yield 1
r
wlmnZlmn( ~)exp(-im1jl)exp(-in.p),1=0 m=-I n=-I
(1)
(2)
where Zlmn (~) are generalized Lengendre functions. The expansion coeffi-cients, wlmn ' may be evaluated from the transform
211' 211' 1
wlmn =
~
J J J
w(~,
1jI, CP)Zlmn(~)exp(im1jl)exp(incp)d~d1jld<ji.
(3) 411' 0 0 -1In orthotropic polycrystalline aggregates of cubic crystallites, many of the expansion coefficients are zero or are symmetry-related to others so that, to fourth order, only three coefficients are independent; these are
W~OO' W~20' and W~~O.
For polycrystalline aggregates, long wavelength ultrasonic velocities measure elastic constants «c'ij» that are averages for the crystallite orientations over the region traversed by the waves. To relate the experi-mentally measured <c'ij> to the CODF requires an assumption as to the type of averaging that the experimental value represents. Physically, the ori-gin of the problem is the grain boundary constraint between adjacent grains. In general, if adjacent grains are subjected to the same external stress, the resultant distortions in the two grains differ and mismatch when pro-jected onto the grain boundary. Thus the grain boundaries tend to produce gradients in the stress-strain relationships. Mathematically this results from off diagonal elements in the elastic constant matrix coupling shear and dilational distortions. Extremal values for the averages of the poly-crystalline elastic constants can be obtained from Voigt [18] or Reuss [19] averaging. Voigt averaging assumes homogeneous strain and averages over stress. Reuss averaging assumes homogeneous stress and averages over strain. Hill [20] has suggested that an arithmetic mean of these two averages frequently comes very close to experimental values and is, there-fore, more realistic.
It will be recognized that for a normalized CODF the average value for any function of the Euler angles is
211 211 1
<f> =
J J
J
f(~, 1jI, cp) w(~, 1jI, cp) d~ d1jl dcp. (4)o
0 -1From this relationship the experimental elastic constants can be expressed in terms of the CODF expansion coefficients. The necessary relationships for cubic crystallites as derived by Hirao et al [13] are as follows:
<C'l1>i (l+2\1) i - 2ci
°
1, <c' 22>i (>'+2\1) i - 2ci°
2,<c'33>i (>.+2\1)i - 2ci~3' (5)
Here the subscript i refers to the averaging procedure (i.e. Voigt, Hill, or Reuss) and the other terms are defined by
(A+2~)V = cll - 2c/5, ~V = c~~+c/5, (A+2~)R
=
2(sll+s12-s/5)/[(sll+2sl2)(s~~+4s/5)], ~R(1.+2}.1)H
= [(
1.+2}.1) V + (1.+2}.1)R]/2, }.IH=
(l!y+}.IR)/2,C
v
= cll-c12-2c~~(=c), cR = -4~~s, cH = (cV+cR)/2, s = sll-s12-s~~/2.(6)
In these expressions, the unprimed Ct·'s are the single-crystal elastic stiffness constants, Sij'S are the
s~~gle-crystal
compliance constants, A and ~ are the Lame cons~ants, and the subscripts V, R, and H refer toVoigt, Reuss, or Hill averages. The CODF contributes only through the 6i values which are averages generated from Eq. 4 and involve direction cosines that interrelate Euler angles and the directions of wave propaga-tion and polarizapropaga-tion.
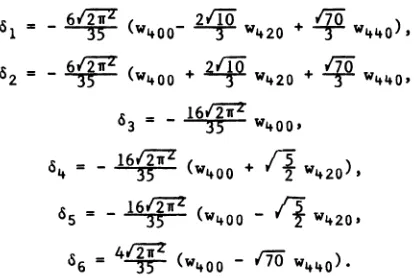
These 6i values are related to the CODF expansion coefficients in the following way:
61fi7
21fO
19
61 .. - ~ (w~OO-
--r-
w~20 + w~~O)'62 = -
6;~1r2 (w~OO
+ 2"¥w~20
+'r>
w~~O'
6 -3 - - 16f2i2'
35
w~oo, (7)161fiZ (
'3:)
o~ = -
35
w~oo + {t
W~20 '~ = 16f2i2' ( .fj'
Us
-
35
w~oo - {t
W~20'.. _ 4f2i2' ( ~
U6 - ~ w~oo - ,70 w~~O).
It should be emphasized that all variation due to crystallite orientation is in these 6i terms. Since there are six 6i 's and only three expansion coefficients, it is obvious that there must be some redundancy and only three independent measurements must be made. Even so, evaluation of W~OO
is not done reliably with only Rayleigh or Lamb wave measurements.
RESULTS
To illustrate the lack of reliability in evaluation of W~OO with Lamb
waves, Table 1 shows some results for Cu and for Al of three different textures. For present purposes, the numbers associated with the Al samples are simply identifiers to distinguish samples of different texture. With the available data there was redundancy in both W~~O and W~OO but not in
W~20' and evaluations were made of these coefficients with Voigt, Reuss,
and Hill techniques. It is obvious that the agreement between equivalent values in the case of W~~O is much better than in the case of W~OO.
Reli-able evaluation of W~OO without resorting to bulk velocity measurements is a problem which remains to be solved. The comparison of ultrasonic pole
[image:3.482.138.345.239.378.2]Table 1. Comparison of Voigt, Reuss, and Hill Average Values for the CODF Expansion Coefficients of Four Different Materials as Evaluated from So and SHo Lamb Waves.
llOO Al 629°F Al 675°F Al Copper
Wltlto(SHo)V -0.00573 0.00505 0.00303 -0.00303
WltltO(SHo)R -0.00555 0.00489 0.00294 -0.00334
Wltlto(SHo)H -0.00564 0.00497 0.00298 -0.00318
Wltlt°(So)V -0.00581 0.00551 0.00296 -0.00304
WltltO(So)R -0.00564 0.00535 0.00287 -0.00342
WltltO(So)H -0.00572 0.00543 0.00291 -0.00322
Wlt2O (So)V -0.00008 -0.00403 -0.00265 0.00121
Wlt2O (So)R -0.00008 -0.00389 -0.00257 0.00123
Wlt2O (So)H -0.00008 -0.00396 -0.00262 0.00122
WItOO(SHo)V -0.04521 -0.06566 -0.05482 0.04213
WItOo(SHo)R -0.05922 -0.07904 -0.06853 -0.05082 Wltoo(SHo)H -0.05232 -0.07245 -0.06178 -0.00203
WItOO(So)V -0.00791 0.01378 -0.00867 0.01247
WItOO(So)R -0.01l75 0.00849 -0.01319 -0.01272
WItOO(So)H -0.00986
o
.01l09 -0.01097 -0.00008Table 2. Comparison of Hill Averages of CODF Expansion Coefficients from Ultrasonic Data with Expansion Coefficients from X-ray or Neutron Diffraction Data.
1100 Al 629°F Al Ultrasonic
Wltlto(SH~)H -0.00564 0.00497
Wltlto(So H -0.00572 0.00543 WIt2O (SO)H -0.00008 -0.00396
WltOO(SH~)H -0.05232 -0.07245
WltOO(So H -0.00986 0.01109
* **
x-ray neutron Wit It 0 -0.00472 0.0069
Wlt20 -0.00028 -0.0034
WItOO 0.00098 0.0097
678°F Al Data
0.00298 0.00291 -0.00262 -0.06178 -0.01097 ** neutron
0.0043 -0.0033 0.0078
Copper
-0.00318 -0.00322 0.00122 -0.00203 -0.00008
*
x-ray -0.004320.00132 0.00113 *X-ray diffraction evaluation from G. C. Johnson, Univ. of Calif., at
~erkeley.
[image:4.482.78.421.78.308.2] [image:4.482.73.423.78.306.2]Ultrasonic measurements and x-ray pole figure determinations, with Voigt averaging only, had earlier been made on a series of Cu samples that were cold rolled by varying degrees from 50% reduction to 89% reduction and then annealed. Cu was chosen because its anisotropy ratio [21] of
2c~~/(cll-c12) = 3.6 is considerably greater than that of Al at 1.2. This
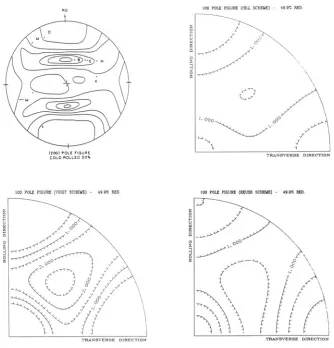
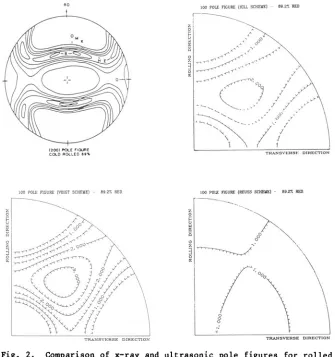
factor of three difference causes the elastic constants of polycrystalline Cu to be considerably more sensitive to averaging procedure and sensitivity to averaging technique was therefore expected to occur also in the pole figures. This expectation was confirmed as can be seen in Figs. 1-3. These figures show comparisons of x-ray pole figures with ultrasonic pole figures from Voigt, Reuss, and Hill averaging. Figure 1 is for Cu after
z
o ~ ~ ~
o
"
z3 o
~
OD
nOO) P01,.l 'IOUI'II: COr..D JIIOl\.£O )o'\.
100 PDU: nc,lJ"Rf (\'OICT SCHEYl) - .';1; RED.
100 PCU:: f'1GURf (HJrJ. SCKfll£) - tSr. RED
iR..\NS\'ERSE DIRIECTlOI'I
100 POU: ncURE (Dlf'SS sc:t:I!lal) - " .n JtIl).
\
\\
TRANSVERSE DIRECTION
Fig. 1. Comparison of x-ray and ultrasonic pole figures for rolled Cu with 50% reduction.
[image:5.482.69.403.154.502.2]. 0
nOO l fI'OI..f nOL.fll£
(. 0..0 1It00 1.( O .. ",
100 POLE nCURE (\'OIGT SCHFJl E)
0_-.
100 P'OU; ,-,cum; (R£USS ~, - een: fUl)Fig. 2.
--TRA..""ISVERSE DIRECTION TRA.N~Vt:R.9E DIRECTION
[image:6.482.72.407.140.497.2]..
IDO POU: ncURl: ,,'OlCT SOIDft) - .... "'Isr..w:oTRANSV~R'Sto! DltU:CTlON
100 POC'J F1G1.:U (UDJ. scllt1ll11 - J.... .. .st:Al1.1)
.r"
uj/
z 3
0
\
§"
(
0 0
<!
ACKNOWLEDGMENT
Ames Laboratory is operated for the U. S. Department of Energy by Iowa State University under contract no. W-7405-ENG-82. This work was supported by the Office of Basic Energy Sciences, Division of Materials Sciences.
REFERENCES
1. R. B. Thompson, J. F. Smith, and S. S. Lee, Appl. Phys. Lett. 44 (1984) 296.
2. R. B. Thompson, S. S. Lee, and J. F. Smith, Ultrasonics, in pren. 3. G. A. Alers and Y. C. Liu, Trans. Met. Soc. AlME 236 (1966) 482. 4. A. V. Clark, Jr., A. Govada, R. B. Thompson, J. F. Smith, G. V.
Blessing, P. P. Delsanto, and R. B. Mignona, in Review of Progress in uantitative NDE 6B, edited by D. O. Thompson and D. E. Chimenti
Plenum Press, New York, 1987) p. 1515.
5. R. C. Reno, A. V. Clark, Jr., G. V. Blessing, R. J. Fields, A. Govada, R. B. Thompson, P. P. Delsanto, R. B. Mignona, and J. F. Smith, presented at the TMS-AlME Fall Meeting, Orlando, Fla., Nov. 1986, to be published.
6. G. C. Johnson and W. C. Springer, in Review of Pro uantita-tive NDE 6B, edited by D. O. Thompson and D. E. Plenum Press, New York, 1987) p. 1495.
7. J. F. Smith, R. B. Thompson, D. K. Rehbein, T. J. Nagel, P. E.
8. P.
9. J. 10. M. 11. C. 12. D. 13. M. 14. R. 15. R. 16. R. 17. H. 18.
w.
19. A. 20. R. 21. R.Armstrong, and D. T. Eash, in Review of Pro ress in uantitative NDE 6B, edited by D. O. Thompson and D. E. Chimenti Plenum Press, New York, 1987) p. 152i.
P. Delsanto, R. B. Mignona, and A. V. Clark, Jr., in Review of Pro ress in uantitative NDE 6B, edited by D. O. Thompson and D. E. Chimenti Plenum Press, New York, 1987) p. 1533.
F. Smith, G. A. Alers, P. E. Armstrong, and D. T. Eash, J. Non-destruct. Eval. 4 (1984) 157.
Hirao and N. Hara, Appl. Phys. Lett. 50 (1987) 1411. M. Sayers, J. Phys. D: Appl. Phys. 15 (1982) 2157.
R. Allen, R. Langman, and C. M. Sayers, Ultrasonics 23 (1985) 215. Hirao, K. Aoki, and H. Fukuoka, J. Acoust. Soc.
Am.,
81 (1987)1434.
-J. Roe and W. R. Krigbaum, -J. Chem. Phys. 40 (1964) 2608. J. Roe, J. ApI. Phys. 36 (1965) 2024.
J. Roe, J. ApI. Phys. 37 (1966) 2069.
J. Bunge, Texture Analysis in Materials Science (Butterworths, London, 1982).
Voigt, Lehrbuch der Kristall Phfsik (Teubner, Leipzig, 1928). Reuss, Z. Angew. Math. Mech. 9 1924) 49.
Hill, Proc. Roy. Soc. London A65 (1952) 349.