This is a repository copy of
Using health state utility values from the general population to
approximate baselines in decision analytic models when condition specific data are not
available
.
White Rose Research Online URL for this paper:
http://eprints.whiterose.ac.uk/11177/
Monograph:
Ara, R. and Brazier, J.E. (2010) Using health state utility values from the general
population to approximate baselines in decision analytic models when condition specific
data are not available. Discussion Paper. (Unpublished)
HEDS Discussion Paper 10/11
[email protected] https://eprints.whiterose.ac.uk/ Reuse
Unless indicated otherwise, fulltext items are protected by copyright with all rights reserved. The copyright exception in section 29 of the Copyright, Designs and Patents Act 1988 allows the making of a single copy solely for the purpose of non-commercial research or private study within the limits of fair dealing. The publisher or other rights-holder may allow further reproduction and re-use of this version - refer to the White Rose Research Online record for this item. Where records identify the publisher as the copyright holder, users can verify any specific terms of use on the publisher’s website.
Takedown
If you consider content in White Rose Research Online to be in breach of UK law, please notify us by
HEDS Discussion Paper 10/11
Disclaimer:
This is a Discussion Paper produced and published by the Health Economics
and Decision Science (HEDS) Section at the School of Health and Related
Research (ScHARR), University of Sheffield. HEDS Discussion Papers are
intended to provide information and encourage discussion on a topic in
advance of formal publication. They represent only the views of the authors,
and do not necessarily reflect the views or approval of the sponsors.
White Rose Repository URL for this paper:
Once a version of Discussion Paper content is published in a peer-reviewed
journal, this typically supersedes the Discussion Paper and readers are invited
to cite the published version in preference to the original version.
Published paper
None.
Using health state utility values from the general population to approximate baselines in
decision analytic models when condition specific data are not available
Running head: EQ-5D scores with/without prevalent conditions
Ara R MSc, Brazier JE PhD
Health Economics and Decision Science, ScHARR, The University of Sheffield, 30 Regent
Street, Sheffield S1 4DA. UK
Corresponding author
Email [email protected]
Telephone: 44114 222 0788
Fax 44 114 272 4095
Keywords: health state utility values, baseline, quality of life, EQ-5D, age-adjusted
ABSTRACT
Decision analytic models in healthcare require baseline health related quality of life (HRQoL)
data to accurately assess the benefits of interventions. The use of inappropriate baselines such
as assuming the value of perfect health (EQ-5D = 1) for not having a condition may
overestimate the benefits of some treatment and thus distort policy decisions informed by cost
per QALY thresholds.
The primary objective was to determine if data from the general population are appropriate
for baseline health state utility values (HSUVs) when condition specific data are not
available.
Methods: Data from four consecutive Health Surveys for England were pooled. Self-reported
health status and EQ-5D data were extracted and used to generate mean HSUVs for cohorts
with or without prevalent health conditions. These were compared with mean HSUVs from
all respondents irrespective of health status.
Results: Over 45% of respondents (n=41,174) reported at least one health condition and
almost 20% reported at least two. Our results suggest that data from the general population
could be used to approximate baseline HSUVs in some analyses but not all. In particular,
HSUVs from the general population would not be an appropriate baseline for cohorts who
have just one health condition. In these instances, if condition specific data are not available,
data from respondents who report they do not have a prevalent health condition may be more
appropriate. Exploratory analyses suggest the decrement on HRQoL may not be constant
across ages for all conditions and these relationships may be condition specific. Additional
INTRODUCTION
Agencies such as the National Institute for Health and Clinical Excellence (NICE) produce
national guidance on the provision of new health technologies and their recommendations are
informed by reviews of clinical and economic evidence. To facilitate consistent
reimbursement recommendations across all disease areas interventions are appraised using a
decision rule based on the incremental cost per quality adjusted life year (QALY). The cost
per QALY results are estimated using decision analytic models which describe the clinical
pathway of health conditions or systems mathematically.
Analytic models frequently compare the benefits of treatments that have the potential to
alleviate a health condition or avoid a clinical event. Conditions and events are described by
health states in the models and the health related quality of life (HRQoL) or health state
utility values (HSUV) associated with these are generally obtained from clinical trials or
observational studies. The baseline HRQoL used to represent the HSUVs for individuals
without these conditions or events is equally relevant as these data are used to assess the
HRQoL gain in alleviating or avoiding the condition or event. Ideally the baseline HSUVs
would be derived from people without specific condition(s) using the definitions of health
states in the model. However, these data are rarely available and a baseline of full health is
commonly assumed.[1] As the average person still has other health problems, this
assumption overestimates the benefits of treatment[2,3] and it has been suggested that on
average, a treatment will increase HRQoL to the same level as persons without the
condition.[4] The baseline HSUVs used in decision models has important consequences as
these data could distort a policy decision based on a cost per QALY threshold thus
undermining efficient resource allocation.[5]
When condition specific baseline data are not available, one solution has been to use
age-adjusted HSUVs obtained from the general population (irrespective of health condition).[1,2]
counting is inevitable. However, unless the prevalence of the health condition is high or the
affect on HRQoL is substantial, intuitively one would expect the HRQoL of the average
person without a particular health condition to be similar to the HRQoL of the average person
of a similar age in the general population. Researchers have shown that in cardiovascular
disease (CVD) the cost per QALY results are of a similar magnitude when estimated using
either a baseline from the general population or a baseline from respondents with no history
of CVD.[5]
The primary objective of the current study is to determine if this finding generalises to other
conditions and thus if data from the general population are appropriate as baseline HSUVs in
decision models. Specifically, we compare the HRQoL for subgroups who have a particular
prevalent health condition (irrespective of other conditions) with a) the HRQoL from similar
aged subgroups who do not have the condition (irrespective of other health conditions) and b)
the HRQoL from similar aged subgroups irrespective of health status (i.e. the general
population). As a secondary analysis, we compare the HRQoL for subgroups who have just
one particular prevalent health condition with a) the HRQoL from similar aged subgroups
who do not have any condition and b) the HRQoL from similar aged subgroups irrespective
of health status (i.e. the general population).
METHODS
Data: We used HRQoL data and information on health status collected in the Health Survey
for England (HSE).[6] The HSE is an annual survey conducted on randomly selected samples
of the population living in private households in England.[HSE] The current study pools data
collected during the 2003, 2004, 2005 and 2006 surveys. Information on health status was
obtained from responses to the following question: “ Do you have any long-standing illness,
disability or infirmity? By long-standing I mean anything that has troubled you over a period
maximum of six types of long-standing illnesses per person and responses were coded into 39
different health conditions. Two additional codes: “unclassifiable” and “complaint no longer
present” were treated as no condition in our analyses.
HRQoL information was collected using the widely used generic questionnaire, the
EQ-5D.[7] The EQ-5D contains five attributes of health status including: mobility, self-care,
usual activities, pain/discomfort and anxiety/depression. Each attribute is measured by a
question with three possible responses: no problem, some problem, or severe problem. The
combination of all possible responses leads to 243 (3^5) distinct health states. A random
sample of the UK general public valued a sample of these health states using time trade-off
techniques.[7] The resulting algorithm, which was used to calculate HSUVs for the current
study, produces a range of -0.59 to 1, whereby 1 represents perfect health, 0 represents death
and negative values represent health states considered to be worse than death.
Analysis:
Generally patients in decision analytic models are defined to match the demographic
characteristics of patients who would receive the intervention under evaluation in clinical
practice. Consequently, a typical patient will have concurrent health conditions and for older
aged cohorts, a substantial proportion of patients will have additional prevalent health
conditions. However, the effectiveness and HRQoL evidence used to assess the benefits of
treatments may be derived from studies using strict recruitment criteria and patients with
comorbidities can be excluded from these. As the baseline needs to reflect the definitions and
data used in the model, we perform a series of analyses as described below.
i) The primary analyses test whether data from the general population can be used as the
baseline HRQoL when data from cohorts with a specific health condition (irrespective of
other health conditions) are used to assess the benefits of treatment. We compare mean
who did not have the specific health condition and b) respondents of a similar age irrespective
of health status (i.e. the general population).
ii) The secondary analyses test whether data from the general population can be used as
the baseline HRQoL when data from cohorts with a single health condition are used to assess
the benefits of treatment. We compare mean EQ-5D scores for these subgroups with mean
EQ-5D scores from a) respondents of a similar age who do not have any health condition and
b) respondents of a similar age irrespective of health status (i.e. the general population).
iii) Exploratory analyses were also performed to test a) if the decrements on HRQoL for
cohorts with a specific health condition (irrespective of other health conditions) are
comparable to the decrements for cohorts with the single specific health condition (and no
other condition) and b) if the decrements on HRQoL are constant across age.
All analyses were performed in STATA (v 11). Using the minimal important difference for
the EQ-5D (0.074) as a benchmark,[8] and assuming a SD of 0.20 in EQ-5D scores, we used
subgroups of greater than 64 (256) respondents for having the power to detect a mean
difference of 0.10 (0.05) with 80% power and 5% two-sided significance. The analyses were
weighted using the individual level self-administered questionnaire weights.[6] Statistical
significance for the weighted mean EQ-5D scores was assessed using the 95% confidence
intervals (CI) of the mean whereby if the CIs do not overlap there is a statistically significant
difference between the groups.[9]
RESULTS
Of the 41,174 respondents who completed the EQ-5D questionnaire, 44.5% (18302/41174)
were male, and the mean age was 48.6 (SD: 18.5) years for males and 48.5 (SD: 19.0) years
for females. 54.5% (22449/41174) reported they did not have a history of a health condition,
26.1% (10762/41174) reported just one condition and 19.3% (7963/41174) reported at least
“arthritis/rheumatism/fibrositis” at 10.1% (4145/41174) of the sample followed by
“hypertension/high blood pressure” at 7.7% (3172/41174). Prevalence of comorbid health
conditions varied by primary health condition and by age. The proportion of respondents
with more than one health condition ranged from 84.2% (123/146) of respondents with “other
bladder problems/incontinence” to 54.0% (1325/2452) of respondents with “asthma”. For
respondents (n=4,212) aged 40 years or younger who reported at least one health condition,
just 22.2% had at least one other condition while 57.4% of respondents (n=1,638) aged over
80 years who reported at least one health condition had at least one other condition.
The mean EQ-5D for all respondents (n=41,174) was 0.868 (range:-0.594 to 1). Respondents
(22,449) who reported no health condition had a mean EQ-5D of 0.949 (range: -0.371 to 1)
while respondents who reported one, or more than one health condition had mean EQ-5D
scores of 0.821 (range: -0.594 to 1) and 0.654 (range: -0.594 to 1) respectively.
i) Primary analyses: With the exception of respondents who had a history of “hayfever”
(n=416), all mean EQ-5D scores for respondents who reported they had a specific health
condition irrespective of whether they had other health conditions too (Table 1) were lower
than the mean EQ-5D scores for the subgroups who either did not have the condition or the
subgroups irrespective of health status. Four of the 39 subgroups had less than 64
respondents hence were not assessed in terms of significant differences in mean scores. As
the confidence intervals of the mean EQ-5D scores did not overlap for 29/35 pairs when
comparing with subgroups without the condition and 27/35 pairs when comparing with
subgroups irrespective of health condition, the differences were significant at the p < 0.05
level. Comparing the mean EQ-5D scores for respondents not affected by a condition with
the corresponding mean scores for respondents irrespective of health condition, the
INSERT TABLE 1: Mean EQ-5D scores for respondents subgrouped by health condition
These data can be used to assess the average absolute or relative effect on HRQoL compared
to the average person of a similar age who does not have the named condition, or the average
person of a similar age irrespective of health status. The condition “complaints of the
teeth/mouth or tongue” produced the largest average decrement on HRQoL compared to the
subgroup who did not have the condition (absolute = 0.345, relative = 39%) and the subgroup
from the general population (absolute = 0.344, relative = 39%). The condition “a history of
stroke” produced the second largest average decrement on HRQoL compared to the subgroup
who did not have the condition (absolute = 0.287, relative = 35%) and the subgroup from the
general population (absolute = 0.282, relative = 34%). When compared to subgroups without
the health condition, and when compared to subgroups irrespective of health status, 31/39 of
the differences in mean EQ-5D scores were greater than the minimal important difference
(|0.074|) for the EQ-5D.[8]
ii) Secondary analyses: For the subgroups who reported they had a single specific health
condition, compared to subgroups of a similar age who reported no health condition, with the
exception of respondents who had a history of “hayfever” (n=186), and respondents who had
a history of “poor hearing/deafness” (n=146) all mean EQ-5D scores were lower for the
subgroups with the condition (Table 2). 10 of the 39 subgroups had less than 64 respondents
hence were not assessed in terms of significant differences in mean scores. Of the remaining
29 pairs, compared to subgroups who reported no condition, as the confidence intervals of the
mean EQ-5D scores did not overlap for 22 comparisons the differences were significant at the
p < 0.05 level. When comparing the mean EQ-5D scores for subgroups with a single health
condition with subgroups of a similar age irrespective of health status (i.e. general
population), of the 29 subgroups involving more than 64 respondents, the mean scores were
scores did not overlap for 8 of the 13 pairs, these differences were statistically significant (p <
0.05). For the remaining 16/29 subgroups with mean EQ-5D scores smaller than those of
similar aged subgroups irrespective of health status, the CIs of the mean EQ-5D scores did
not overlap for 5/16 comparisons (p < 0.05).
INSERT TABLE 2: Mean EQ-5D scores for respondents with a single health condition
These data can be used to assess the average absolute or relative effect on HRQoL for a single
condition in isolation compared to the average person of a similar age who does not have any
condition, or the average person of a similar age irrespective of health status. The condition
“complaints of the teeth/mouth or tongue” produced the largest average decrement on
HRQoL compared to the subgroup who had no condition (absolute = 0.290, relative = 30%)
and the subgroup from the general population (absolute = 0.245, relative = 27%). The
condition “a history of stroke” produced the second largest average decrement on HRQoL
compared to the subgroup who had no condition (absolute = 0.254, relative = 27%) and the
subgroup from the general population (absolute = 0.106, relative = 13%). When compared to
subgroups without a health condition, 20/39 of the differences in mean EQ-5D scores were
greater than the minimal important difference (|0.074|) for the EQ-5D while just 12/39 of the
differences were greater than the MID when comparing to the subgroups irrespective of
health status.[8]
iii) Exploratory analyses
a) Comparing average decrements on HRQoL for cohorts with a specific health
condition (irrespective of other health conditions) with average decrements for corresponding
cohorts with just the single specific health condition. In 14 of the 39 conditions, the average
condition (versus subgroups with no condition) compared to the average decrements on
HRQoL for the subgroups with the same condition irrespective of other conditions (versus
subgroups without the specific condition irrespective of other conditions) . For example the
average relative decrement was 2% for respondents (n=1127) with just “asthma” when
compared to respondents of a similar age without any health condition versus an average
relative decrement of 10% for respondents (n=2452) with “asthma” and any other health
condition when compared to respondents of a similar age without asthma. These data suggest
comorbidities impose an additional decrement on HRQoL and the implication of this should
be considered on an individual basis when calculating decrements attributed to the alleviation
of conditions or avoidance of clinical events in economic models.
b) Comparing decrements on HRQoL across age groups
Using the full dataset, HRQoL decreased by age (Figure 1) in general irrespective of the
number of health conditions. The rate of decrease in HRQoL by age was greatest in
respondents aged over 65 years. Comparing the mean EQ-5D scores for the youngest and
oldest aged cohorts subgrouped by health status, the reduction in HRQoL was greatest for
respondents with at least one health condition.
INSERT FIGURE 1: Mean EQ-5D scores stratified by age and number of health conditions
Potential trends in decrements in HRQoL by age for the individual health conditions were
assessed visually by plotting mean EQ-5D scores for age and health condition stratified
subgroups together with the average absolute and relative decrements (Figure 2, Figure 3 &
Figure 4 supplied in the appendix). Due to small numbers in the age stratified data, these
exploratory analyses were performed for the most prevalent health conditions only and the
data were compared to respondents who did not have the relevant condition. For the cohort
(n=2484) with “ back problems/slipped disc/spine/neck” plus any other health condition, the
increased by age up to the age of 80 years (Figure 2a). This trend was also visible in the
cohort (n=1106) with just “ back problems/slipped disc/spine/neck” (Figure 2b) when
compared to respondents with no health condition. The age stratified average absolute
decrements (range 0.19 to 0.29) were similar for the cohorts with or without comorbid health
conditions. Compared to the respondents without the condition, as the CIs for the mean
EQ-5D scores did not cross, all the age stratified decrements were statistically significant at the
95% level.
INSERT FIGURE 2: Mean EQ-5D scores and decrements on HRQoL for respondents with
“back problems/slipped disc/spine/neck”
Conversely, for the cohort (n= 3172) with “hypertension/high blood pressure/blood” plus any
other condition the relative decrement on HRQoL compared to respondents without the
condition decreased by age with the largest effects observed in respondents younger than 60
years (Figure 3a). The average effect on HRQoL was much smaller across all age groups for
the cohort with just “hypertension/high blood pressure/blood” (n=974) compared to the
average effect on HRQoL for the cohort with “hypertension/high blood pressure/blood” and
any other health condition (Figure 3b).
For the cohort (n=4145) with “arthritis/rheumatism/fibrositis” plus any other health
condition, the average relative decrement on HRQoL compared to subgroups without the
condition decreased slightly by age for respondents aged over 40 years (Figure 4).
Conversely, for the cohort (n=1358) with just “arthritis/rheumatism/fibrositis” and no other
condition, compared to respondents with no health condition, the average relative decrement
on HRQoL increased by age. When comparing the mean EQ-5D scores from cohorts with
just “arthritis/rheumatism/fibrositis” with the mean EQ-5D scores for cohorts with
“arthritis/rheumatism/fibrositis” plus any other condition the confidence intervals of the mean
age and condition specific mean EQ-5D scores used in the analyses which are not discussed
in the article are provided in the online appendix.
DISCUSSION
This study provides EQ-5D scores obtained from non institutionalised residents in England
stratified by self-reported history of prevalent health condition(s) and age (where sample sizes
permit). Our results suggest that data from the general population irrespective of health status
could be used in place of condition specific data to represent the HSUVs associated with not
having a particular health condition in some analyses but not all. In particular, our analyses
show that HSUVs from the general population would not be appropriate for cohorts who have
just one health condition. In these instances, if the condition specific data are not available,
age stratified mean HSUVs from respondents who report they have none of the prevalent
health conditions could be used.
Not surprisingly, the average decrement on HRQoL compared to the condition specific
baseline was generally smaller for respondents with a single health condition compared to
respondents with the same health condition plus any comorbidities. For several conditions
the decrement was more than halved. The majority of analytic models use cohorts defined to
match those in the clinical studies used to represent the effectiveness of treatment. Therefore
the data from cohorts with comorbidities are potentially more relevant as few clinical data are
derived from patients who do not have any of the prevalent conditions, particularly in older
aged cohorts. However, some clinical studies do impose strict exclusion criteria relating to
comorbidities. Consequently the clinical and HRQoL evidence and the cohort definitions
used in economic models should be considered carefully when selecting the baseline HSUV
Our exploratory analyses suggest the decrement on HRQoL associated with health conditions
are not constant across age. Some conditions showed an increasing trend and others showed a
decreasing trend. This may be due to the prevalence of comorbidities and additional research
in this area would be beneficial. In particular research in health conditions which have a
substantial effect on HRQoL and cohorts subgrouped by severity of condition would be
interesting.
The mean EQ-5D score for individuals reporting no health condition is comparable to the
average (EQ-5D = 0.952) obtained from individuals with no condition in the US Medical
Expenditure Panel Survey (n=40,846).[10] While we found a strong trend for HSUVs to
decrease by age irrespective of health status, we observed a levelling or increase in mean
HRQoL in the age groups 65 to 70 years. This has also been reported in data collected using
several different preference-based measures in the US.[11] Comparing our results generated
using the UK EQ-5D algorithm, with the US EQ-5D values for non institutionalised US
respondents (n=3,816) in the US based National Health Measurement Study, there is a much
larger variation in age related mean EQ-5D scores in our dataset. The US mean scores ranged
from approximately 0.89 for both males and females aged between 35 and 44 years to
approximately 0.85 (0.82) for males (females) aged between 75 and 89 years. Using the data
from all respondents irrespective of health status, the mean EQ-5D scores are 0.915 and 0.650
for the subgroups aged 30 to 35 years and 80 to 85 years respectively in our data. However,
our results are comparable with those reported in a larger study using data (n=22,523) from
the US Medical Expenditure Panel Survey (2001): mean UK EQ-5D scores 0.897 (0.864) for
males (females) aged 30-39 years and 0.711 (0.622) for males (females) aged 80-89
years.[12]
There are limitations with the data used in this study. In particular the health conditions are
self-reported and no information was collected that could be used to determine either the
individual variation for respondents reporting the same health condition and this could be
partly attributable to the wide range in severity of and duration of condition included within a
single subgroup. The coded conditions are not exhaustive and it is probable that some
respondents had health conditions which are not included in the analyses. As the conditions
that are not identified are not prevalent this is unlikely to affect our main findings. The
surveys did not sample from people in nursing homes or other institutions who are likely to
have lower HRQoL on average than those residing in their own home. This is more likely to
have an effect on the HSUVs for the older aged cohorts and it could be that the actual average
EQ-5D scores for these subgroups are lower than we report. This may have an impact on the
age related trends in the decrements for the different health conditions and additional research
in this area would be interesting.
Some of the mean HSUVs for subgroups with a particular condition are lower than the
corresponding values for subgroups without the condition or those from respondents
irrespective of health status which initially appears counter intuitive. For the analyses
conducted on subgroups with just one health condition, one possible explanation for higher
HSUVs for the respondents with a condition is that the average person in the general
population will in fact have a lower HSUV as the combined decrements on HRQoL for the
prevalent conditions could be larger than the decrement for the single condition.
Decision analytic models of health care interventions require a baseline HRQoL profile to
accurately calculate the benefits of treatment. These data would ideally be derived from
respondents who do not have the exact definition of the health condition(s) being modelled.
When these data are not available, the current study provides a number of age and health
condition stratified HSUVs that can be used to assess the benefits of treatment compared to
the average person who does not have the condition. Our results suggest age adjusted HSUV
from the general population could be used as the baseline when modelling the benefits of
modelling interventions in patients with a single health condition. Our findings require
validation in additional datasets and additional research examining subgroups of patients with
ACKNOWLEDGEMENTS
The Health Survey for England is commissioned by the Department of Health and conducted
by the Joint Health Survey Unit of National Centre for Social Research and Department of
Epidemiology and Public Health at University College London. Ethical approval for the
Health Survey for England was obtained from the London Multi-Centre Research Ethics
REFERENCE
1. Brazier J. Briefing paper for methods review workshop on key issues in utility
measurement. NICE 2007. Available from: www.nice.org.uk/TAMethodsReview.
2. Fryback DG, Lawrence WF, Dollars may not buy as man QALYs as we think: A
problem with defining quality of life adjustments, Med Decis Making 1997;17;276.
3. Murray CWS, Brazier JE. Utility following a fracture in a group of elderly women.
Qual Life Res 2002;11:642
4. Manuel DG, Schultz SE, Kopec JA. Measuring the health burden of chronic disease
and injury using health adjusted life expectancy and the Health Utilities Index. J Epidemiol
Community Health 2002;56:843-850.
5. Ara R, Brazier J. Populating an Economic Model with Health State Utility Values:
Moving toward Better Practice 2010 HEDS Discussion Paper No.
http://www.sheffield.ac.uk/scharr/sections/heds/dps-2009.html
6. Joint Health Surveys Unit of Social and Community Planning Research and
University College London, Health Survey for England 200x [computer file] (3rd ed.).
Colchester, Essex: UK Data Archive, [distributer], 2008
7. Dolan P, Gudex C, Kind P, Williams A. The time trade-off method: results from a
general population study. Health Econ 1996;5:141-54.
8. Walters SJ, Brazier JE. Comparison of the minimally important difference for two
health state utility measures: EQ-5D SF-6D. Qual Life Res 2005;14:1423-32.
9. Julius SA. Using confidence intervals around individual means to assess statistical
significance between two means. Pharmaceut Statist 2004;3:217-222.
10. Fu AZ, Kattan MW. Utilities should not be multiplied; Evidence from the
preference-based scores in the United States. Medical Care 2008;46(9)984-990.
11. Fryback DG, Dunham NC, Palta M, Hanmer J, Buechner J, Cherepanov D,
Herrington S. US Norms for six generic health-related quality of life indexes from the
12. Hanmer J, Lawrence WF, Anderson JP, Kaplan RM, Gryback DG. Report of
nationally representative values for the noninstitutionalized US adult population for 7
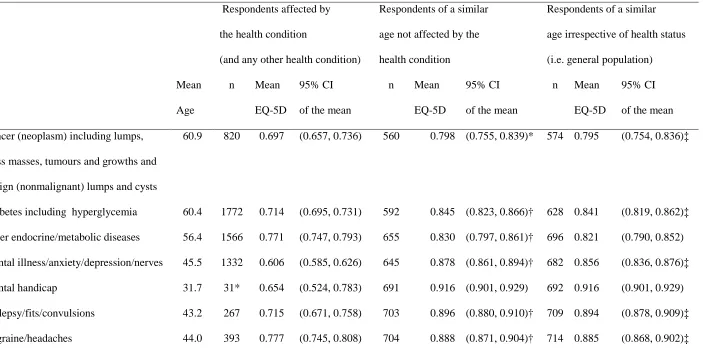
Table 1: Primary analyses, comparing mean EQ-5D scores for respondents subgrouped by health condition (plus any other health condition), respondents of a
similar age without the health condition, and respondents of a similar age irrespective of health status
Respondents affected by
the health condition
(and any other health condition)
Respondents of a similar
age not affected by the
health condition
Respondents of a similar
age irrespective of health status
(i.e. general population)
Mean
Age
n Mean
EQ-5D
95% CI
of the mean
n Mean
EQ-5D
95% CI
of the mean
n Mean
EQ-5D
95% CI
of the mean
Cancer (neoplasm) including lumps,
mass masses, tumours and growths and
benign (nonmalignant) lumps and cysts
60.9 820 0.697 (0.657, 0.736) 560 0.798 (0.755, 0.839)* 574 0.795 (0.754, 0.836)‡
Diabetes including hyperglycemia 60.4 1772 0.714 (0.695, 0.731) 592 0.845 (0.823, 0.866)† 628 0.841 (0.819, 0.862)‡
Other endocrine/metabolic diseases 56.4 1566 0.771 (0.747, 0.793) 655 0.830 (0.797, 0.861)† 696 0.821 (0.790, 0.852)
Mental illness/anxiety/depression/nerves 45.5 1332 0.606 (0.585, 0.626) 645 0.878 (0.861, 0.894)† 682 0.856 (0.836, 0.876)‡
Mental handicap 31.7 31* 0.654 (0.524, 0.783) 691 0.916 (0.901, 0.929) 692 0.916 (0.901, 0.929)
Epilepsy/fits/convulsions 43.2 267 0.715 (0.671, 0.758) 703 0.896 (0.880, 0.910)† 709 0.894 (0.878, 0.909)‡
Other problems of nervous system 52.3 926 0.584 (0.552, 0.615) 607 0.846 (0.825, 0.865)† 631 0.834 (0.813, 0.854)‡
Cataract/poor eye sight/blindness 62.8 543 0.700 (0.669, 0.731) 530 0.814 (0.786, 0.841)† 538 0.812 (0.785, 0.839)‡
Other eye complaints 61.2 470 0.741 (0.683, 0.797) 567 0.794 (0.752, 0.835) 574 0.795 (0.754, 0.836)
Poor hearing/deafness 61.2 586 0.768 (0.742, 0.794) 567 0.795 (0.753, 0.835)† 574 0.795 (0.754, 0.836)
Tinnitus/noises in the ear 61.0 125 0.749 (0.684, 0.812) 572 0.795 (0.753, 0.835) 574 0.795 (0.754, 0.836)
Meniere's disease/ear complaints causing
balance problems
60.9 154 0.704 (0.649, 0.759) 572 0.795 (0.754, 0.836) 574 0.795 (0.754, 0.836)
Other ear complaints 42.8 81 0.879 (0.826, 0.932) 708 0.894 (0.878, 0.909) 709 0.894 (0.878, 0.909)
Stroke/cerebral haemorrhage/cerebral
thrombosis
67.8 360 0.541 (0.488, 0.593) 589 0.828 (0.804, 0.851)† 603 0.822 (0.798, 0.846)‡
Heart attack/angina 68.5 929 0.628 (0.602, 0.653) 569 0.826 (0.802, 0.850)† 603 0.822 (0.798, 0.846)‡
Hypertension/high blood pressure 62.3 3172 0.777 (0.765, 0.788) 451 0.812 (0.787, 0.835) 522 0.811 (0.788, 0.832)
Other heart problems 64.0 1349 0.672 (0.649, 0.694) 496 0.802 (0.771, 0.831)† 528 0.795 (0.765, 0.824)‡
Piles/haemorrhoids including varicose
veins in anus
47.9 24* 0.778 (0.644, 0.911) 645 0.857 (0.832, 0.882) 647 0.858 (0.832, 0.882)
extremities
Other blood vessels/embolic 59.8 476 0.644 (0.611, 0.676) 619 0.846 (0.824, 0.866)† 628 0.841 (0.819, 0.862)‡
Bronchitis/emphysema 65.2 336 0.584 (0.541, 0.625) 565 0.835 (0.809, 0.860)† 577 0.828 (0.801, 0.853)‡
Asthma 44.2 2452 0.797 (0.779, 0.814) 674 0.890 (0.873, 0.907)† 714 0.885 (0.868, 0.902)‡
Hayfever 36.9 416 0.920 (0.904, 0.935) 790 0.910 (0.893, 0.925) 803 0.910 (0.894, 0.925)
Other respiratory complaints 56.1 686 0.697 (0.671, 0.723) 676 0.824 (0.791, 0.855)† 696 0.821 (0.790, 0.852)‡
Stomach ulcer/abdominal hernia/rupture 59.3 619 0.688 (0.654, 0.720) 650 0.806 (0.781, 0.830)† 668 0.804 (0.780, 0.827)‡
Other digestive complaints (stomach,
liver, pancreas, bile ducts, small intestine
duodenum, jejunum and ileum)
51.6 666 0.734 (0.707, 0.760) 620 0.836 (0.815, 0.856)† 631 0.834 (0.813, 0.854)‡
Complaints of bowel/colon (large
intestine, caecum, bowel, colon, rectum)
52.5 925 0.698 (0.665, 0.731) 609 0.832 (0.808, 0.855)† 625 0.829 (0.805, 0.852)‡
Complaints of teeth/mouth/tongue 46.8 30* 0.550 (0.346, 0.753) 651 0.895 (0.878, 0.910) 652 0.894 (0.878, 0.910)
Kidney complaints 52.7 297 0.657 (0.609, 0.703) 621 0.833 (0.809, 0.855)† 625 0.829 (0.805, 0.852)‡
Urinary tract infection 59.5 36* 0.705 (0.546, 0.862) 668 0.804 (0.780, 0.827) 668 0.804 (0.780, 0.827)
Reproductive system disorders 50.1 545 0.782 (0.757, 0.806) 662 0.865 (0.846, 0.884)† 668 0.866 (0.847, 0.885)‡
Arthritis/rheumatism/fibrositis 62.9 4145 0.597 (0.584, 0.609) 436 0.862 (0.836, 0.888)† 538 0.812 (0.785, 0.839)‡
Back problems/slipped disc/spine/neck 50.0 2484 0.649 (0.632, 0.666) 615 0.888 (0.870, 0.905)† 668 0.866 (0.847, 0.885)‡
Other problems of bones/joints/muscles 54.9 2526 0.642 (0.628, 0.656) 627 0.854 (0.833, 0.874)† 696 0.821 (0.790, 0.852)‡
Infectious and parasitic disease 44.5 79 0.676 (0.605, 0.746) 735 0.879 (0.863, 0.895)† 736 0.879 (0.863, 0.895)‡
Disorders of blood and blood forming or
organs and immunity disorders
53.7 334 0.728 (0.692, 0.764) 646 0.833 (0.812, 0.853)† 647 0.833 (0.812, 0.854)‡
Skin complaints 45.9 684 0.773 (0.733, 0.812) 675 0.855 (0.834, 0.875)† 682 0.856 (0.836, 0.876)‡
* Four subgroups with less than the sample size (64 respondents) for assessing significance were not compared for difference in mean EQ-5D scores
All CIs for mean EQ-5D overlap (p>0.05) when comparing: respondents not affected by the condition versus irrespective of health status
† CIs for mean EQ-5D do not overlap (p<0.05) when comparing: respondents with the condition versus respondents not affected by the condition
Table 2: Secondary analyses, comparing mean EQ-5D score for respondents with a single health condition, respondents of a similar age with no health
condition, and respondents of a similar age irrespective of health condition
Respondents affected by
the one health condition
(and no other health condition)
Respondents of a similar
age with no health condition
Respondents of a similar
age irrespective of health status
(i.e. general population)
Mean
Age
n Mean
EQ-5D
95% CI
of the mean
n Mean
EQ-5D
95% CI
of the mean
n Mean
EQ-5D
95% CI
of the mean
Cancer (neoplasm) including lumps,
mass masses, tumours and growths and
benign (nonmalignant) lumps and cysts
55.0 282 0.836 (0.801, 0.871) 315 0.952 (0.937, 0.965)† 670 0.835 (0.813, 0.856)
Diabetes including hyperglycemia 55.2 537 0.898 (0.883, 0.912) 315 0.952 (0.937, 0.965)† 670 0.835 (0.813, 0.856)‡
Other endocrine/metabolic diseases 48.3 422 0.924 (0.909, 0.937) 369 0.948 (0.934, 0.960) 647 0.858 (0.832, 0.882)‡
Mental illness/anxiety/depression/nerves 40.6 541 0.709 (0.685, 0.733) 535 0.955 (0.946, 0.964)† 826 0.877 (0.856, 0.897)‡
Mental handicap 26.0 11* 0.776 (0.594, 0.957) 399 0.965 (0.954, 0.976) 527 0.940 (0.927, 0.952)
Epilepsy/fits/convulsions 38.5 102 0.873 (0.837, 0.908) 500 0.953 (0.943, 0.962)† 794 0.903 (0.889, 0.916)
Other problems of nervous system 48.2 336 0.695 (0.663, 0.726) 369 0.948 (0.934, 0.960)† 647 0.858 (0.832, 0.882)‡
Cataract/poor eye sight/blindness 53.3 97 0.926 (0.897, 0.954) 302 0.936 (0.923, 0.949) 625 0.829 (0.805, 0.852)‡
Other eye complaints 49.1 95 0.894 (0.857, 0.930) 349 0.946 (0.933, 0.959)† 645 0.843 (0.802, 0.884)
Poor hearing/deafness 51.7 146 0.937 (0.914, 0.959) 315 0.931 (0.916, 0.944) 631 0.834 (0.813, 0.854)‡
Tinnitus/noises in the ear 59.2 21* 0.903 (0.816, 0.990) 273 0.923 (0.905, 0.940) 668 0.804 (0.780, 0.827)
Meniere's disease/ear complaints causing
balance problems
54.3 40* 0.893 (0.826, 0.960) 319 0.930 (0.913, 0.946) 647 0.833 (0.812, 0.854)
Other ear complaints 36.1 33* 0.926 (0.869, 0.982) 532 0.956 (0.947, 0.965) 780 0.909 (0.895, 0.923)
Stroke/cerebral haemorrhage/cerebral
thrombosis
65.8 102 0.684 (0.587, 0.780) 216 0.938 (0.917, 0.958)† 644 0.790 (0.763, 0.817)
Heart attack/angina 67.0 200 0.804 (0.768, 0.840) 193 0.935 (0.914, 0.955)† 617 0.815 (0.791, 0.839)
Hypertension/high blood pressure 59.8 974 0.916 (0.903, 0.928) 286 0.936 (0.918, 0.953) 628 0.841 (0.819, 0.862)‡
Other heart problems 58.2 366 0.822 (0.781, 0.862) 288 0.938 (0.921, 0.953)† 637 0.829 (0.808, 0.849)
Piles/haemorrhoids including varicose
veins in anus
48.2 8* 0.931 (0.822, 1.038) 369 0.948 (0.934, 0.960) 647 0.858 (0.832, 0.882)
extremities
Other blood vessels/embolic 51.8 104 0.807 (0.760, 0.852) 315 0.931 (0.916, 0.944)† 631 0.834 (0.813, 0.854)
Bronchitis/emphysema 65.0 83 0.789 (0.744, 0.834) 200 0.956 (0.939, 0.973)† 577 0.828 (0.801, 0.853)
Asthma 37.6 1127 0.931 (0.922, 0.939) 500 0.953 (0.943, 0.962)† 794 0.903 (0.889, 0.916)‡
Hayfever 35.8 186 0.961 (0.947, 0.975) 532 0.956 (0.947, 0.965) 780 0.909 (0.895, 0.923)‡
Other respiratory complaints 47.9 156 0.818 (0.778, 0.858) 369 0.948 (0.934, 0.960)† 647 0.858 (0.832, 0.882)
Stomach ulcer/abdominal hernia/rupture 52.5 124 0.891 (0.863, 0.918) 302 0.936 (0.923, 0.949)† 625 0.829 (0.805, 0.852)‡
Other digestive complaints (stomach,
liver, pancreas, bile ducts, small intestine
duodenum, jejunum and ileum)
43.9 184 0.875 (0.845, 0.903) 424 0.959 (0.949, 0.967)† 714 0.885 (0.868, 0.902)
Complaints of bowel/colon (large
intestine, caecum, bowel, colon, rectum)
44.2 282 0.878 (0.854, 0.901) 424 0.959 (0.949, 0.967)† 714 0.885 (0.868, 0.902)
Complaints of teeth/mouth/tongue 34.4 11* 0.667 (0.410, 0.924) 531 0.957 (0.947, 0.966) 763 0.912 (0.898, 0.926)
Kidney complaints 44.8 81 0.845 (0.799, 0.889) 461 0.952 (0.942, 0.960)† 736 0.879 (0.863, 0.895)
Urinary tract infection 43.8 7* 0.934 (0.822, 1.046) 424 0.959 (0.949, 0.967) 714 0.885 (0.868, 0.902)
Reproductive system disorders 41.6 174 0.882 (0.855, 0.909) 494 0.943 (0.930, 0.956)† 761 0.877 (0.846, 0.908)
Arthritis/rheumatism/fibrositis 60.1 1358 0.685 (0.662, 0.706) 286 0.936 (0.918, 0.953)† 628 0.841 (0.819, 0.862)‡
Back problems/slipped disc/spine/neck 45.5 1106 0.745 (0.727, 0.761) 461 0.952 (0.942, 0.960)† 736 0.879 (0.863, 0.895)‡
Other problems of bones/joints/muscles 48.9 942 0.731 (0.709, 0.753) 349 0.946 (0.933, 0.959)† 645 0.843 (0.802, 0.884)‡
Infectious and parasitic disease 40.8 33* 0.762 (0.698, 0.824) 535 0.955 (0.946, 0.964) 826 0.877 (0.856, 0.897)
Disorders of blood and blood forming or
organs and immunity disorders
39.7 90 0.876 (0.835, 0.915) 573 0.955 (0.945, 0.965)† 850 0.907 (0.893, 0.921)
Skin complaints 38.4 210 0.916 (0.892, 0.939) 500 0.953 (0.943, 0.962)† 794 0.903 (0.889, 0.916)
* Ten subgroups with less than the sample size (64 respondents) for assessing significance were not compared for difference in mean EQ-5D scores
All CIs for mean EQ-5D do not overlap (p<0.05) when comparing: respondents with no health condition versus respondents irrespective of health status
† CIs for mean EQ-5D do not overlap (p<0.05) when comparing: respondents with the condition versus respondents with no health condition
Figure 1: Mean EQ-5D scores stratified by age and number of health conditions
0.4 0.5 0.6 0.7 0.8 0.9 1.0
<30 30 to ≤ 35 35 to ≤ 40 40 to ≤ 45 45 to ≤ 50 50 to ≤ 55 55 to ≤ 60 60 to ≤ 65 65 to ≤ 70 70 to ≤ 75 75 to ≤ 80 80 to ≤ 85 >85 Age range (years)
M
e
a
n
E
Q
-5
D
Figure 2: Mean EQ-5D scores and average decrements on HRQoL for respondents with “back
[image:31.595.98.492.185.383.2]problems/slipped disc/spine/neck”
Figure 2a: Respondents with “back problems/slipped disc/spine/neck” and any other health
condition compared to respondents without “back problems/slipped disc/spine/neck”
22% 29% 22% 95 254 428 564 527 616 25% 28% 29% 0.22 0.20
0.23 0.23 0.24
0.15 0.0 0.2 0.4 0.6 0.8 1.0
≤ 40 40 to ≤ 50 50 to ≤ 60 60 to ≤ 70 70 to ≤ 80 >80 Age category (years)
M e a n E Q -5 D
[image:31.595.99.493.489.680.2]not back problems/slipped disc/spine/neck back problems/slipped disc/spine/neck Relative decrement Absolute decrement
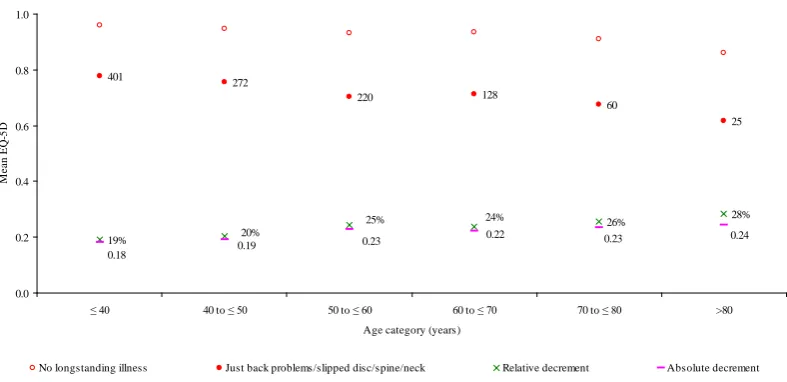
Figure 2b: Respondents with just “back problems/slipped disc/spine/neck” and no other health
condition compared to respondents with no condition
19% 26% 28% 401 272 220 128 60 25 24% 25%
20% 0.22 0.24
0.23 0.19 0.18 0.23 0.0 0.2 0.4 0.6 0.8 1.0
≤ 40 40 to ≤ 50 50 to ≤ 60 60 to ≤ 70 70 to ≤ 80 >80 Age category (years)
M e a n E Q -5 D
No longstanding illness Just back problems/slipped disc/spine/neck Relative decrement Absolute decrement
APPENDIX
Table A1: Frequencies of the health conditions
Respondents affected by the health condition
(and any other health condition)
Respondents affected by just the one health
condition
n mean age Se of the mean n ~ mean age Se of the mean
No health condition 22449 39.9 (39.6, 40.1)
Cancer (neoplasm) including lumps, mass
masses, tumours and growths and benign
(nonmalignant) lumps and cysts
820 60.9 (59.3, 62.3) 282 34% 55.0 (52.5, 57.4)
Diabetes including hyperglycemia 1772 60.4 (59.6, 61.1) 537 30% 55.2 (53.7, 56.6)
Other endocrine/metabolic diseases 1566 56.4 (55.4, 57.2) 422 27% 48.3 (46.7, 49.8)
Mental illness/anxiety/depression/nerves 1332 45.5 (44.6, 46.4) 541 41% 40.6 (39.2, 41.9)
Mental handicap 31 31.7 (26.9, 36.4) 11 35% 26.0 (19.5, 32.4)
Epilepsy/fits/convulsions 267 43.2 (41.1, 45.2) 102 38% 38.5 (35.8, 41.1)
Migraine/headaches 393 44.0 (42.2, 45.8) 132 34% 40.3 (36.9, 43.6)
Cataract/poor eye sight/blindness 543 62.8 (60.5, 65.0) 97 18% 53.3 (48.0, 58.6)
Other eye complaints 470 61.2 (58.7, 63.5) 95 20% 49.1 (44.5, 53.5)
Poor hearing/deafness 586 61.2 (59.3, 63.0) 146 25% 51.7 (48.2, 55.1)
Tinnitus/noises in the ear 125 61.0 (58.3, 63.7) 21 17% 59.2 (50.3, 68.1)
Meniere's disease/ear complaints causing
balance problems
154 60.9 (58.1, 63.5) 40 26% 54.3 (49.9, 58.6)
Other ear complaints 81 42.8 (35.7, 49.8) 33 41% 36.1 (25.4, 46.7)
Stroke/cerebral haemorrhage/cerebral
thrombosis
360 67.8 (66.3, 69.2) 102 28% 65.8 (63.1, 68.5)
Heart attack/angina 929 68.5 (67.5, 69.4) 200 22% 67.0 (65.0, 68.8)
Hypertension/high blood pressure 3172 62.3 (61.8, 62.8) 974 31% 59.8 (58.8, 60.7)
Other heart problems 1349 64.0 (62.9, 65.0) 366 27% 58.2 (56.0, 60.4)
Piles/haemorrhoids including varicose
veins in anus
24 47.9 (42.2, 53.5) 8 33% 48.2 (39.7, 56.5)
Varicose veins/phlebitis in lower
extremities
Other blood vessels/embolic 476 59.8 (58.1, 61.4) 104 22% 51.8 (48.2, 55.3)
Bronchitis/emphysema 336 65.2 (63.5, 66.8) 83 25% 65.0 (61.3, 68.6)
Asthma 2452 44.2 (43.4, 45.0) 1127 46% 37.6 (36.5, 38.6)
Hayfever 416 36.9 (35.3, 38.4) 186 45% 35.8 (33.7, 37.7)
Other respiratory complaints 686 56.1 (54.4, 57.7) 156 23% 47.9 (44.1, 51.6)
Stomach ulcer/abdominal hernia/rupture 619 59.3 (57.7, 60.7) 124 20% 52.5 (49.7, 55.2)
Other digestive complaints (stomach, liver,
pancreas, bile ducts, small intestine
duodenum, jejunum and ileum)
666 51.6 (50.1, 53.0) 184 28% 43.9 (41.1, 46.6)
Complaints of bowel/colon (large
intestine, caecum, bowel, colon, rectum)
925 52.5 (51.2, 53.8) 282 30% 44.2 (41.8, 46.5)
Complaints of teeth/mouth/tongue 30 46.8 (39.9, 53.7) 11 37% 34.4 (22.3, 46.3)
Kidney complaints 297 52.7 (50.3, 54.9) 81 27% 44.8 (40.0, 49.5)
Urinary tract infection 36 59.5 (53.9, 64.9) 7 19% 43.8 (30.0, 57.5)
Other bladder problems/incontinence 146 61.1 (57.7, 64.3) 23 16% 50.5 (41.1, 59.8)
Arthritis/rheumatism/fibrositis 4145 62.9 (62.3, 63.5) 1358 33% 60.1 (58.8, 61.2)
Back problems/slipped disc/spine/neck 2484 50.0 (49.2, 50.7) 1106 45% 45.5 (44.4, 46.5)
Other problems of bones/joints/muscles 2526 54.9 (54.0, 55.8) 942 37% 48.9 (47.5, 50.2)
Infectious and parasitic disease 79 44.5 (40.4, 48.5) 33 42% 40.8 (35.2, 46.3)
Disorders of blood and blood forming or
organs and immunity disorders
334 53.7 (49.9, 57.4) 90 27% 39.7 (36.1, 43.2)
Skin complaints 684 45.9 (44.0, 47.8) 210 31% 38.4 (36.3, 40.4)
Table A2: Additional age/health condition stratified mean EQ-5D scores for prevalent health conditions
Age Band
(years)
n mean 95% CI
of mean
n mean 95% CI
of mean
n mean 95% CI
of mean
n mean 95% CI
of mean
History of health condition* No history of health condition History of health condition No history of health condition
General population irrespective of
health status (n = 41147)
No Health condition (n=22449) Arthritis/rheumatism/fibrositis (n=4145)
<30 8083 0.9383 (0.935,0.941) 6269 0.9633 (0.960,0.965) 45 0.6865 (0.587,0.785) 8038 0.9396 (0.936,0.942)
30 to ≤ 35 3608 0.9145 (0.907,0.921) 2555 0.9564 (0.951,0.961) 62 0.6526 (0.470,0.834) 3546 0.9196 (0.913,0.925)
35 to ≤ 40 4020 0.9069 (0.900,0.913) 2675 0.9544 (0.950,0.958) 88 0.6712 (0.575,0.766) 3932 0.9121 (0.906,0.918)
40 to ≤ 45 3746 0.8824 (0.872,0.891) 2376 0.9513 (0.946,0.956) 154 0.6485 (0.595,0.701) 3592 0.8919 (0.882,0.901)
45 to ≤ 50 3294 0.8639 (0.852,0.875) 1892 0.9430 (0.936,0.949) 214 0.5859 (0.535,0.635) 3080 0.8824 (0.871,0.893)
50 to ≤ 55 3156 0.8344 (0.824,0.843) 1555 0.9345 (0.927,0.941) 384 0.5975 (0.558,0.636) 2772 0.8679 (0.859,0.876)
55 to ≤ 60 3285 0.8222 (0.811,0.833) 1400 0.9296 (0.914,0.944) 482 0.5996 (0.567,0.631) 2803 0.8585 (0.847,0.869)
60 to ≤ 65 2739 0.8072 (0.793,0.821) 1017 0.9373 (0.928,0.946) 514 0.5902 (0.552,0.627) 2225 0.8546 (0.841,0.867)
65 to ≤ 70 2993 0.8041 (0.790,0.817) 992 0.9331 (0.921,0.944) 621 0.6024 (0.565,0.639) 2372 0.8560 (0.844,0.866)
75 to ≤ 80 1895 0.7533 (0.739,0.767) 522 0.8965 (0.881,0.911) 472 0.5864 (0.555,0.617) 1423 0.8066 (0.792,0.820)
80 to ≤ 85 1199 0.6985 (0.677,0.719) 301 0.8844 (0.866,0.902) 319 0.5509 (0.513,0.588) 880 0.7518 (0.727,0.775)
>85 655 0.6497 (0.624,0.675) 154 0.8191 (0.784,0.853) 210 0.5198 (0.462,0.577) 445 0.7090 (0.682,0.735)
Hypertension/high blood pressure/blood (n = 3172) Other problems of bones/joints/muscles (n=2526)
<30 20 0.8062 (0.709,0.902) 8063 0.9386 (0.935,0.941) 202 0.7626 (0.726,0.799) 7881 0.9428 (0.939,0.945)
30 to ≤ 35 26 0.8154 (0.710,0.919) 3582 0.9153 (0.907,0.922) 136 0.7438 (0.700,0.786) 3472 0.9218 (0.914,0.929)
35 to ≤ 40 79 0.8641 (0.810,0.917) 3941 0.9077 (0.901,0.913) 142 0.685 (0.634,0.735) 3878 0.9146 (0.908,0.920)
40 to ≤ 45 108 0.7745 (0.701,0.847) 3638 0.8854 (0.875,0.894) 185 0.6794 (0.631,0.726) 3561 0.8925 (0.883,0.902)
45 to ≤ 50 200 0.8032 (0.759,0.847) 3094 0.8676 (0.855,0.879) 185 0.6407 (0.586,0.695) 3109 0.8774 (0.865,0.888)
50 to ≤ 55 306 0.7666 (0.727,0.805) 2850 0.8414 (0.831,0.851) 210 0.6021 (0.558,0.645) 2946 0.8502 (0.840,0.859)
55 to ≤ 60 416 0.778 (0.747,0.808) 2869 0.8284 (0.816,0.840) 229 0.6426 (0.601,0.683) 3056 0.8354 (0.824,0.846)
60 to ≤ 65 426 0.8089 (0.777,0.840) 2313 0.8069 (0.791,0.822) 226 0.5847 (0.536,0.632) 2513 0.8255 (0.811,0.839)
65 to ≤ 70 573 0.7849 (0.761,0.808) 2420 0.8084 (0.792,0.823) 267 0.5962 (0.530,0.662) 2726 0.8253 (0.813,0.836)
70 to ≤ 75 453 0.7749 (0.746,0.803) 2048 0.7799 (0.765,0.794) 265 0.605 (0.561,0.648) 2236 0.7988 (0.786,0.811)
75 to ≤ 80 296 0.7417 (0.709,0.773) 1599 0.7554 (0.739,0.770) 212 0.6125 (0.569,0.655) 1683 0.7719 (0.757,0.786)
>85 75 0.6853 (0.617,0.753) 580 0.6456 (0.618,0.672) 98 0.5498 (0.484,0.615) 557 0.6704 (0.642,0.698)
Back problems/slipped disc/spine/neck (n=2484) Asthma (n=2452)
<30 218 0.7623 (0.728,0.795) 7865 0.9432 (0.940,0.946) 531 0.9024 (0.886,0.918) 7552 0.9408 (0.937,0.944)
30 to ≤ 35 152 0.7035 (0.657,0.749) 3456 0.9241 (0.916,0.931) 211 0.8658 (0.832,0.898) 3397 0.9174 (0.909,0.924)
35 to ≤ 40 246 0.7193 (0.675,0.763) 3774 0.9184 (0.912,0.924) 240 0.8531 (0.817,0.889) 3780 0.9102 (0.903,0.916)
40 to ≤ 45 258 0.6573 (0.583,0.731) 3488 0.8993 (0.891,0.906) 199 0.7676 (0.670,0.864) 3547 0.8893 (0.881,0.897)
45 to ≤ 50 269 0.6728 (0.632,0.713) 3025 0.8813 (0.869,0.892) 196 0.7073 (0.591,0.823) 3098 0.874 (0.865,0.882)
50 to ≤ 55 267 0.6152 (0.565,0.665) 2889 0.8538 (0.844,0.862) 185 0.7591 (0.701,0.817) 2971 0.8392 (0.829,0.848)
55 to ≤ 60 297 0.6139 (0.571,0.655) 2988 0.8433 (0.832,0.854) 200 0.7604 (0.707,0.812) 3085 0.8262 (0.814,0.837)
60 to ≤ 65 248 0.5586 (0.488,0.628) 2491 0.8329 (0.821,0.844) 164 0.6229 (0.558,0.686) 2575 0.818 (0.804,0.831)
65 to ≤ 70 180 0.6378 (0.592,0.683) 2813 0.8155 (0.801,0.829) 174 0.7122 (0.661,0.763) 2819 0.8092 (0.795,0.823)
70 to ≤ 75 155 0.565 (0.501,0.628) 2346 0.7941 (0.781,0.806) 152 0.6909 (0.629,0.751) 2349 0.7851 (0.772,0.797)
75 to ≤ 80 99 0.5456 (0.470,0.620) 1796 0.7645 (0.750,0.778) 120 0.7168 (0.659,0.773) 1775 0.7559 (0.741,0.770)
80 to ≤ 85 66 0.549 (0.465,0.632) 1133 0.7074 (0.686,0.728) 56 0.6936 (0.594,0.792) 1143 0.6987 (0.677,0.719)
>85 29 0.5142 (0.374,0.654) 626 0.6553 (0.629,0.681) 24 0.7018 (0.624,0.778) 631 0.6474 (0.621,0.673)
<30 43 0.8595 (0.773,0.945) 8040 0.9386 (0.935,0.941) 59 0.8551 (0.809,0.900) 8024 0.9389 (0.935,0.942)
30 to ≤ 35 41 0.7271 (0.579,0.874) 3567 0.9165 (0.909,0.923) 45 0.8214 (0.736,0.906) 3563 0.9156 (0.908,0.923)
35 to ≤ 40 59 0.8312 (0.765,0.896) 3961 0.9079 (0.901,0.914) 80 0.8718 (0.814,0.928) 3940 0.9076 (0.901,0.913)
40 to ≤ 45 85 0.7321 (0.651,0.812) 3661 0.8858 (0.876,0.895) 109 0.7923 (0.734,0.850) 3637 0.8851 (0.875,0.894)
45 to ≤ 50 118 0.7611 (0.697,0.824) 3176 0.8675 (0.855,0.879) 119 0.7085 (0.543,0.873) 3175 0.8706 (0.861,0.879)
50 to ≤ 55 142 0.703 (0.644,0.761) 3014 0.8409 (0.831,0.850) 140 0.7876 (0.729,0.845) 3016 0.8368 (0.827,0.846)
55 to ≤ 60 173 0.7199 (0.669,0.770) 3112 0.8277 (0.816,0.838) 198 0.7589 (0.713,0.804) 3087 0.826 (0.814,0.837)
60 to ≤ 65 245 0.656 (0.593,0.718) 2494 0.8216 (0.808,0.834) 198 0.7905 (0.747,0.833) 2541 0.8085 (0.793,0.823)
65 to ≤ 70 303 0.7254 (0.685,0.765) 2690 0.8124 (0.798,0.826) 233 0.7942 (0.758,0.830) 2760 0.8048 (0.790,0.818)
70 to ≤ 75 279 0.7114 (0.673,0.749) 2222 0.7878 (0.774,0.801) 175 0.7487 (0.699,0.798) 2326 0.7813 (0.768,0.794)
75 to ≤ 80 167 0.6555 (0.604,0.706) 1728 0.763 (0.748,0.777) 109 0.7125 (0.651,0.773) 1786 0.7555 (0.741,0.769)
80 to ≤ 85 83 0.6977 (0.638,0.756) 1116 0.6985 (0.676,0.720) 75 0.599 (0.524,0.673) 1124 0.7043 (0.682,0.725)
>85 34 0.6214 (0.507,0.734) 621 0.651 (0.624,0.677) 26 0.5316 (0.388,0.674) 629 0.6543 (0.628,0.680)
Other heart problems (n=1349) Mental illness/anxiety/depression/nerves (n=1332)
<30 43 0.8201 (0.747,0.892) 8040 0.9389 (0.935,0.942) 188 0.6835 (0.639,0.727) 7895 0.944 (0.940,0.947)
35 to ≤ 40 28 0.8147 (0.741,0.888) 3992 0.9075 (0.901,0.913) 159 0.6232 (0.573,0.672) 3861 0.9176 (0.911,0.923)
40 to ≤ 45 43 0.628 (0.431,0.824) 3703 0.8855 (0.876,0.894) 171 0.6167 (0.564,0.669) 3575 0.8955 (0.886,0.904)
45 to ≤ 50 51 0.7086 (0.641,0.775) 3243 0.8664 (0.854,0.877) 136 0.5356 (0.463,0.607) 3158 0.8782 (0.867,0.889)
50 to ≤ 55 67 0.6759 (0.589,0.762) 3089 0.8376 (0.828,0.847) 142 0.563 (0.503,0.622) 3014 0.8458 (0.836,0.855)
55 to ≤ 60 112 0.686 (0.626,0.745) 3173 0.8269 (0.815,0.837) 147 0.5901 (0.511,0.668) 3138 0.8342 (0.823,0.844)
60 to ≤ 65 159 0.6234 (0.531,0.714) 2580 0.8189 (0.805,0.832) 78 0.5522 (0.476,0.627) 2661 0.8143 (0.800,0.828)
65 to ≤ 70 209 0.6866 (0.626,0.747) 2784 0.8132 (0.799,0.827) 57 0.6398 (0.534,0.745) 2936 0.8068 (0.793,0.820)
70 to ≤ 75 225 0.6719 (0.625,0.718) 2276 0.7892 (0.776,0.802) 48 0.5862 (0.471,0.700) 2453 0.783 (0.770,0.795)
75 to ≤ 80 186 0.6885 (0.643,0.733) 1709 0.7602 (0.745,0.774) 29 0.5762 (0.423,0.728) 1866 0.7561 (0.742,0.770)
80 to ≤ 85 127 0.6137 (0.555,0.672) 1072 0.707 (0.684,0.729) 28 0.5333 (0.384,0.682) 1171 0.7021 (0.681,0.723)
>85 83 0.5171 (0.441,0.592) 572 0.6692 (0.642,0.695) 17 0.5524 (0.361,0.743) 638 0.6523 (0.626,0.677)
Heart attack/angina (n=929) Other problems of nervous system (n=926)
<30 1 0.088 na 8082 0.9384 (0.935,0.941) 67 0.735 (0.669,0.800) 8016 0.94 (0.936,0.943)
30 to ≤ 35 2 0.4244 (-3.59,4.442) 3606 0.9148 (0.907,0.922) 36 0.7242 (0.609,0.838) 3572 0.9163 (0.908,0.923)
35 to ≤ 40 6 0.7015 (0.352,1.050) 4014 0.9072 (0.900,0.913) 77 0.6408 (0.564,0.717) 3943 0.9119 (0.905,0.918)
45 to ≤ 50 23 0.5502 (0.250,0.850) 3271 0.8664 (0.855,0.877) 86 0.5043 (0.320,0.688) 3208 0.8748 (0.865,0.883)
50 to ≤ 55 51 0.6643 (0.514,0.814) 3105 0.8374 (0.827,0.846) 107 0.4949 (0.417,0.571) 3049 0.845 (0.835,0.854)
55 to ≤ 60 103 0.5863 (0.520,0.652) 3182 0.8291 (0.818,0.840) 117 0.6003 (0.537,0.663) 3168 0.8295 (0.818,0.840)
60 to ≤ 65 112 0.6167 (0.544,0.688) 2627 0.8147 (0.800,0.828) 73 0.5558 (0.471,0.639) 2666 0.814 (0.800,0.827)
65 to ≤ 70 143 0.6687 (0.611,0.726) 2850 0.811 (0.797,0.824) 86 0.6128 (0.538,0.687) 2907 0.8091 (0.795,0.822)
70 to ≤ 75 157 0.6501 (0.594,0.705) 2344 0.7875 (0.774,0.800) 71 0.5527 (0.463,0.641) 2430 0.7851 (0.772,0.797)
75 to ≤ 80 167 0.6523 (0.598,0.706) 1728 0.7628 (0.748,0.777) 51 0.5092 (0.395,0.623) 1844 0.76 (0.746,0.773)
80 to ≤ 85 95 0.621 (0.557,0.684) 1104 0.7058 (0.683,0.727) 41 0.5189 (0.410,0.627) 1158 0.7051 (0.683,0.726)
>85 59 0.6122 (0.523,0.700) 596 0.653 (0.626,0.679) 22 0.5806 (0.416,0.744) 633 0.6519 (0.626,0.677)
Complaints of bowel/colon (n=925) Cancer (n=820)
<30 79 0.876 (0.840,0.911) 8004 0.9389 (0.935,0.942) 27 0.7952 (0.669,0.921) 8056 0.9387 (0.935,0.941)
30 to ≤ 35 58 0.7895 (0.709,0.869) 3550 0.9163 (0.908,0.923) 21 0.8435 (0.713,0.973) 3587 0.9149 (0.907,0.922)
35 to ≤ 40 71 0.7871 (0.704,0.869) 3949 0.9091 (0.902,0.915) 32 0.8461 (0.744,0.948) 3988 0.9074 (0.901,0.913)
40 to ≤ 45 65 0.5958 (0.357,0.834) 3681 0.8878 (0.879,0.895) 33 0.7186 (0.617,0.819) 3713 0.8842 (0.874,0.893)
45 to ≤ 50 64 0.6706 (0.575,0.765) 3230 0.8678 (0.856,0.879) 43 0.5728 (0.171,0.974) 3251 0.868 (0.858,0.877)
55 to ≤ 60 106 0.6808 (0.593,0.768) 3179 0.8273 (0.816,0.838) 89 0.6724 (0.600,0.744) 3196 0.8262 (0.815,0.837)
60 to ≤ 65 85 0.5847 (0.493,0.675) 2654 0.8138 (0.799,0.827) 84 0.6737 (0.607,0.739) 2655 0.8113 (0.797,0.825)
65 to ≤ 70 100 0.7257 (0.658,0.793) 2893 0.8063 (0.792,0.819) 133 0.7297 (0.652,0.807) 2860 0.8078 (0.794,0.821)
70 to ≤ 75 89 0.6455 (0.575,0.716) 2412 0.7841 (0.771,0.796) 109 0.6819 (0.609,0.754) 2392 0.7831 (0.770,0.795)
75 to ≤ 80 65 0.6319 (0.529,0.734) 1830 0.7577 (0.743,0.771) 122 0.6599 (0.595,0.724) 1773 0.76 (0.745,0.774)
80 to ≤ 85 38 0.5881 (0.457,0.719) 1161 0.7019 (0.680,0.723) 47 0.6627 (0.567,0.758) 1152 0.6998 (0.678,0.721)
Figure 3: Mean EQ-5D scores and decrements on HRQoL for cohorts with
[image:43.595.98.494.184.381.2]“hypertension/high blood pressure/blood”
Figure 3a: Respondents with “hypertension/high blood pressure/blood” and any other health
condition compared to respondents without “hypertension/high blood pressure/blood ”
9% 269 749 999 722 308 125 -1% 1% 10% 7% 1% 0.01
0.08 0.08 0.06
0.01 -0.01 -0.2 0.0 0.2 0.4 0.6 0.8 1.0
≤ 40 40 to ≤ 50 50 to ≤ 60 60 to ≤ 70 70 to ≤ 80 >80
Age category (years)
M e an E Q -5 D
[image:43.595.98.497.490.695.2]not hypertension/high blood pressure/blood hypertension/high blood pressure/blood Relative decrement Absolute decrement
Figure 3b: Respondents with just “hypertension/high blood pressure/blood”and no other
health condition compared to respondents with no condition
1% 57
128 256 292 184
57 0% 0% 4% 2% 10% 0.08 0.00 0.00 0.04 0.01 0.01 0.0 0.1 0.2 0.3 0.4 0.5 0.6 0.7 0.8 0.9 1.0
≤ 40 40 to ≤ 50 50 to ≤ 60 60 to ≤ 70 70 to ≤ 80 >80 Age category (years)
M e an E Q -5 D
No longstanding illness Just hypertension/high blood pressure/blood Relative decrement Absolute decrement
Figure 4: Mean EQ-5D scores and decrements on HRQoL for cohorts with
[image:44.595.97.491.185.362.2]“arthritis/rheumatism/fibrositis”
Figure 4a: Respondents with “arthritis/rheumatism/fibrositis” and any other health condition
compared to respondents without “arthritis/rheumatism/fibrositis”
28% 27% 27%
529 1052 1135 866 368 195 30% 31% 31% 0.20 0.26 0.26 0.27 0.26 0.22 0.0 0.2 0.4 0.6 0.8 1.0
≤ 40 40 to ≤ 50 50 to ≤ 60 60 to ≤ 70 70 to ≤ 80 >80 Age category (years)
M e a n E Q -5 D
[image:44.595.99.493.494.683.2]not arthritis/rheumatism/fibrositis arthritis/rheumatism/fibrositis Relative decrement Absolute decrement
Figure 4b: Respondents with just “arthritis/rheumatism/fibrositis” and no other health
condition compared to respondents with no condition
25% 28%
32%
110 149 304
361
283
151
21% 25% 27%
0.26 0.24 0.20 0.24
0.26 0.27 0.0 0.2 0.4 0.6 0.8 1.0
≤ 40 40 to ≤ 50 50 to ≤ 60 60 to ≤ 70 70 to ≤ 80 >80 Age category (years)
M e a n E Q -5 D
No longstanding illness Just arthritis/rheumatism/fibrositis Relative decrement Absolute decrement