This is a repository copy of Synthesis of ZnO nanoparticles by flame spray pyrolysis and
characterisation protocol.
White Rose Research Online URL for this paper:
http://eprints.whiterose.ac.uk/81390/
Version: Accepted Version
Article:
Wallace, R, Brown, AP, Brydson, R et al. (2 more authors) (2013) Synthesis of ZnO
nanoparticles by flame spray pyrolysis and characterisation protocol. Journal of Materials
Science, 48 (18). 6393 - 6403. ISSN 0022-2461
https://doi.org/10.1007/s10853-013-7439-x
[email protected] https://eprints.whiterose.ac.uk/
Reuse
Unless indicated otherwise, fulltext items are protected by copyright with all rights reserved. The copyright exception in section 29 of the Copyright, Designs and Patents Act 1988 allows the making of a single copy solely for the purpose of non-commercial research or private study within the limits of fair dealing. The publisher or other rights-holder may allow further reproduction and re-use of this version - refer to the White Rose Research Online record for this item. Where records identify the publisher as the copyright holder, users can verify any specific terms of use on the publisher’s website.
Takedown
If you consider content in White Rose Research Online to be in breach of UK law, please notify us by
1
Synthesis of ZnO Nanopartcles by Flame Spray Pyrolysis and Characterisation Protocol R. Wallace1, A. P. Brown1, R. Brydson1, K. Wegner2, S. J. Milne1
1. Institute for Materials Research, SPEME, University of Leeds, LS2 9JT, UK
2. Particle Technology Laboratory, Department of Mechanical and Process Engineering, ETH Zurich, CH-8092 Zurich, Switzerland
Abstract
This paper reports detailed characterisation of a zinc oxide (ZnO) nanopowder synthesized by a flame
spray pyrolysis method. Detailed characterisation of the powder was carried out following a protocol
that aims to determine key physicochemical characteristics that may affect its toxicity. Analysis by X-ray
diffraction, (XRD), transmission electron microscopy (TEM) and surface area measurements confirmed
monophasic hexagonal wurtzite ZnO nanoparticles with a specific surface area of 59 m2/g. Histograms
derived from TEM analysis are presented to illustrate the polydispersity within the sample; particles
were elongated in the c-crystallographic direction, with average length ~ 23 nm and width ~14 nm.
Dynamic light scattering (0.1 w/v % in deionised water, pH 7.4) revealed the particles were
agglomerated with a modal secondary particle size of ~ 1.5 μm. Fourier transform infra-red spectroscopy
and X-ray photoelectron spectroscopy indicated the presence of carbonate impurities on the surface of
the ZnO nanoparticles.
Introduction
Zinc oxide (ZnO) is a wide band gap semiconductor material (approximately 3.37 eV at 300 K) which has
received great interest for its potential applications in the electronics and photonics industries (Johnson
et al. 2004; Onreabroy et al., 2006). In addition, ZnO is used in medical and healthcare applications due
to its antibacterial behaviour (Zhang et al. 2006). Nano-sized ZnO particles are of particular interest in
numerous applications due to performance enhancements associated with nano-dimensions
(Padmavathy and Vijayaraghavan, 2008; Yamamoto, 2001). Nanoparticles of ZnO are added to some
sunscreens due to the broad range of absorbance both in the UV A and B range (Mitchnick et al. 1999).
They exhibit high visible transparency, and superior biocompatibility to organic UV filters (Gustavsson et
2
S. 2005). Synthesis of large quantities of high purity, homogenous nanoparticulate ZnO is therefore
important in order to supply the needs of industry.
Nanoparticles of ZnO have been prepared by physical methods, such as milling and grinding, (Shen
2006); by thermal evaporation of ZnO (Wang, 2004) or evaporation and oxidation of zinc (Wu et al.,
2000); and by chemical solution synthesis routes such as hydrothermal synthesis (Suchanek, 2009;
Baruah and Dutta 2009), sol-gel (Meulenkamp 1998; Mondelaers et al., 2002) and precipitation from
both aqueous and non-aqueous solvents (Jézéquel et al., 1995, Hsieh et al., 2007). However, despite the
wide variety of wet chemical methods, the majority of ZnO is produced in industry by gas phase
synthesis through oxidation of Zn vapour (Auer et al, 2009). Gas phase synthesis is suitable for preparing
ZnO nanoparticles with high crystallinity as the reaction occurs at very high temperatures over a short
time span.
Flame aerosol synthesis is a promising, scalable alternative gas-phase production method for zinc
oxide nanoparticles. Here, a gaseous (vapor-fed aerosol flame synthesis, VAFS), liquid (flame-assisted
spray pyrolysis, FASP, and flame spray pyrolysis, FSP) or solid precursor is introduced into a flame and
converted to nanoparticles (Teoh et al., 2010). For instance, Jensen et al. (2000) produced ZnO
nanoparticles of 25-40 nm diameter via VAFS by subliming zinc acetylacetonate into nitrogen carrier gas
and feeding the vapor to a premixed methane-air flame. Matsoukas and Friedlander (1991) introduced
an aerosol of solid zinc nitrate particles into a diffusion flame and studied the evolution of the size
distribution for the resulting ZnO nanoparticles. However, delivery of a liquid precursor into the flame
may be the most effective route, since a broad range of less volatile raw materials is available that can
be dissolved in organic solvents or even water, allowing relatively simple liquid precursor handling and
dosing. In particular, flame spray pyrolysis (Bickmore et al., 1996; Mädler et al., 2002) that benefits from
self-sustaining high temperature flames has been shown to be a versatile and scalable method for the
production of single- and multi-component oxide and even metal nanoparticles, as is apparent from
recent reviews (Teoh et al., 2010; Athanassiou et al., 2010; Strobel and Pratsinis 2007).
ZnO nanoparticle synthesis with liquid-fed flame reactors in FASP mode has been studied by
Marshall et al. (1971), spraying an aqueous solution of zinc acetate into a town gas-air burner. Carroz et
al. (1980) produced ZnO nanoparticles of 200 nm diameter by FSP of zinc nitrate solutions in ethanol
and methanol. Tani et al. (2002) used FSP to produce zincite nanoparticles employing zinc acrylate as the
precursor and methanol as the solvent. Product particle diameters obtained from nitrogen adsorption
ranged from 10 nm to 18 nm; size increased as the rate of supply of the precursor solution to the flame
3
elongated, in agreement with Strobel and Pratsinis (2011) who observed formation of ZnO nanoparticles
with ≈ 1.5 aspect ratio by FSP employing a zinc-nitrate hexahydrate / ethanol solution. Liewhiran and
Phanichphant (2007) reported mainly spheroidal ZnO nanoparticles with occasional hexagonal and
rod-like structures in FSP synthesis from zinc-naphthenate/toluene/acetonitrile precursors for application in
gas sensors. Height et al. (2006) made pure as well as doped ZnO nanoparticles and rods by FSP
conversion of a zinc-naphthenate/toluene precursor solution. The undoped ZnO particles were
predominantly spherical with individual elongated structures.
There is concern surrounding the potential toxicity of engineered nanomaterials to humans and the
environment, a topic which at present is not fully understood. As a consequence, extensive research is
currently being conducted aimed at investigating the toxicity of nanomaterials. ZnO nanoparticles
produced by FSP have been used for toxicological investigation. George et al. (2010) and Xia et al. (2008)
implemented FSP produced nanoparticles into cytotoxicity screening tools and Li et al. (2011)
investigated the bacterial toxicity of the particles. The ZnO nanoparticles for the studies were produced
by dissolving zinc naphthenate precursor in xylene organic solvent. Although particle size was
determined by BET and XRD, there was no statistical analysis of size distribution and morphologies of
particles present in the TEM sample. Xia et al. (2008) and George et al. (2010) proposed in-vitro
toxicological screening to rank engineered nanomaterials for priority in-vivo testing and chose FSP-made ZnO nanoparticles as one system to study the induction of cellular responses.
The aim of the present work was to synthesize and thoroughly characterize a set of ZnO nanoparticles
that in future could be used for studies aimed at investigating the relationship between particle
properties and toxicity. It is essential to develop a protocol to characterize the physicochemical
properties of the test powders. Data on toxicity will be reported in future publications. Understanding
this relationship was a key aim of the European Union funded project ENNSATOX (www.ennsatox.eu) for
which this research was carried out. The ZnO particles for the project were required to be around 20 nm
in size with a narrow size distribution. Here we report the synthesis of ZnO nanoparticles by a flame
spray pyrolysis technique that has been adapted in order to attempt to produce nanoparticles of this
size. The precursor solution comprised zinc naphthenate dissolved in toluene. To properly inform the
follow on toxicological investigations, it was essential that a detailed particle characterisation protocol
was followed to ensure essential information about the morphology, size, composition and
4
(XRD), transmission electron microscopy (TEM), energy dispersive X-ray spectroscopy (EDX), selected
area electron diffraction (SAED), Fourier transform infra-red spectroscopy (FTIR), thermal gravimetric
analysis (TGA) with evolved gas analysis (EGA), and X-ray photoelectron spectroscopy (XPS) of the dry
powder, and dynamic light scattering (DLS) of the powder in suspension.
Experimental
In contrast to the previous studies, zinc naphtenate (STREM; 65% in mineral spirits, 10 wt % Zn) was
chosen as the Zn precursor and was diluted with toluene (Sigma Aldrich) to give a Zn concentration of
0.5 mol/l. The precursor solution was delivered to the flame at a rate of 5ml/min with the help of a
syringe pump (Lambda, VIT-FIT) and atomized with coflowing 5 l/min of oxygen dispersion gas at 3 bar
pressure drop. The oxygen and methane supporting flame feed rates were 2.5 l/min and 1.25 l/min
respectively. The flow rates of all gases (PanGas, ≥ 99.5%) were adjusted with calibrated mass flow
controllers (Bronkhorst EL-FLOW) and are reported at 25°C and 1 atm. Product nanoparticles were then
collected on glass-fiber filters (Whatman GF 6, 254 mm diameter) with the help of a vacuum pump
(Busch Seco SV1040).
Phase analysis and crystallite size estimation of the bulk powder was achieved by X-ray powder
diffraction (XRD) using a Philips PANalytical X’Pert X-ray diffractometer with a CuKα X-ray source
scanning over a range of 5-80° 2θ. Furthermore, the sample was analysed by TEM using a Phillips FEI
Tecnai TF20 field emission gun TEM operating at a gun voltage of 200 kV, fitted with an Oxford
Instruments INCA 350 energy dispersive X-ray (EDX) system/80mm X-Max silicon drift detector (SDD)
and Gatan Orius SC600A charge-coupled device (CCD) camera. Bright field images of the sample were
taken to obtain information about particle size and morphology. Energy dispersive X-ray spectroscopy
(EDX) was performed on the sample to obtain compositional information and identify any potential
impurities. The specific surface area (SSA) of product powders was measured using N2 gas adsorption
employing the BET isotherm. The BET-equivalent diameter of the particles was calculated assuming
monodisperse spheres and a zinc oxide density of 5.606 g/cm3 from eq. 2:
dBET = 6000 / (SSA x ρ), (Eq. 2)
where dBET is the average primary particle size (nm), SSA the specific surface area (m 2
/g) and ρ the
5
A Thermo Scientific IS10 Fourier transform infrared spectrometer (FTIR) with an attenuated total
reflection accessory (ATR) was employed to identify carbonate, hydroxyl or other contaminants. A
Shimadzu TGA 50 thermogravimetric analyser was used to monitor any changes in mass when the ZnO
powder was heated, to further investigate phase purity. Evolved gases were analysed by a Thermo
Scientific IS10 FTIR spectrometer with a Thermo Scientific FTIR/TGA interface attached. The sample was
heated from 10˚C to 800°C, at a rate of 10°C/min in air; an FTIR spectrum was acquired every minute in
order to identify the gases evolved. X-ray photoelectron spectroscopy (XPS) was carried out to
investigate the presence of impurities on the surface of the sample, complimenting FTIR studies. XPS
measurements were performed using a VG Escalab 250 XPS with monochromated aluminium K-α X-ray
source (Spot size diameter = 500 μm; Power = 150 W). The binding energy scale was calibrated by
setting the carbon 1s peak to 285 eV. Spectra were analysed using mixed Gaussian-Lorentzian peak
fitting within the processing software CasaXPS. Dynamic light scattering (DLS) measurements were
carried out using a Malvern Zetasizer Nano ZS instrument and data manipulation was performed by the
DTS Nano software to determine the particle size distribution. The powder was dispersed in deionised
MilliQ water (with a resistivity of 15 MΩ.cm) at a concentration of 0.1 % w/v. The suspension was then
ultrasonically agitated for 20 minutes, before DLS analysis.
Results and Discussion
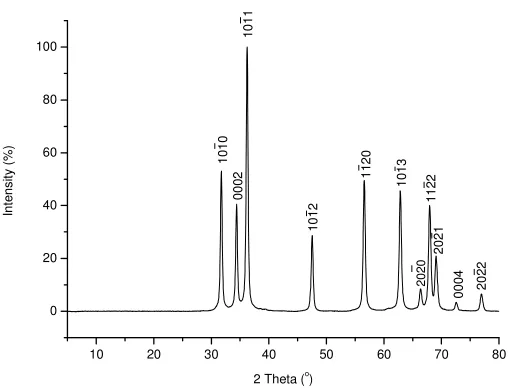
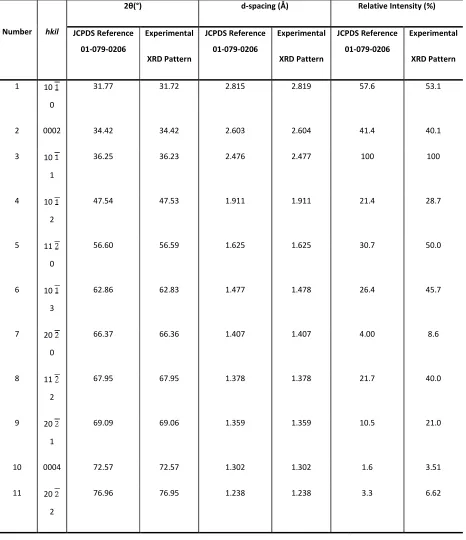
TheXRD pattern collected from the synthesised powder is shown in Figure 1 with the Miller indices of
the planes indicated above each peak. The pattern is consistent with that from the JCPDS reference file
for the hexagonal-close-packed Wurtzite structure of zincite (ref: 01-079-0206), see Table 1, that has
also been observed in other flame-synthesized ZnO powders (Tani et al., 2002; Height et al., 2006;
Liewhiran et al., 2007). The average crystallite size was estimated from each of the peaks using the
Scherrer equation (Cullity, 2001) and using all of the values obtained, an average crystallite size of 22 nm
was calculated. The (0002) peak was slightly narrower than the other peaks indicating a slightly larger
crystallite size along these planes. This may be attributed to the presence of a number of elongated
particles in the sample, as ZnO grows favourably in the [0001] direction, as is confirmed by TEM below.
The specific surface area was determined as 59.0 m2/g corresponding to an average primary particle
diameter of 18 nm which is in good agreement with XRD crystallite size estimation and indicates that
particles are predominantly single crystals.
The crystallite and primary particle sizes here are consistent with Height et al. (2006) using the
6
undoped ZnO nanopowder they obtained a specific surface area of 53 m2/g while the average crystallite
sizes determined from the (0002) and (1010) peaks were 27 and 18 nm, respectively. The additional
oxygen sheath gas in the experiments of Height et al. (2006) might have resulted in a hotter flame and
slightly larger particles by increased particle residence times in the flame. Liewhiran and Phanichphant
(2007) obtained somewhat smaller average primary particle and crystallite sizes of 16.8 nm (63.8 m2/g)
and 18 nm, respectively, but used a toluene /acetonitrile (ΔHC=-1256 kJ/mol) solvent mixture with lower
enthalpy of combustion compared to pure toluene (ΔHC=-3910 kJ/mol) at otherwise similar synthesis
conditions. Thus, smaller particles grown in shorter and colder flames are expected. Interestingly, Tani
et al. (2004) produced similar-sized particles with 58 m2/g from a methanol-based solution fed at 4
ml/min and dispersed with 3.85 l/min oxygen (pilot flame: 1.58 l/min CH4 and 1.52 l/min O2). Given the
low combustion enthalpy of methanol (ΔHC= -726.1 kJ/mol) and shorter high temperature residence
times, smaller product primary particles than from the toluene-based flame here would have been
expected.
TEM images of the ZnO nanoparticles show the interparticle variation in size and morphology to
have only a small distribution (Figure 2). The inset in Fig. 2(a) is of the selected area electron diffraction
of the cluster of particles visible in Figure 2(a). The d-spacings in the material, calculated from
measurement of the ring diameters in the SAED pattern shown in Figure 2(a), are in good agreement
with XRD data for Zincite (ref: 01-079-0206). The high resolution TEM image in Figure 2(b) shows the
clearly discernible lattice planes of a highly crystalline material. The indicated d-spacing of these planes
is 2.819 Å which corresponds to the d-spacing of the {1010} planes of the ZnO crystal (JCP-DS ref:
01-079-0206). This indicates that the preferred direction of growth of the elongated ZnO particles is in a
direction parallel to the {1010} planes, supporting the assumption that the ZnO nanoparticles in this
sample grow preferentially along the c-axis, <0001>, as is typically observed with gas-phase synthesis
techniques (Wang, 2004). The widths and lengths of 250 particles were measured and the data are
presented in histograms (Figure 3). Figure 3 (a) shows the distribution of particle lengths with an
average value of 23 nm and a median of 22 nm. Figure 3 (b) shows the distribution of particle widths
with an average value of 14 nm and a median of 12 nm. The Feret ratios for each particle measured are
presented in Figure 3 (c) and the data indicate that the majority of particles are elongated with an
average Feret ratio of 1.6. The Feret ratio histogram is skewed positively with a median value of 1.4 and
mode of 1.3, indicating that the majority of the particles have a lower Feret ratio than the mean
7
lengths and widths, the size values are in good agreement with both BET and XRD crystallite size
determinations. The particle morphologies here qualitatively resemble those observed by Liewhiran and
Phanichphant (2007) even though the authors reported mainly spheroidal with occasional hexagonal
and rod-like particles consistent with Height et al. (2006). The ZnO nanoparticles obtained by Tani et al.
(2000) at their highest precursor feed rate of 4 ml/min are also elongated, but no aspect ratio was
reported. Strobel and Pratsinis (2011) qualitatively estimated an aspect ratio of 1.5 for their ZnO
particles from zinc nitrate precursor solutions. These results show that average primary particle or
crystallite size data is insufficient to characterize flame-made zinc oxide nanopowders but a quantitative
particle size and shape analysis should be carried out.
Particle size distribution data obtained by DLS for nanoparticles suspended in water at a final solution
pH of 7.4, are shown in Figure 4. The light scattering profile of the suspension is converted into plots of
intensity, volume and number using the instrumental software. The Rayleigh approximation states that
the intensity of light scattered by a particle is proportional to the diameter of the particle (I α d6). The
intensity profile in Fig. 4(a) displays a modal peak at 1500 nm, a secondary peak at 185 nm and two
smaller peaks at 550 and 5500 nm. The intensity plot shows the relative intensity of light scattered by
each of the size groups. The volume profile displayed in Figure 4 (b) has a modal peak at 180 nm, a
secondary peak at 1500 nm and two smaller peaks at 550 nm and 5500 nm. The volume plot is formed
by conversion of the intensity profile using Mie theory which takes into account the greater relative
scattering of the larger particles compared to the small (Malvern, 2000), and hence explains the switch
between the relative size of modal and secondary peaks. The number profile shown in Fig. 4(c) is
derived from the volume plot and displays the relative percentage of particles in each size class. The
number plot displays the narrowest particle size distribution, however as it is derived using a
mathematical approximation and is not necessarily the most accurate. The plot has a principal peak at
160 nm indicating that the majority of the nanoparticles (with an average primary particle size of 18 nm)
in the suspension are agglomerated into clusters of particles. The secondary peak at 500 nm accounts
for a much smaller fraction of larger agglomerates present in the suspension. Although the number
profile indicates that the majority of the agglomerates present in the sample are below 800 nm, it does
not show the extremely low fraction of agglomerates present that are greater than 1000 nm in
hydrodynamic diameter, as shown by the intensity and volume plots.
The DLS measurements were taken immediately after the sample was removed from the ultrasonic bath
8
unstable with the particles sedimenting within minutes of being removed from the ultrasonic bath. This
can be explained by the solution pH of 7.4 which is relatively close to the isoelectric point of ZnO at pH
8.4. ADD REF Particle stability must be taken into account in toxicological assays which invariably take
place in a liquid medium. The degree of particle agglomeration in suspensions will be affected by the
dispersing medium i.e. the presence of salts and protein serum can affect nanoparticle stability
(Hondow et al. 2012).
Figure 5(a) shows the FTIR spectrum obtained for the as-prepared sample. The strong band ≤ 550 cm-1 is
characteristic of the broad band of absorption that indicates ZnO lattice bonding (Umar et al., 2009;
Wahab et al.; 2009, Li et al., 2010). The band at ~ 1700 cm-1 is characteristic of C=O stretching of an
organic carbonyl group. It may be due to aldehyde, ketone or carboxylic acid compounds that have
formed due to partial decomposition of the precursor compound zinc napthtenate in the toluene-
fuelled flame during the synthesis process. The band at 3400 cm-1 relates to the O-H stretch of the
hydroxyl vibration and hence indicates hydration of the sample. Literature reports that the characteristic
band here for O-H occurs between 3200-3600 cm-1 (Socrates, 2001), however the band present in the
current sample spectrum continues down to 2800 cm-1.It is likely that the O-H band is masking another
absorption band that can most probably be attributed to the asymmetrical stretch of a C-H bond
present in the carbonyl containing compound mentioned above. The overlapping bands at 1400, 1250
and 750 cm-1 are characteristic of inorganic carbonate which are known to have absorption bands at
1160 cm-1, 1100-1040 cm-1 and between 900-800 cm-1 (Socrates, 2001; Chowdury et al.). This is likely to
be present as a result of absorbed CO2.
The FTIR spectrum in Fig 5(b) is of an aged sample of the powder and, as expected, the bands occurring
as a result of sample hydration and carbonation increase in strength. Formation of surface carbonates
and hydroxides is typically observed with zinc oxide exposed to ambient air since ZnCO3 is a stable
phase if CO2 is present, while Zn(OH)2 is close to stability in humid air (Klimm et al., 2011). Thus it must
be taken into account that ZnO surfaces exposed to air may easily form layers of carbonate and/or
hydroxide not only by adsorption but also by chemical reaction (Klimm et al., 2011). The FTIR spectrum
in Fig. 5(c) was obtained immediately after the sample had been heated to 950°C in order to investigate
whether the presence of carbonate, hydroxyl and potential organic contaminants on the surface were
diminished. The O-H, C=O and C=H peaks were no longer detectable, suggesting that all of the moisture,
as well as the substance responsible for the suspected C=O and C-H bands, was removed during high
9
to sinter into larger particles (Figure 8). A sharpening and decrease in intensity of absorbances due to
inorganic carbonate bands is observed indicating a reduction, but not removal of the surface carbonate
phase. Either the treatment temperature was still too low for full chemical decomposition of the
carbonate, since a ZnO wafer showed a well-structured surface only after annealing at 1150°C in oxygen
(Klimm et al., 2011), or the entire surface-carbonate was removed during heat treatment but transferral
from the furnace to the FTIR instrument resulted in a limited degree of re-carbonation even in the short
time the surface was exposed to air.
XPS was carried out in order to investigate the surface composition of the ZnO nanoparticles in greater
detail. XPS is usually carried out on a graphite substrate, however as the carbon content in the sample
was of interest, indium was used instead. XPS was performed close to the time of synthesis of the
sample (T=1 month), and then again 8 months later (T=9 months) in order to investigate the extent to
which the sample was absorbing atmospheric CO2. The C1s region of the XPS spectra for both samples
are shown in Figure 6 and indicate that the carbon content increases substantially, in agreement with
FTIR analyses on ageing. Three different carbon species are identified by XPS, each of which can be
identified by the binding energy at which the peak occurs. The peak at 285 eV corresponds to a C-H
bonded C atom and the peak at 288.9 eV is indicative of a carbon in a carboxylic acid, ketone or
aldehyde (already suggested by FTIR). The peak at 286.5 eV is likely to be indicative of absorbed CO2 to
form ZnCO3 on the nanoparticle surface. This is also consistent with the FTIR findings (Fig. 5). The
estimated amount of carbonate species present in the analysed surface region of the sample, expressed
as a percentage of total carbon content, increases from 10 % at T = 1 month to 25 % at T = 8 months.
This carbonate/hydroxide layer can constitute a significant weight fraction of high surface area
nanoparticles and significantly affect their chemical and physical properties. Solubility for example is
emerging as a key factor in understanding ZnO toxicity (Reed et al., 2012; Xia et al., 2008).
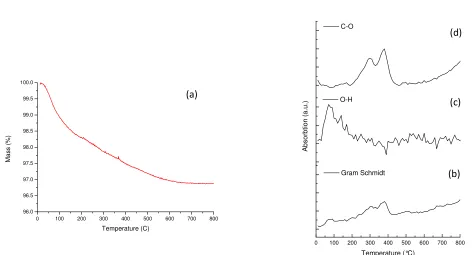
Figure 7(a) shows the results of a TGA experiment performed on the sample with the mass expressed as
a percentage of the total initial starting mass. Evolved gas analysis was performed on the sample in
order to confirm the composition of the gases evaporating from the sample during TGA. The
Gram-Schmidt plot shown in Figure 6(b) shows how the total IR absorbance changes as the temperature rises.
The reduction in mass observed in Figure 7(a) can be explained by the increase in overall absorbance
observed in the Gram-Schmidt plot (Figure 7(b)). The steep drop observed in Fig. 7(a) between 50°C and
150°C in which the sample loses around 1.5% of its total mass can be explained by water vapour, already
10
the absorbance detected in the range 1500-1900 cm-1, indicative of O-H bending, increasing in intensity
over the same temperature range, 50°C to 150°C. There is then a more gradual reduction in weight
between 150 and 650°C where the sample loses around 2% of its total mass. This may be surface zinc
carbonate, which has already been identified by FTIR and XPS, decomposing to form carbon dioxide.
Evidence for this is observed in Figure 7(d) which shows two peaks of absorbance in the range
2250-2400 cm-1, indicative of carbon dioxide evolving between 200 and 500°C. There is a possibility that CO2
may also be formed by decomposition of residual organic precursors present on the surface of the
particles, for which there was evidence from XPS and FTIR. During synthesis, the maximum flame
temperature is around 2200 - 2700°C (Mädler et al., 2002; Gröhn et al., 2012), yet out investigations
infer that some of the precursor derivatives do not fully decompose. This may be because the particles
experience the flame temperature for a fraction of a second, whereas in TGA analysis, despite the lower
temperatures the dwell times are much longer (heating rate 10°C/s) enabling decomposition reactions
to proceed to completion. Moreover, Gröhn et al. (2011) also observed individual precursor droplets
escaping the spray that might contaminate the product ZnO nanoparticles on the collection filter.
Figure 8(a) shows a TEM image of the sample after heating to 800°C for TGA and reveals that the
particles have sintered into larger entities with an average particle size of around 250 nm. The crystalline
structure of the powder does not change however, as the ring pattern in Figure 8(b) confirms hexagonal
phase zincite.
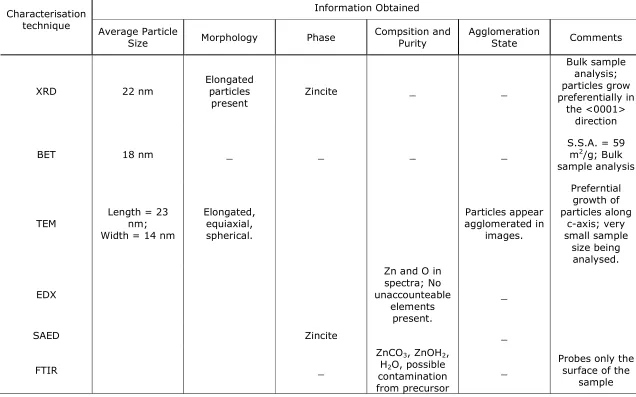
In summary, the characterisation protocol followed in this study has provided detailed information on
the particle size and morphology, structure, and surface composition of the FSP ZnO nanoparticles. This
information is essential to better understand the relationship between nanoparticle properties and any
toxic effects they may exhibit. This protocol involved X-ray diffraction (XRD), BET specific surface area
analysis, transmission electron microscopy (TEM), energy dispersive X-ray spectroscopy (EDX), selected
area electron diffraction (SAED), Fourier transform infra-red spectroscopy (FTIR), thermal gravimetric
analysis (TGA) with evolved gas analysis (EGA) and X-ray photoelectron spectroscopy (XPS) of the dry
powder and dynamic light scattering (DLS) of the powder suspended in MilliQ water. The results
obtained for each of the techniques, are summarised in Table 2. The protocol may be used in future
studies for the purposes of characterising nanoparticle samples for toxicological studies.
For the ZnO powder, XRD and BET techniques gave average particle sizes in good agreement, ~ 18-22 nm
nm. However, the value determined from these techniques uses formulae that assume spherical
11
particles present in the sample that grew preferentially along the <0001> axis. Quantitative particle
analysis by TEM imaging revealed elongated nanoparticles with an average Feret ratio of 1.6. These
results highlight the importance of characterising a sample using TEM to determine a detailed overview
of the distribution of sizes and morphologies present in a sample. Suspensions were thoroughly mixed
prior to drop casting TEM grids, to increase the probability that TEM samples were representative.
Individual measurements of 250 particles enabled histograms to be produced which indicated the
polydispersity in size and shape within the TEM specimen. This additional information on particle size
and shape will be invaluable when comparing toxicology results for different powders. Solubility studies
in relevant biological media would complement the detailed basic physio-chemical characterisation
reported here (Xia, 2008).
FTIR, XPS and TGA revealed the presence of various forms of carbon species present in the material. It is
likely that these compounds are a result of carbonation of the surface of the nanoparticles from storage
in air, and although inconclusive at present, there may be organic compounds present formed by
combustion of the precursors used in the synthesis procedure. Another possible source of
contamination of the sample may have arisen from the glass-fiber filters on which the particles are
collected during synthesis, which contain an organic binder. The use of toluene as the precursor solvent
combined with a faster feed rate of 5 ml/min did not appear to produce particles significantly larger
than those synthesized by Tani et al. (2009).
Conclusions
ZnO nanoparticles have been synthesised for by a flame spray pyrolysis technique, and a
characterisation protocol implemented to determine the physicochemical properties of the powders.
Many of the hexagonal wurtzite ZnO particles were elongated in the c -direction: mean particle lengths
were 23 nm and widths 14 nm. Surface areas were 59 m2/g. Carbonate and hydroxide surface phases
were identified using a combination of Fourier transform infra red spectroscopy, thermogravimetric
analysis and X-ray photoelectron spectroscopy. Impurities such as these may alter the physical and
chemical behaviour of the nanoparticles, and must be taken into account in future toxicity studies.
12
Athanassiou E K, Grass R N, Stark W J (2010) Chemical aerosol engineering as a novel tool for material science: From oxides to salt and metal nanoparticles. Aerosol Sci Technol 44:161-172.
Auer G, Woditsch P, Westerhaus A, Kischkewitz J, Griebler W-D, De Liedekerke M (2009) Pigments, Inorganic, 2. White Pigments. In: Ullmann’s encyclopedia of industrial chemistry, 6th edn. Wiley, Weinheim, Vol. 27, pp 286-289.
Baruah S, Dutta J (2009). Hydrothermal growth of ZnO nanostructures. Sci. Technol. Adv. Mater. 10: 013001.
Bickmore CR, Waldner KF, Treadwell DR, Laine RM (1996) Ultrafine spinel powders by flame spray pyrolysis of a magnesium aluminum double alkoxide. J Am Ceram Soc 79: 1419-1423.
Carroz J W, Odencrantz F K, Finnegan W G, Drehmel DC (1980) Aerosol generation to simulate specific industrial fine particle effluents. Am Ind Hyg Assoc J 41:77-84.
George S, Pokhrel S, Xia T, Gilbert B, Ji Z, Schowalter M, Rosenauer A, Damoiseaux R, Bradley KA, Mädler L, Nel AE (2010) Use of a rapid cytotoxicity screening approach to engineer a safer zinc oxide
nanoparticle through iron doping. ACS Nano 4:15-29.
Gröhn AJ, Pratsinis SE, Wegner K (2012) Fluid-particle dynamics during combustion spray aerosol synthesis of ZrO2. Chem Eng J 191:491-502.
Gustavsson, Gonzalez H., Farbrot, A., Larko, O. (2002) Percutaneous absorbtion of benzophenone-3, a common component of topical sunscreens. Clinical and Experimental Dermatology 27, 691.
Height MJ, Mädler L, Pratsinis SE, Krumeich F (2006) Nanorods of ZnO made by flame spray pyrolysis. Chem Mater 18: 572-578.
Jensen JR, Johannessen T, Wedel S, Livbjerg H (2000) Preparation of ZnO – Al2O3 particles in a premixed flame. J Nanoparticle Res 2:363-373.
Jézéquel D, Guenot J, Jouini N, Fiévet F (1995) Submicrometer zinc oxide particles: Elaboration in polyol medium and morphological characteristics. J Mater Res 10:77-83.
Johnson J. C., Knutsen K. P., Yan H., Law M., Zhang Y, Yang P, and Saykally R J, (2004) Ultrafast Carrier Dynamics in Single ZnO Nanowire and Nanoribbon Lasers, Nano Letters 4 (2) 197-204.
Klimm D, Schulz D, Ganschow S (2011) Growth of bulk ZnO, Comp. Semicond. Sci. Tech. (3) 302-338.
Li, Y., K. Wu, and I. Zhitomirsky. 2010. “Electrodeposition of composite zinc oxide–chitosan films.”
Colloid. Surface. A: 356(1-3):63-70.
13
Liewhiran C, Phanichphant S (2007) Influence of thickness on ethanol sensing characteristics of doctor-bladed thick film from flame-made ZnO nanoparticles. Sensors 7: 185-201.
Liufu, S., Xiao, H., & Li, Y. (2005). Effect of MA-Na copolymer adsorption on the colloidal stability of nano-sized ZnO suspension. Materials Letters, 59(27), 3494-3497.
Mädler L, Kammler HK, Mueller R, Pratsinis SE 2002. Controlled synthesis of nanostructured particles by flame spray pyrolysis. J Aerosol Sci 33:369-389.
Malvern. 2000. Dynamic Light Scattering: An Introduction in 30 Minutes.
Marshall BS, Telford I, Wood R (1971) A field method for the determination of zinc oxide fume in air. Analyst 96:569-578.
Matsoukas T, Friedlander SK (1991) Dynamics of aerosol agglomerte formation. J Colloid Interface Sci 146: 495-505.
McCarthy JF, Yurek GJ, Elliot JF, Amdur MO (1982) Generation and characterization of submicron aerosols of zinc oxide. Am Ind Hyg Assoc J 43:880-886.
Meulenkamp EA (1998) Synthesis and growth of ZnO nanoparticles. J Phys Chem B 102:5566-5572.
Mitchnick, M., Fairhurst, D., & Pinell, S. (1999). Microfine zinc oxide (Z-Cote) as a photostable UVA/UVB sunblock agent. Journal of the American Academy of Dermatology, 40(1), 85-90.
Mondelaers D, Vanhoyland G, Van den Rul H, D’Haen J, Van Bael MK, Mullens J, Van Pouke LC (2002) Synthesis of ZnO nanopowder via an aqueous acetate-citrate gelation method. Mater Res Bull 37:901–914.
Padmavathy, N., & Vijayaraghavan, R. (2008). Enhanced bioactivity of ZnO nanoparticles—an antimicrobial study. Science and Technology of Advanced Materials, 9(3), 035004.
Shen l, Bao N, Yanaglsawa K, Domen K, Gupta A, Grimes C A (2006) Direct synthesis of ZnO nanoparticles by a solution-free mechanochemical reaction. Nanotechnology 17(20):5117-5123.
Strobel R, Pratsinis SE (2007) Flame aerosol synthesis of smart nanostructured materials. J Mater Chem 17:4743-4756.
Strobel R, Pratsinis SE (2011) Effect of solvent composition on oxide morphology during flame spray pyrolysis of metal nitrates. Phys Chem Chem Phys 13: 9246-9252.
Sturgis CC, Drinker P, Thomson RM (1927) Metal fume fever. I. Clinical observations on the effect of the experimental inhalation of zinc oxide by two apparently normal persons. J Indust Hygiene 9:88-97.
14
Tani T, Mädler L, Pratsinis SE (2002) Homogeneous ZnO nanoparticles by flame spray pyrolysis. J Nanoparticle. Res. 4: 337-343.
Teague SV, Raabe OG (1980) Generation of fume aerosols of zinc oxide. Am. Ind. Hyg. Assoc. J. 41: 680-683.
Teoh WY, Amal R, Mädler L (2010) Flame spray pyrolysis: An enabling technology for nanoparticles design and fabrication. Nanoscale. 2: 1324-1347.
Ahmad U, Rahman MM, Vaseem M, and Hahn YB. 2009. “Ultra-sensitive cholesterol biosensor based on low-temperature grown ZnO nanoparticles.” Electrochem. Commun. 11(1):118-121.
Wahab, Rizwan, S.G. Ansari, Young Soon Kim, Minwu Song, and Hyung-Shik Shin. 2009. “The role of pH variation on the growth of zinc oxide nanostructures.” Applied Surface Science 255(9):4891-4896.
Wang, Z. L. (2004). Zinc oxide nanostructures: growth, properties and applications. Journal of Physics: Condensed Matter, 16(25), R829-R858.
Wu R, Xie C, Xia H, Hu J, Wang A (2000). The thermal physical formation of ZnO nanoparticles and their morphology. J Crystal Growth 217:274-280.
Xia T, Kovochich M, Liong M, Mädler L, Gilbert B, Shi H, Yeh JI, Zink JI, Nel AE (2008) Comparison of the mechanism of toxicity of zinc oxide and cerium oxide nanoparticles based on dissolution and oxidative stress properties. ACS Nano 2:2121-2134.
Synthesis by Flame Spray Pyrolysis and Characterisation Protocol for ZnO nanoparticles
R. Wallace1, A. P. Brown1, R. Brydson1, K. Wegner2, S. J. Milne1
1. Institute for Materials Research, SPEME, University of Leeds, LS2 9JT, UK
2. Particle Technology Laboratory, Department of Mechanical and Process Engineering, ETH Zurich, CH-8092 Zurich, Switzerland
10 20 30 40 50 60 70 80
0 20 40 60 80 100 In te n s it y ( % )
2 Theta (o)
[image:16.595.93.347.258.453.2]1 0 1 0 0 0 0 2 1 0 1 1 1 0 1 2 1 1 2 0 1 0 1 3 1 1 2 2 2 0 2 0 2 0 2 1 2 0 2 2 0 0 0 4
Table 1: XRD peak positions for th values for zincite extracted from t
Number hkil
2θ(°)
JCPDS Reference
01-079-0206
1 10
0
31.77
2 0002 34.42
3 10
1
36.25
4 10
2
47.54
5 11
0
56.60
6 10
3
62.86
7 20
0
66.37
8 11
2
67.95
9 20
1
69.09
10 0004 72.57
11 20
2
76.96
r the synthesized ZnO powder (Fig. 1). Also listed ar om the JCPDS file, 01-079-0206.
(°) d-spacing (Å)
Experimental XRD Pattern JCPDS Reference 01-079-0206 Experimental XRD Pattern JCPDS 01
31.72 2.815 2.819
34.42 2.603 2.604
36.23 2.476 2.477
47.53 1.911 1.911
56.59 1.625 1.625
62.83 1.477 1.478
66.36 1.407 1.407
67.95 1.378 1.378
69.06 1.359 1.359
72.57 1.302 1.302
76.95 1.238 1.238
d are the referenced
Relative Intensity (%)
PDS Reference
01-079-0206
Experimental
XRD Pattern
57.6 53.1
41.4 40.1
100 100
21.4 28.7
30.7 50.0
26.4 45.7
4.00 8.6
21.7 40.0
10.5 21.0
1.6 3.51
5 10 15 20 25 30 0 5 10 15 20 25 30 35 40 F re q u e n c y Length (nm) m mode median
5 10 15 20 25 30 0 10 20 30 40 median mean mode Width (nm) F re q u e n c y
[image:18.595.71.432.105.274.2]1.0 1.5 2.0 2.5 0 10 20 30 40 median mode mean Aspect Rati F re q u e n c y
Figure 3: Histograms to show the elongated
fac equiaxial
Figure 2: TEM images of: (a morphologies present in the sam of particles inset; (b) an atomi with the 10¯10 lattice
30 35 40 45 50
(c) (b) )
mean
(a)
30 35 40 45 50
3.0 3.5 4.0 an
atio
the variation in particle (a) Feret ratio, (b) width and
(10 0) 2.819 Å
faceted
(a) (b)
: (a) a typical cluster of particles showing vary e sample and with the SAED pattern for the same reg tomic lattice image of an elongated ZnO nanopart
and (c) length. (b)
[image:18.595.75.308.341.682.2]1 10 100 1000 10000 0 10 20 0 10 20 0 10 20 (c) Size (d(nm)) Number 160 nm 500 nm R e la ti v e % i n c la s s b y n u m b e r (% ) R e la ti v e % i n c la s s b y v o lu m e ( % ) R e la ti v e % i n c la s s b y i n te n s it y ( % ) Intensity 1500 nm 5500 nm (a) (b) Volume 185 nm 550 nm 180 nm 550 nm 1400 nm 5500 nm
4000 3500 3000 2500 2000 1500 1000 500 80 90 100 80 90 100 80 90 100 T ra n s m it ta n c e ( % ) Wavenumber (cm-1) 12-09-2011 Background OH
C=O CO32- ZnO
C-H (a) (c) T ra n s m it ta n c e ( %
) Heated to 950 C
(b) T ra n s m it ta n c e ( %
) 04-07-2012
296 294 292 290 288 286 284 282 280 800 900 1000 1100 1200 1300 1400 1500 In te n s it y ( C P S )
Binding Energy (eV) -CH
-CO
C=O R
R/H/OH
292 290 288 286 284 282 280 600 700 800 900 In te n s it y ( C P S ) B.E. (eV) -CO -CH R/H/OH R C=O
[image:20.595.75.286.124.407.2]a) b)
Figure 5: FTIR spectrum for the ZnO nanopowder (a) shortly after preparation, (b) after ageing showing the increase in adsorbed water molecules and carbon dioxide on the surface and (c) after heating to 900°C showing evidence for the elimination of the O-H band and the organic carbonyl peaks previously observed.
[image:20.595.80.467.553.684.2]Table 2: Summary of characterisation protocol and the information obtained from each technique.
! ""
#
$ % %
& ' (
)
*+++,-&#. ,/ % % % %
0 0 0 1 23 "4 ( & '
.#
5 1 "6
(
7 1 ,8
# 9
: 9
0 0
)
; : (
0
#!
$
( <
0
%
#! $ %
=. %
$ 69 $ >"9 >" 9
.? %
0
%
/++
#?
>" "
)
0
%
$ 69 $ >"9 >" 9
%
!5
)
,@+ 0
)
,+++ 0
!5
0 100 200 300 400 500 600 700 800
Temperature (°C) Gram Schmidt
A
b
s
o
rb
ti
o
n
(
a
.u
.) O-H
C-O
0 100 200 300 400 500 600 700 800
96.0 96.5 97.0 97.5 98.0 98.5 99.0 99.5 100.0
M
a
s
s
(
%
)
Temperature (C)
(a)
(c) (d)
(b)
Figure 7: (a) Plot from TGA showing the mass of the sample decreasing continuously as the temperature is increased up to 800°C, at a rate of 10°C /min. (b) Gram-shmidt total absorbance (c) O-H absorbance and (d) C-O absorbance plotted against temperature.
a) b)
[image:23.595.79.554.137.392.2] [image:23.595.59.343.479.619.2]