EXPERIENCE, TESTING AND FUTURE DEVELOPMENT OF AN
ULTRASONIC INSPECTION ANALYSIS DEFECT DECISION SUPPORT
TOOL FOR CANDU REACTORS
C. Wallace, G. West, P. Zacharis, G. Dobie, A. Gachagan
University of Strathclyde George Street, Glasgow, UK [email protected]
ABSTRACT
Ultrasonic inspections are undertaken on a routine basis during outages of CANDU reactors. Expert interpretation of the data generated during these inspections is used to confirm the integrity of zirconium alloy pressure tubes which house fuel bundles. The inspections form an essential component of the outage programme for CANDU reactors and as such are part of the critical outage path. Analysis of the large volume of data generated is undertaken by a small team of engineers who apply expert knowledge and interpretation through a robust review process that involves multiple human experts reviewing datasets before a consolidated view is determined. Recent work on automated defect detection and analysis on historical ultrasonic data has demonstrated the viability of a decision support tool which can aid the existing analysis process. Testing of the prototype system with engineers and domain experts has enabled improvement in accuracy and capabilities while highlighting tasks within existing procedures where explicit descriptions of all scenarios cannot feasibly be specified and where therefore human judgement plays a more important role. Development of the software, as a support tool to enable more rapid analysis of typical defects, is intended to enable increases in the time available for experts to consider more complex defects. This paper discusses the development of the software prototype, potential deployment routes for the prototype system, considering the interactions with the existing process, benefits which may be realised and limitations that may be addressed through the use of data-driven analysis techniques.
Key Words: Ultrasonic, Inspection, Decision Support, Software
1
ULTRASONIC INSPECTION OF CANDU REACTORS
Ultrasonic inspection tools have been deployed routinely in CANDU reactor pressure tubes to enable the detection and characterization of flaws in the bodies of the tubes. Data was collected historically using the CIGAR tool, a multi-probed ultrasonic inspection tool [1], which has recently been superseded by the ANDE tool, which provides a larger range of measurements and improved resolution. The tubes are inspected and the data collected while the reactor is offline for scheduled maintenance, with the completion of data analysis and confirmation of fitness for service necessary to restart the reactor.
1.1
Existing Analysis Process
The data is streamed from ANDE to local data storage at the equipment site before being transferred to a dedicated analysis center, where trained analysts inspect the data and characterize any flaws detected [1]. The first stage of analysis [10] consists of an automated flagging process which identifies regions of potential flaws.
analysts complete their review of the available C-Scans (2-dimensional view of the entire channel) and B-Scans (higher resolution 3-dimensional views of the flagged regions) and summarize their findings in a common format, reporting measured locations, sizes, depths and types of flaw.
A third analyst then acts to consolidate these results and performs a resolution of any conflicting interpretations. The length of time required for the complete analysis process of a pressure tube depends on the number and complexity of the flaws identified. When a finalized set of flaws have been agreed, they are compared with a set of criteria developed to determine if any single flaw poses significant structural risk to the pressure tube. The key characteristic in determining this is the depth and root radius of the flaw, which are modelled using a separate analysis software.
In occasions where specific flaw criteria exceed permissible limits, a polymer replica is recorded of the flaw in order to make a direct measurement of the geometry of the flaw, rather than the inferred ultrasonic measurement. This process is complex and time consuming and often requires multiple attempts in order to capture a complete replica.
At the end of the analysis process, when all flaws have been analyzed and classified, a judgement is made of the integrity [8] of the pressure tube and the ability of the tube to return to service. This process is repeated across all inspected tubes and forms part of the critical path during outage in returning the reactor to power.
1.2
Existing Process Issues
The large volume of data, intensive analysis process and time pressures of the inspection regime require a number of human analysts to support each outage, often analyzing only sections of particular pressure tubes as part of the process described earlier. Despite the use of a multi-pass analysis and a resolution analyst, the process introduces a level of subjectivity and variability in the results.
An increased volume of inspection data generated by new tools, combined with ageing plant and a potential increase in the number and complexity of flaws, is likely to drive a requirement to increase the efficiency of analysis. Currently only a subset of the highest resolution inspection data is utilized, for specific regions of tube, but if the complete set of data were to be analyzed in the future, new analysis processes would be required.
2
AUTOMATED ANALYSIS OF PRESSURE TUBES
2.1
Knowledge Based Analysis
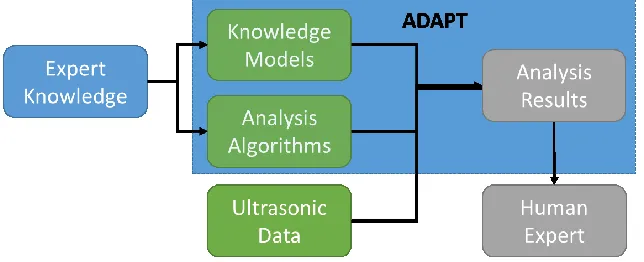
Previous work [2, 4, 5] has described the application of a knowledge-based systems approach to the development of a decision support tool for pressure tube inspection analysts. Expert knowledge was captured from engineers and analysts before being encoded as rules and analysis algorithms which replicate the existing analysis process in software, as shown in Figure 1.
This approach was selected for its explicability, in terms of analysis results, and the ability of the knowledge base to be updated and improved as understanding of the analysis process, some of which relies on human judgement, is extended.
2.2
Development
The modules are then chained together to form a complete analysis of a set of data equivalent to that analyzed by the human analyst. In contrast to the existing analysis process, ADAPT performs only a single analysis pass of the data and does so without any historical information about the pressure tube. On completion of the analysis, ADAPT generates a ‘channel file’ in the same binary format as generated by the existing analysis software, known as FLAW. The channel file contains metadata describing the characteristics of flaws identified by ADAPT which can be loaded in FLAW to present the analyst with a visualization of this information. ADAPT has been developed to complement and integrate with FLAW as part of the existing analysis process.
2.3
Data
ADAPT was originally developed to be compatible with the data generated by the CIGAR tool but during development, the ANDE tool was introduced. The ANDE tool generates significantly larger volumes of data, essentially performing the ‘high resolution’ scan conducted by CIGAR on small regions, over the entire pressure tube. This quantity of data is unfeasibly large for human analysts to analyze using the existing process and timescales, therefore a process of selecting a sub-set of the data containing potential flaws has been established.
Despite the extraction of only potential flaw areas at high resolution, a general increase in resolution for full pressure tube data and the inclusion of additional probes has significantly increased the volume of inspection data that requires analysis.
3
SOFTWARE CAPABILITIES AND LIMITATIONS
3.1
Testing and Results
ADAPT has been tested against a large volume of historical data and in several side-by-side feedback sessions with analysts. This testing has enabled specific refinements in accuracy through the incorporation of expert knowledge to make the analysis algorithms more robust and to handle nuances not present in the software set used to develop the software.
[image:3.612.157.479.73.204.2]The most recent round of bulk testing against historical data has generated encouraging results in key metrics relevant to the analysis process. The figures below, along with descriptions of the metrics, are presented relative to the verified results generated by the three analyst-process described earlier:
- Feature Detection Rate: 95%
The percentage of known features within the channel (e.g. rolled joints, end of tube) that ADAPT accurately identifies within a 3mm tolerance
- Size & Location Accuracy: 91%
The percentage of flaws correctly sized by ADAPT to within a 3mm / 3◦ tolerance, compared to the final verified analyst results
- Depth Accuracy: 76%
The percentage of flaws where the maximum depth calculated by ADAPT is within a 0.1mm tolerance of the final verified analyst results
- Classification Accuracy: 84%
The percentage of defects identified by ADAPT which were correctly classified compared to the final verified analyst results
3.2
Comparison with Human Analysts
While the accuracy figures presented above provide an illustrative estimate of the performance of ADAPT compared to the existing multi-analyst process, there are several distinctions which must be considered in order to make a valid comparison.
Specifically, there are several resources which are unavailable to the ADAPT analysis and therefore inherently limit the performance of ADAPT compared to the human analysis process, including:
- Access to historical results: The human analysts review all available historical information on a channel prior to inspection and interpret the results in this context. History of particular flaws for example, will influence the maximum size and depth reported by the analyst.
- Multi-Stage Review: The human analysis process requires multiple independent analysts to review data and results and consolidates a final view based on discussion and meta-analysis - Tolerances and Data Quality: Analysts can review data in the context of calibration and
tolerance information where measurements are near threshold values. Additionally, analysts can use expert judgement and experience to compensate to some extent for data quality issues Additionally, certain capabilities available to the analysts through experience and discussion have not yet been fully developed to a comparable extent in ADAPT due to their complexity, including:
- Overlapping Flaws: Analysts can use experience, visual interpretation and discussion to identify where complex arrangements of flaws may overlap and should be separated or where apparently separate defects should be grouped as a single flaw.
- Critical Area: Flaws in the critical area, a region with several mechanical features and non-uniform reflection surfaces, are known to be more difficult to detect (due to more complex ultrasonic reflections) however some progress has been made in this area through the introduction of B-Scan defect detection (discussed later)
- Wave Straightening: The process of wave-straightening (used to correct for probe movement of tube distortion) can significantly affect the measurement of the depth of some flaws however the application of wave straightening is made on the basis of human expert judgement which has not yet been quantified.
datasets analyzed in under six hours. Further optimizations have already been identified which will enable the analysis of multiple flaws simultaneously, potentially reducing run-time by 50-75%.
3.3
Analysis Complexities
Complexities in testing of larger sets of data have manifest themselves particularly in areas where significant weight is placed on expert human judgement and intuitive visual interpretation. For example, in some occasions, multiple distinct flaws may be evident to the human analyst but are concentrated and overlap in such a small area that ADAPT detects only a single flaw. While guidelines exist as to when flaws should be separated and when they should be grouped, the highly irregular shape of some flaws remains a significant source of errors.
Given the knowledge-based approach, certain characteristics of flaws are used to estimate the class of flaw as part of the analysis. The highly irregular shape and configuration of some flaw classes however has limited the applicability of this approach and it is considered that more complex visual processing tools may enable more accurate classification of flaws.
3.4
B-Scan Defect Detection
While detection of the bulk of flaws in the data is undertaken through analysis of C-Scan data [1,2], areas of higher resolution B-Scan are also reviewed by human experts in order to detect potential flaws with lower response amplitudes. This process requires significantly more subjective visual examination of the data as the flaws in this measurement range are less distinct from the background surface of the pressure tube.
As the thresholds used to identify and characterize these flaws are highly dependent on the analyst, using their experience and judgement, this process cannot be automated in the same way as the detection of flaws directly from C-Scans.
A prototype method has been developed which attempts to re-create the process undertaken by the analyst, which operates by searching at various levels of sensitivity for flaws. As the threshold (at which a flaw is apparent) is lowered, the number and configuration of flaws varies in manner somewhat analogous to adjusting the exposure of a visual image. This search process has no hard limit or threshold and in principle, the threshold could be reduced to the point where measurement noise is comparable to potential flaws. In practice however, the human expert determines a level, dependent on the surface condition and geometry of the tube and the quality of the data, at which flaws can be considered significant. At this point, the flaws are characterized and recorded.
Automating this process requires an algorithm that can approximate the search process performed by the human expert to the point at which potential flaws of a certain significance are detected or confirmed to be absent. Currently, a range of threshold values are pre-configured in ADAPT, which then iteratively reduces the threshold until at least one flaw is identified with a size greater than pre-defined size. This process, while enabling detection of previously undetected defects is not sufficiently robust and suffers from the generation of a large number of false positive flaws, which results in a corresponding increase in the overall analysis time.
This problem, in common with other analysis complexities discussed earlier, related to classification and grouping of flaws, has prompted investigation of data driven, rather than knowledge-based, analytics in order to complement the existing ADAPT prototype.
4
MACHINE LEARNING AND DATA DRIVEN ANALYSIS APPROACHES
aid the development of machine learning and data driven analysis, in order to support the core knowledge-based system. Additionally, in some situations, as previously alluded to, replicating human expert operation is highly complex and in some cases not feasible.
For these reasons, some specific aspects of the analysis process have been identified as potentially suitable for the application of machine learning techniques to corroborate, confirm and increase confidence in the automated analysis process. This section presents some examples where such an approach has been demonstrated to provide capability which may be beneficial to future versions of ADAPT.
4.1
Neural Network Flaw Classification
Classification of flaw types in ADAPT is currently based on a set of rules derived from knowledge extracted from human experts. These rules, based on the size and position of the flaws, work with good accuracy, as demonstrated during testing, however the highly irregular nature of many debris flaws have limited the applicability of this approach. Previous work in ultrasonic analysis [3, 6] has demonstrated the applicability of neural networks to the detection and analysis of ultrasonic flaws.
Given the large historical archive of analysis results, a set of labelled data with a set of features (characteristics of the flaws) is therefore available, against which a machine learning model can be trained. Rather than using explicit domain knowledge, this approach enables a predictive relationship to be derived based entirely on the parameters of each flaw and their respective label.
4.1.1
Neural Network Model
Using an archive of 6000 previously analyzed flaws, labelled training and test datasets were constructed using the following parameters as features:
- Axial Start – The axial start position of the flaw in the tube (mm) - Rotary Start – The rotary start position of the flaw in the tube (°) - Length – The axial extent of the flaw in the tube (mm)
- Width – The rotary extent of the flaw in the tube (°)
- Amplitude – The amplitude of the flagged region containing the flaw (dB) - Depth - The maximum measured depth (mm)
These features were labelled using one of six classifications: - Debris (4416 instances)
- Fuel Bundle Bearing Pad Fret (2255)
- Multiple Fuel Bundle Bearing Pad Fret (494) - Inner Diameter Scratch (197)
- Circumferential Scrape (160) - Axial Scrape (85)
Two thirds of the data were used to train a neural network constructed of four layers of 512, 256, 128 and 64 nodes respectively. This configuration was determined experimentally to converge quickly on an accurate predictive model however further work is required in order to optimize the structure.
4.1.2
Neural Network Model Interpretation
The accuracy achieved using the model is notably better than that measured during bulk testing against historical data, suggesting that there may be benefit in integrating the model into the existing ADAPT prototype. Given the nature of a neural network model however, the same level of explicability is not possible using the model, rather it generates only a probability of a flaw being of a particular class.
Rather than attempt to use these classifications in isolation, it is envisioned that the neural network model may be used to complement the existing rules-based classification, particularly where the confidence level of classification determined by the rules is low. Further work might investigate the potential for optimizing the neural network and identifying rules for particular classifications through the model directly, for some level of explicability.
4.2
Automatic Feature Generation and Anomaly Detection
Other work has investigated the use of unlabeled data from the ANDE tool in an attempt to identify features independently of domain knowledge, with the goal of removing any sort of subjectivity in the analysis. These approaches aim to explore the given datasets and infer underlying structures that will enable the segmentation of the data in some meaningful way. A crucial step for this process is to identify and extract small subsets of signal features that will act as representatives of the signals during the learning process.
The features should be descriptive characteristics that quantitatively condense the information contained within each signal, thus reducing the computational requirements of any further analysis. In [7], simple statistical measures were extracted from signals obtained by the CIGAR tool from selected areas of various pressure tubes. The features showed that they are capable of carrying information about the condition of the pressure tube and potential flaw. However, modelling and predicting the degree of how each individual feature is affected by various factors present on the surface of the pressure tube poses a serious challenge.
Currently, there are efforts towards automatically learning important discriminative features from raw ultrasonic signals through unsupervised artificial neural network architectures known as auto-encoders. The architecture is similar to a Multilayered Perceptron, except that the output layer is identical to the input layer. By forcing an auto-encoder to learn how to recreate its inputs through a bottleneck layer of significantly smaller size than its input/output layers, it can learn low dimensionality representations of the input data. However significant experimentation is required in order to identify the appropriate
[image:7.612.175.439.73.244.2]parameters that control the constraints required for preventing the auto-encoder from trivially copying its inputs, while ensuring that they are not restricting the learning process.
A related piece of work undertaken recently, focuses on performing efficient anomaly detection within large-scale datasets containing a full set of unprocessed ultrasonic inspection signals across the entire pressure tube, captured by multiple ANDE probes (sizes approximately 180 GB to 400 GB, per probe). By performing a standardized general assessment of the pressure tube in its entirety it enables the elimination of a large proportion of the input data while providing a repeatable procedure for tracking anomalies’ growth by comparing current and future inspection data. This approach aims to significantly reduce the workload of analysts and algorithms specializing in computationally intensive procedures, such as depth assessment, which is magnified by the high-resolution nature of ANDE datasets.
5
DEVELOPMENT ROUTES
5.1
Knowledge-Based Development
Testing of ADAPT with analysts has enabled the identification of improvements however the amount of effort required to address edge cases (unusual flaws or data) will eventually become disproportionate to the benefit derived from using the tool. The prototype has however been developed in order to enable rules and analysis algorithms to be updated based on changing analysis standards and requirements. A more advanced approach to this issue has looked at the potential to have end users actively update the software as they use it.
5.2
Expert in the Loop
During testing, the capture of user feedback was a crucial method of identifying improvements required in the software. On some occasions these improvements were specific technical capabilities of the software however in other situations, the way the software was configured required improvement or adjustment. It has been proposed that one method of addressing this issue is to investigate the use of an ‘expert in the loop’ model, proposed for use in medical and other applications [9], whereby the user feedback generated through operation of the software is integrated into the software during use.
For example, a human expert may determine that a threshold or parameter is consistently set too high or too low or the analysis process is regularly underestimating the length of a particular class of flaw. The user would be able to provide feedback to the software that would update the analysis process itself, enabling a closer approximation of the human analysis process to be performed.
5.3
Machine Learning Algorithms
As demonstrated earlier in this paper, significant scope exists for the application of machine learning techniques to support the existing core knowledge-based system. The development of these techniques is proposed to be undertaken in a modular way, with analysis tools developing from prototype stage, through testing, to analysis support without disrupting the existing process. In this manner, new data driven algorithms can be developed and their accuracy demonstrated before they are considered for use as part of the analysis process.
5.4
Large Datasets
6
DEPLOYMENT ROUTES
6.1
Integration with Existing Processes
The ADAPT prototype is currently undergoing pilot deployment to help identify the most effective manner to integrate ADAPT into the analysis process, particularly the method through which the human analysts can derive most benefit. The software has the potential, initially, to increase the efficiency of one of the analysis streams through rapid analysis of the data, to be verified by the human expert. Complex or unusual flaws are likely to be investigated in more detail by human experts, however the majority of flaws have been shown to be accurately detected and characterized by ADAPT.
Further use of ADAPT may include use of the results generated as an additional analysis stream, to be used in order to resolve any differences generated by the human analysis streams.
6.2
Integration with Existing Software Tools
The existing analysis software tool, FLAW, exists in a variety of configurations and version across different CANDU sites. The development of ADAPT targets the current use of the software at Bruce Power and aims to support the accepted existing process while providing some flexibility, through modular design, to enable future developments.
6.3
Replica Generation Support
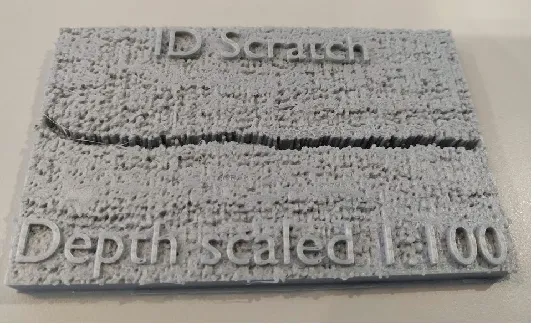
Some recent work on 3D processing of the ultrasonic data has demonstrated the potential to recreate, using 3D printers, a physical model of flaws detected in the pressure tubes. While at a very early stage of development, it is possible that such tools may one day be able to support the process for obtaining replicas from within the tubes, which is an extremely complex and time consuming process.
7
CONCLUSIONS
[image:9.612.184.451.403.567.2]The ADAPT software has generated analysis results comparable to those of a human analyst deprived of historical information and context in a fraction of the time currently required. Challenges remain in the application of the software to real-time outage support and in determining the best method of integration with the existing process.
Significant increases in data handling and processing requirements have also introduced challenges to the process of automated analysis however as discussed in this paper, the integration of data driven and machine learning techniques may help leverage this data and historical information in order to develop a more accurate tool.
Test deployments of ADAPT have demonstrated the viability of the tool and greatly supported the development of the software through user feedback sessions. Significant scope for optimization remains, due the focus during development of the prototype on accuracy rather than performance, and it is envisioned that a fully deployed version of ADAPT would be implemented in a manner than would allow large increases in performance while providing a platform for new analytical tools.
8
ACKNOWLEDGMENTS
This work was supported by Bruce Power however the views presented in this paper do not necessarily reflect those of Bruce Power or their contractors.
9
REFERENCES
1. M. Trelinksi, “Application of Ultrasonic Testing Methods for Volumetric and Surface Inspection of CANDU Pressure Tubes,” PACNDT '98 - Proceedings, Toronto (1999)
2. T. Lardner, G. West, G. Dobie, A. Gachagan, “An Expert-Systems Approach to Automatically Determining Flaw Depth Within CANDU Pressure Tubes”, NPIC HMIT 2017 Proceedings, San Francisco (2017)
3. F. W. Margrave, K. Rigas, D.A. Bradley, P. Barrowcliffe, “The use of neural networks in ultrasonic flaw detection”, Measurement, Vol 25, Issue 2, pp 143-154 (1999)
4. J.W.D. Anderson, “The use of expert systems for operations support in the CANDU nuclear power supply system”, Use of expert systems in nuclear safety, Vienna, pp.237-244 (1990)
5. T. Lardner, G. West, G. Dobie, A. Gachagan, “Automated sizing and classification of defects in CANDU pressure tubes”, Nuclear Engineering and Design, Vol 325, pp25-32, (2018)
6. D. Ciocan, W. Mayo, R. Ciocan, “Neural Network Classification of Flaws Detected during Ultrasonic Inspection of CANDU Pressure Tubes and Brazed Joints in CANDU Fuel”, ECNDT, (1998)
7. P. Zacharis, G. West, G. Dobie, T. Lardner, A. Gachagan, “Data-Driven Analysis of Ultrasonic Pressure Tube Inspection Data”, NPIC HMIT 2017 Proceedings, San Francisco (2017)
8. Y, Kim, S. Kwak, J, Lee, Y. Park, “Integrity evaluation system of CANDU reactor pressure tube”,
KSME International Journal, Vol 17, Issue 7, pp.947-957 (2003)
9. D. Girardi, “A Domain-Expert Centered Process Model for Knowledge Discovery in Medical Research: Putting the Expert-in-the-Loop”, Proceedings of 8th Brain Informatics and Health
Conference, pp389-398 (2015)
10. M. Trelinski, “Inspection of CANDU Reactor Pressure Tubes Using Ultrasonics”, 17th World