Abstract: A very small amplitude (μV) of the electroencephalography (EEG) signal is infected by diverse artifacts. These artifacts have an effect on the distinctiveness of the signal because of which medical psychoanalysis and data retrieval is difficult. Therefore, EEG signals are initially preprocessed to eliminate the artifacts to produce signals that can serve as a base for further processing and analysis. Different filters are implemented to eliminate the artifacts present in the EEG signal. Recent research shows that window technique Finite Impulse Response (FIR) filter is usually used. In this paper, digital Infinite Impulse Response (IIR) filter and different Finite Impulse Response (FIR) window filters (Hanning, Hamming, Kaiser, Blackman) of various orders are implemented to eradicate the random noise added to EEG signals. Their performance analysis has been done in Matlab (R2016a) by calculating the mean square error, mean absolute error, signal to noise ratio, peak signal to noise ratio and cross-correlation. The results show that Kaiser Window based finite impulse response filter outperforms in removing the noise from the electroencephalogram signal. This research focuses on eradicating random noise in electroencephalogram signals but this approach will be extended to a different source of electroencephalogram contamination.
Keywords: Blackman Window, FIR filter, Hamming Window, Hanning Window, IIR filter, Kaiser Window.
I. INTRODUCTION
Electroencephalography signal is the electric signal of a brain with a distinctiveness features like nonperiodic, small voltage amplitude and non-standardized pattern [1]-[4].
EEG signals are classified on the basis of frequency: (i) Alpha waves (frequency 8 - 13 Hz) (ii) Beta waves (frequency > 13 Hz) (iii) Theta waves (frequency 3.5 - 7.5 Hz)
(iv) Delta waves (frequency 3 Hz or less) [1],[5]-[7]. While recording the EEG signal or during transmission, the EEG signal is infected by artifact [8]-[11].
The removal of noise using signal processing technique is essential for reliable analysis of the EEG signal [12],[13]. In signal processing, a filter is used to eliminate the unnecessary constituent of the signal [14]. Diverse filter designs viz. Infinite Impulse Response (IIR) and Finite Impulse Response
Revised Manuscript Received on August 05, 2019
Anshul, PhD Scholar Department of ECE, FET, Manav Rachna International Institute of Research and Studies, Faridabad, India.
Dipali Bansal, Professor, Department of ECE, FET, Manav Rachna International Institute of Research and Studies, Faridabad, India.
Rashima Mahajan, Associate Professor,Department of ECE, FET, Manav Rachna International Institute of Research and Studies, Faridabad, India.
(FIR) are used for different purposes [1], [14], [15]. In the finite impulse response (FIR) system, the impulse response is of limited duration while the infinite impulse response system has unlimited duration. While realization, no feedback is needed in a FIR filter [15]. Due to which, the construction of the FIR filter is much easier than the IIR filter [15],[16]. The IIR and FIR filter is chosen according to the requirements and specifications of frequency response. Then a proper method is applied like Fourier series, Frequency sampling or Window, through which the finite impulse response filter can be obtained [15],[17]. Out of these methods, window techniques are usually used.
There are many other advantages of the FIR filter over the IIR filter [17]. FIR filters are stable, easily designed and various techniques are available to design the FIR filter and are free of limit cycle oscillations, no feedback is required.
In the windowing technique, frequency response specification Hd(ω) and their unit sample response hd(n) is
found by the use of inverse Fourier transform.
)
(
)
(
)
(
n
h
n
w
n
h
d (1)The windowing function w (n) multiplied with hd(n) is
same as Hd(ω) convolution with w (ω), where w(ω) is the
frequency domain representation of window function. By using an appropriate window functions method, Gibbs oscillations can be reduced. Researchers have proposed many windowing techniques to filter EEG data, out of which few offer excellent solution to eliminate noise from EEG data[17],[18]. In this paper, among all the windowing techniques, Kaiser, Blackman, Hanning and Hamming techniques have been discussed for designing the FIR filter. This paper focuses on comparing four windowing techniques that outperform in EEG signal filtering process and their performance has been analyzed by calculating the following performance parameters [19]:
(i) Mean Square Error (MSE) (ii) Mean Absolute Error (MAE) (iii) Signal to Noise Ratio (SNR) (iv) Peak Signal to Noise Ratio (PSNR) (v) Cross correlation (CC).
The rest of this paper is structured as follows: Materials & methods to identify competent filter structure is described in Section II. Section III discusses the results obtained. Section IV describes a comprehensive discussion of the obtained results. The last section concludes along with the future scope of this research.
Performance Analysis of IIR & FIR Windowing
Techniques in Electroencephalography Signal
Processing
Performance Analysis of IIR & FIR Windowing Techniques in Electroencephalography Signal Processing
II. MATERIALSANDMETHODS
A system has been proposed to identify the efficient filter structure to eliminate noise from EEG signals. A block diagram to identify the efficient filter structure to eliminate the artifacts from the EEG signal is sketched in Fig.1. The proposed system comprises of three steps namely loading of EEG data & preprocessing of acquired EEG signals and identification of the competent filter structure in subsection A and B respectively. Various filter structures are designed in MATLAB (R2016a, 64bit) to find out the competent filter structure to eliminate artifacts from acquired EEG signals.
A. Loading & Preprocessing of EEG data
EEG signals can be loaded from an online dataset of Neuroelectric and Myoelectric database of Physiobank ATM to Matlab workspace with the use of “load” command[22],[23]. This EEG database consists of EEG signals acquired from 11 participators at a frequency of 5, 6, and 10 Hz. The acquired EEG signals are signals when a rapid serial visual presentation (RSVP) task is done. The eight diverse channels of 10-20 EEG signal acquisition system (PO8, PO7, PO3, PO4, P7, P8, O1, and O2) were used to acquire the EEG signal. Channel “O” represents the occipital region and “P” represents the parietal region. The five dissimilar continuous EEG signals of frequency 10Hz
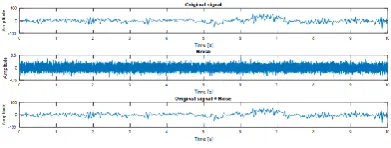
[image:2.595.98.498.365.440.2]with a sampling rate of 2048 Hz, amplitudes of the order of microvolt from the PO7 channel is considered in this proposed work. A random noise is added to the loaded EEG signals and digital filter structures (IIR and FIR) are implemented to identify the best filter structure. Noise is a random signal which occurs naturally. There are many types of random noise like square root noise, pink noise, white noise, proportional noise, blue noise and thermal noise. Random noise occurs in any conducting medium which is due to the random motion of electrons. When signals of random noise are collective with electronic circuits, the resulting noise is the combined power of individual signals. In this work, white noise which consists of distributed random numbers is used. The “randn” MATLAB function is used to generate a 1-by-N vector random numbers with 0.1 standard deviation. A randn function generates a random number with an undefined pattern of numbers. Extremity of signal fluctuation from the mean is calculated by the standard deviation. No precise peak to peak value is there in the random noise, it’s nearly 6 to 8 times of the standard deviation so a random noise of 0.6 to 0.8 peak to peak is generated in this work for analysis.In this research, the EEG signals are loaded from the database of Physiobank ATM. The recorded EEG signal is exported to MATLAB (R2016a) workspace which is shown in Fig. 2.
[image:2.595.69.244.491.622.2]Fig.1. Block Diagram Of The Filter Structure Identification System.
Fig. 2. An EEG signal loaded from the database of Physiobank ATM
Fig.3. EEG signal with random noise introduced
A random noise is introduced to the records of the loaded EEG signal. The original EEG signal, a random noise signal and resulted noisy EEG signal is shown in Fig.3. It shows a loaded EEG signal, random noise and the EEG signal with random noise. To filter the noise present in the EEG signal, different digital filter structures are proposed. Filtering is required to allow the desired frequencies and restrict undesired frequencies from the input signal. The passband is the range of frequencies of a signal which are allowed to pass and stopband is the range of frequencies which are not allowed to pass from the filter. The following digital filters have been proposed to reject the added noise from EEG signals.
(i) IIR filter is illustrates by differential equation.
The output signal y(n) is a convolution of the input signal x(n) with the infinite length impulse response h(n) of the filter.
0 k
)
(
)
(
y(n)
h
k
x
n
k
(2)(ii)FIR filter is also illustrated by a differential equation. The output signal y(n) is a convolution of the input signal x(n) with the impulse response h(n) of the filter.
[image:2.595.68.264.692.766.2]
1 0 k)
(
)
(
y(n)
Nk
n
x
k
h
(3)The following various windowing techniques have been proposed to implement FIR filters -
(i) Hanning Window: It can be defined as a flat window whose first and last value is zero so there is a fast decay of the side lobes and represented as
)
2
cos
1
(
2
1
)
(
N
n
n
w
(4)(ii)Hamming Window: This function can be defined as a flat window whose first and last value is not zero so the level of the side lobes is approximately constant.
N
n
n
w
(
)
0
.
54
0
.
46
cos
2
(5)(iii)Blackman Window: There is a rapid decay of side lobes and has a wide main lobe with the low frequency selectivity.
N
n
N
n
n
w
(
)
0
.
42
0
.
5
cos
2
0
.
08
cos
4
(6)(iv) Kaiser window: In this, the ratio of the power of the main lobe to the sidelobe is maximized. The sidelobe height is controlled by the parameter β. For a particular β, the height of the sidelobe is fixed with respect to the length of the window. As β increases, the height of the sidelobe decreases and the width of main lobe increase.
] ) ] / ) [( 1 ( [ ) ( 2 1 2
I n
n
w o (7)
where α = M/2, Io(.) is a Bessel function
IIR Bandstop filter of the second order having the sampling rate of 512 Hz, lower cutoff frequency 50 Hz and higher cutoff frequency 60Hz is proposed to eliminate the noise from EEG signal. The bandstop filter is a selective filter with a high rejection which cannot attenuate other frequencies that belongs to the EEG signal. The IIR filters of the second order are typically recognized as biquads. Biquads are cascaded to realize higher order filters. The order of a filter is proportional to how many components are required or the number of calculations involved in designing a filter. Therefore, by designing a low order filter, the computation time can be minimized. A high-order filter provides superior response, but a high order filter has high cost, more space is
required and adds to complexity in design. So, an appropriate selection of order is essential for designing a filter. A low pass filter is used to remove noise at higher frequencies than that of EEG signals. A low pass IIR filter having a sampling rate of 512 Hz, cutoff frequency of 50Hz, passband ripple of 0.01 is proposed to eliminate the noise from EEG signal. Further, an FIR low pass filter with the windowing technique of Hanning, Hamming, Blackman and Kaiser window having a sampling rate of 512 Hz, cut off frequency 50Hz is proposed by changing the order of the filter to recognize at which range of the order FIR filter gives a superior response. The phase delays of the FIR filters can be nullified by zero-phase digital filtering by the use of Matlab function filtfilt ( ). In the zero-phase filtering, EEG data is processed in forward as well as reverse directions which result in the zero phase distortion.
B. Identification of competent digital filter structure
The following parameters have been analyzed to proposed to assess the performance of designed filter structures to eliminate noise from EEG signals. The parameters are selected to evaluate the performance of the proposed IIR & FIR filters. The filter which provides lesser mean absolute error and mean square error, higher signal to noise ratio, peak signal to noise ratio and cross-correlation is considered as an efficient filter for removal of artifacts from EEG signals.
The following performance parameters have been calculated to evaluate the performance of filters -
(i) Mean absolute error (MAE) is the absolute error between the reconstructed signal & the original signal and is reflective of the performance of filter structure. MAE is used as a gauge to know how much divergence is there in the reconstructed signal from the original signal [20].
MAE = h (8)
(ii)Mean Square Error (MSE) is the average squared error between the original signal and the reconstructed signal. It is a measure of signal fidelity and provides the altitude of error/distortion among them[21].
MSE =
(9)
(iii) Signal to Noise Ratio is defined as the ratio of signal power to the noise power.
SNR(indb)=10log10
(10)
(iv) Peak Signal to Noise Ratio is defined as the ratio of maximum possible signal power and corrupting noise power which affects the reliability of its representation.
PSNR (db)=10log10[
(11)
(v) Cross Correlation is the correlation between the original and the reconstructed signal.
The loading of EEG signals to MATLAB workspace, preprocessing of acquired EEG signals and identification of competent digital filter structure is done using algorithms in
Performance Analysis of IIR & FIR Windowing Techniques in Electroencephalography Signal Processing
[image:4.595.82.514.51.310.2]
Fig. 4. Detailed Work Flow To Identify A Competent Digital Filter Structure To Eliminate Artifacts From EEG Signals
III. RESULTS&DISCUSSION
The various results obtained are described and analyzed in this section and the proposed algorithm to identify the competent digital filter structure for elimination of artifacts from EEG signals was developed in MATLAB release (R2016a).
A. IIR filter analysis
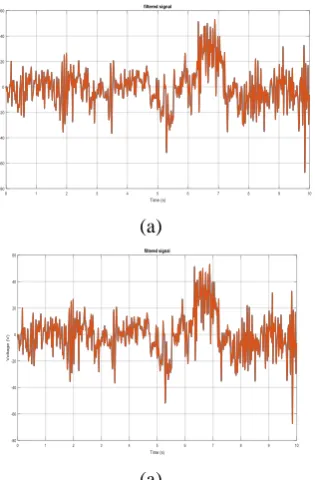
The second order bandstop IIR filter having a sampling rate of 512 Hz with lower and higher cutoff frequency 50Hz & 60Hz is applied to eradicate the noise from the EEG signal and the obtained filtered signal is shown in Fig 5.
(a)
[image:4.595.354.514.373.492.2](b)
Fig. 5.Filtered EEG signal using bandstop IIR filter (a) For Subject1 (b) For Subject2
A low pass IIR filter having the sampling rate of 512Hz with the cutoff frequency of 50Hz and the passband ripple of 0.01 is applied to eradicate the noise from the EEG signal. To design digital filters matlab function ‘designfilt’ is used and the obtained filtered signal is as shown in Fig. 6.
(a)
(b)
[image:4.595.98.256.519.759.2]IIR digital filters with different orders were designed. The results illustrate that low pass IIR filter offers the best results at filter order 8. The passband ripple is very less. To assess the performance of the filter, performance parameters are calculated for the noisy signal and filtered signal.Table I illustrates that low pass IIR filter provides a better result than
the band stop IIR filter in eliminating the noise from EEG signals. The performance parameter results are shown for two subjects and there is no considerable enhancement in values of parameters even with low pass IIR filter structures which show the necessity of further exploring the filters. So FIR filters were designed.
Table-I: Performance Parameters Of Noisy And Filtered EEG Signal Using Bandstop IIR Filter & Low Pass IIR Filter For Subject1 And Subject2
B. FIR filter analysis
A low pass Hanning, Hamming, Blackman and Kaiser window FIR filter having the sampling rate of 512 Hz and cut off frequency 50Hz is applied by changing the order of the filter. The FIR filter introduced a delay in phase which is
nullified by applying zero-phase digital filtering by the use of Matlab function filtfilt ( ). Various windowing techniques are used to realize the digital filter and the obtained filtered signal is shown in Fig. 7.
(a)
(b)
(c)
(d)
Fig.7. Filtered EEG Signal Using Low Pass FIR Filter
Subject1 Subject2
Parameters Parameters of noisy signal
Filtered signal using Bandstop IIR Filter
Filtered signal using Low Pass IIR Filter
Parameters of noisy signal
Filtered signal using Bandstop IIR Filter
Filtered signal using Low Pass IIR Filter
Mean Squared Error 0.009851 0.009853 0.009525 0.009859 0.009496 0.009013
Mean Absolute Error 0.079341 0.079348 0.077786 0.079114 0.077623 0.076006
Signal to noise ratio(in db)
43.180489 43.189671 43.326977 44.764883 44.827634 44.986977
Peak signal to noise ratio(in db)
54.535269 54.552818 54.681757 53.004605 53.167356 53.482597
Performance Analysis of IIR & FIR Windowing Techniques in Electroencephalography Signal Processing
Table-II: Performance Parameters Of Noisy Signal And Filtered Signal Filtered Using Hanning Window Low Pass FIR Filter
Hanning Window Subject1
MSE MAE SNR(in db) PSNR(in db) CC
No filter .0101 .0802 43.0577 54.4124 .999975
Order1 .0038 .0496 47.2647 58.6194 .999991
Order3 .0036 .0482 47.5465 58.8013 .999992
Order4 .0035 .0469 47.7004 59.0552 .999992
Order5 .0036 .0478 47.5382 58.8929 .999991
Order6 .0039 .0501 47.1684 58.5227 .999990
Order8 .0044 .0531 46.6847 58.0394 .999989
Subject2
MSE MAE SNR( in db) PSNR(in db) CC
No filter .0099 .0797 44.7118 52.9510 .999983
Order1 .0040 .0500 48.5190 56.9688 .999993
Order3 .0037 .0499 48.6323 57.1453 .999993
Order4 .0038 .0499 48.3247 57.0652 .999993
Order5 .0044 .0519 47.0668 54.9214 .999992
Order6 .0069 .0747 46.2453 54.1458 .999990
Order8 .0091 .0786 45.0019 53.0153 .999982
Subject3
MSE MAE SNR( in db) PSNR(in db) CC
No filter .0101 .0801 43.6896 55.3057 .999978
Order1 .0038 .0494 47.9265 59.5427 .999992
Order3 .0037 .0489 48.0354 59.6217 .999993
Order4 .0034 .0468 48.3778 59.9940 .999993
Order5 .0036 .0483 48.1265 59.7426 .999992
Order6 .0040 .0503 47.7469 59.3630 .999992
Order8 .0044 .0531 47.2754 58.8915 .999991
Subject4
MSE MAE SNR( in db) PSNR(in db) CC
No filter .0100 .0798 49.6251 61.2756 .999995
Order1 .0037 .0484 53.9883 65.6388 .999998
Order3 .0036 .0478 54.1534 65.3458 .999998
Order4 .0034 .0463 54.3887 66.0391 .999998
Order5 .0036 .0483 54.0179 65.6683 .999998
Order6 .0040 .0501 53.6746 65.3251 .999998
Order8 .0044 .0532 53.1892 64.8396 .999998
Subject5
MSE MAE SNR( in db) PSNR(in db) CC
No filter .0100 .0799 36.1873 48.0511 .999880
Order1 .0038 .0488 40.4464 52.3102 .999955
Order3 .0036 .0471 40.6212 52.5027 .999957
Order4 .0034 .0467 40.8384 52.7022 .999959
Order5 .0036 .0475 40.6624 52.5262 .999957
Order6 .0039 .0498 40.3032 52.1670 .999953
Order8 .0045 .0532 39.6846 51.5484 .999946
The performance parameters are calculated by applying varying order of Hanning window low pass FIR filter to 5 different subjects (EEG signals) loaded from Physiobank.With the increase in the order of the filter, the values of performance parameters are improved however in Subject1, 3, 4 and 5 after the order4 values start deteriorates and in Subject 2 after the order 3 values start deteriorates.
This result shows that the best performance is obtained corresponding to minimum MSE and MAE maximum SNR, PSNR & CC with Hanning window low pass FIR filter possessing order 3 & 4.The performance parameters are calculated by applying varying order of Hamming window low pass FIR filter to 5 different subjects (EEG signals) loaded from Physiobank.
Table-III: Performance Parameters Of Noisy Signal And Filtered Signal Filtered Using Hamming Window Low Pass FIR Filter
Hamming Window Subject1
MSE MAE SNR(in db) PSNR(in db) CC
No filter .0101 .0802 43.0577 54.4124 .999975
Order1 .0037 .0488 47.3766 58.7314 .999991
Order4 .0037 .0484 47.4451 58.7999 .999991
Order5 .0036 .0478 47.5898 58.9446 .999991
Order7 .0038 .0499 47.0386 58.5674 .999990
Order8 .0041 .0509 46.9944 58.3491 .999990
Subject2
MSE MAE SNR( in db) PSNR(in db) CC
No filter .0099 .0797 44.7118 52.9510 .999983
Order1 .0039 .0499 48.7638 57.0036 .999993
Order4 .0037 .0481 49.0778 57.3172 .999994
Order5 .0037 .0483 49.0512 57.2909 .999994
Order6 .0036 .0478 49.1731 57.4128 .999994
Order7 .0038 .0497 48.2995 57.0974 .999993
Order8 .0040 .0508 48.6464 56.8861 .999993
Subject3
MSE MAE SNR( in db) PSNR(in db) CC
No filter .0101 .0801 47.6896 55.3057 .999978
Order1 .0039 .0494 47.9265 59.5427 .999992
Order3 .0036 .0489 48.0065 59.7327 .999992
Order4 .0034 .0469 48.3378 59.9939 .999993
Order5 .0036 .0483 48.1265 59.7427 .999992
Order6 .0039 .0503 47.7469 59.3631 .999992
Order8 .0042 .0529 47.4245 59.0915 .999991
Subject4
MSE MAE SNR( in db) PSNR(in db) CC
No filter .0100 .0798 49.6251 61.2756 .999995
Order1 .0038 .0500 53.7373 65.3874 .999998
Order3 .0037 .0486 53.9853 65.5248 .999998
Order4 .0035 .0474 54.1544 65.8048 .999998
Order5 .0034 .0469 54.2602 65.9107 .999998
Order6 .0036 .0480 54.0144 65.6649 .999998
Order8 .0039 .0502 53.6863 65.3367 .999998
Subject5
MSE MAE SNR( in db) PSNR(in db) CC
No filter .0100 .0799 36.1873 48.0511 .999880
Order1 .0038 .0491 40.4134 52.2772 .999955
Order3 .0036 .0481 40.6359 52.5447 .999957
Order4 .0035 .0469 40.8204 52.6842 .999959
Order5 .0034 .0468 40.8222 52.6860 .999959
Order6 .0036 .0478 40.6195 52.4833 .999957
Order8 .0040 .0505 40.1598 52.0236 .999952
With the increase in the order of the filter, the values of performance parameters are improved however in Subject1 and 2 after the order6 values start deteriorates, in Subject 3 after the order 4 values start deteriorates and in Subject 4 and 5 after the order 5 values start deteriorates. This result shows that the best performance is obtained corresponding to
minimum MSE and MAE maximum SNR, PSNR & CC with Hamming window low pass FIR filter possessing order 4 to 6.The performance parameters are calculated by applying varying order of Blackman window low pass FIR filter to 5 different subjects (EEG signals) loaded from Physiobank.
Performance Analysis of IIR & FIR Windowing Techniques in Electroencephalography Signal Processing
With the increase in the order of the filter, the values of performance parameters are improved however in Subject1, 3 and 5 after the order6 values start deteriorates and in Subject 2 and 4 after the order 5 values start deteriorates. This result shows that the best performance is obtained corresponding to minimum MSE and MAE maximum SNR, PSNR & CC with Blackman window low pass FIR filter possessing order 5 & 6.The performance parameters are calculated by applying varying order of Kaiser Window low pass FIR filter to 5 different subjects (EEG signals) loaded from Physiobank.
Blackman Window Subject1
MSE MAE SNR(in db) PSNR(in db) CC
No filter .0101 .0802 43.0577 54.4124 .999975
Order1 Doesn’t work for order 1
Order4 .0101 .0802 43.0577 54.4124 .999975
Order5 .0036 .0477 47.5688 58.9236 .999992
Order6 .0035 .0473 47.6772 59.0321 .999992
Order7 .0035 .0479 47.5253 58.9432 .999991
Order8 .0036 .0481 47.4881 58.8429 .999991
Subject2
MSE MAE SNR( in db) PSNR(in db) CC
No filter .0099 .0797 44.7118 52.9510 .999983
Order1 Doesn’t work for order 1
Order4 .0100 .0799 44.6823 52.9220 .999982
Order5 .0036 .0478 49.1020 57.3418 .999994
Order6 .0037 .0485 49.0395 57.2792 .999994
Order7 .0037 .0485 49.0097 57.2496 .999993
Order8 .0037 .0486 48.9796 57.2193 .999993
Subject3
MSE MAE SNR( in db) PSNR(in db) CC
No filter .0101 .0801 43.6896 55.3057 .999978
Order1 Doesn’t work for order 1
Order2 .0100 .0798 43.6773 55.3697 .999979
Order5 .0036 .0484 48.3311 59.8373 .999992
Order6 .0034 .0462 48.4882 60.1044 .999993
Order7 .0036 .0471 48.2357 59.9415 .999992
Order8 .0037 .0484 48.1005 59.7167 .999992
Subject4
MSE MAE SNR( in db) PSNR(in db) CC
No filter .0101 .0801 43.6896 55.3057 .999978
Order1 Doesn’t work for order 1
Order3 .0100 .0798 43.6773 55.3697 .999979
Order4 .0036 .0484 48.3311 59.8373 .999992
Order5 .0034 .0462 48.4882 60.1044 .999993
Order6 .0036 .0471 48.2357 59.9415 .999992
Order8 .0037 .0484 48.1005 59.7167 .999992
Subject5
MSE MAE SNR( in db) PSNR(in db) CC
No filter .0100 .0799 36.1873 48.0511 .999880
Order1 Doesn’t work for order 1
Order2 .0101 .0801 36.1693 48.0331 .999879
Order5 .0035 .0475 40.7579 52.6217 .999958
Order6 .0034 .0465 40.9152 52.7790 .999960
Order7 .0035 .0471 40.7934 52.6922 .999958
Table-V: Performance Parameters Of Noisy Signal And Filtered Signal Filtered Using Kaiser Window Low Pass FIR Filter
Kaiser Window Subject1
MSE MAE SNR(in db) PSNR(in db) CC
No filter .0101 .0802 43.0577 54.4124 .999975
Order1 .0039 .0498 47.1763 58.5310 .999990
Order3 .0031 .0445 48.1465 59.5013 .999992
Order4 .0029 .0430 48.3999 59.7547 .999993
Order5 .0037 .0471 47.4929 58.8475 .999992
Order6 .0049 .0532 46.2104 57.5652 .999990
Order8 .0089 .0701 43.6193 54.9741 .999982
Subject2
MSE MAE SNR( in db) PSNR(in db) CC
No filter .0099 .0797 44.7118 52.9510 .999983
Order1 .0038 .0494 47.6921 57.8318 .999993
Order3 .0035 .0482 49.7237 57.9481 .999993
Order4 .0034 .0474 49.7927 57.9853 .999994
Order5 .0042 .0512 48.3681 55.0326 .999992
Order6 .0064 .0709 47.5766 54.8163 .999988
Order8 .0089 .0756 46.1661 53.1459 .999982
Subject3
MSE MAE SNR( in db) PSNR(in db) CC
No filter .0101 .0801 43.6896 55.3057 .999978
Order1 .0039 .0496 47.8705 59.4867 .999992
Order4 .0021 .0364 50.5812 62.1973 .999996
Order5 .0019 .0346 50.9844 62.6006 .999996
Order6 .0016 .0324 51.5486 63.1647 .999996
Order7 .0017 .0326 51.4238 63.0925 .999996
Order8 .0018 .0329 51.3870 63.0032 .999996
Subject4
MSE MAE SNR( in db) PSNR(in db) CC
No filter .0100 .0798 49.6251 61.2756 .999995
Order1 .0038 .0491 53.8495 65.4999 .999998
Order4 .0022 .0378 56.1526 67.8030 .999999
Order5 .0020 .0355 56.7148 68.3653 .999999
Order6 .0019 .0350 56.7841 68.4346 .999999
Order7 .0100 .0798 49.6251 61.2756 .999995
Order8 .0038 .0491 53.8495 65.4999 .999998
Subject5
MSE MAE SNR( in db) PSNR(in db) CC
No filter .0100 .0799 36.1873 48.0511 .999880
Order1 .0038 .0490 40.3991 52.2630 .999954
Order3 .0029 .0407 42.0023 54.1572 .999972
Order4 .0022 .0375 42.7116 54.5754 .999974
Order5 .0020 .0359 43.0991 54.9629 .999976
Order6 .0022 .0364 42.8524 54.7162 .999975
Order8 .0026 .0393 42.0783 53.9421 .999972
With the increase in the order of the filter, the values of performance parameters are improved however in Subject1 and 2 after the order4 values start deteriorates, in Subject 3 and 4 after the order 6 values start deteriorates and in Subject 5 after the order 5 values start deteriorates. This result shows that the best performance is obtained corresponding to minimum MSE and MAE maximum SNR, PSNR & CC with Hamming window low pass FIR filter possessing order 4 to 6. The performance parameters are calculated by applying various IIR & FIR filters to EEG signals of five different subjects. The value of MAE & PSNR of the first noisy EEG signal is found to be 0.802 and 54.4124db. The value of the lowest value of MAE & highest value of PSNR of the first noisy EEG signal is found to be 0.0430 and 59.7547db when Order4 Kaiser Window low pass FIR filter is implemented. With signal 2, the value of MAE & PSNR of the noisy EEG signal is found to be 0.0797 and 52.9510db. The value of the lowest value of MAE & highest value of PSNR of the noisy EEG signal is found to be 0.0474 and 57.9853 dB when Order4 Kaiser Window low pass FIR filter is implemented.
Performance Analysis of IIR & FIR Windowing Techniques in Electroencephalography Signal Processing
(a)
(b)
(c)
(d)
(e)
Fig.8. Performance analysis of IIR and FIR filters for EEG signals of Subject1 using (a) MSE (b) MAE (c) SNR (d) PSNR (e) CC
The performance analysis of implemented IIR and FIR filter structures for EEG signal for Subject1 preprocessing is depicted in Fig.8. The above bar graph represents the values of IIR and different FIR filters of order where best performance is analyzed. Similar trends are obtained from EEG signals for other Subjects. The analysis reveals that the minimum value of MAE,MSE and maximum value of SNR, PSNR and CC are obtained when an order4 to 6 Kaiser window low pass FIR filter are applied to an input noisy EEG signal. There are few disadvantages of the FIR filter that while implementing the filter, huge arithmetic operations are involved which confines its speed and more power is required. The Kaiser window offers the minimum main-lobe width and a sharper cut-off which indicates kaiser window has less transition width [24].Reference [25] also shows that to eliminate power-line noise from the EEG signal, Kaiser window FIR filters gives better performance than other FIR and IIR filters.
IV. CONCLUSION
In this paper, IIR & FIR digital filter of different orders were designed and analyzed. The performance parameters (MAE, MSE, PSNR, SNR, and CC) have been calculated to evaluate the performance of designed filter structures which implies
Kaiser window low pass FIR filter with order 4 to 6 possesses better filtering capacity with lower MAE, MSE and higher PSNR, SNR and CC than the IIR & other FIR filters in denoising different EEG signals loaded from the Physiobank ATM database. Thus results show that windowing technique of FIR filters prove out to be the best filtering approach to remove noise for EEG signal. The future scope of this research is to apply designed filter structures on real-time acquired EEG signals.
REFERENCES
1. N.E. Diana,U. Kalsum,A. Sabiq , W.Jatmiko and P.Mursanto , “Comparing Windowing Methods on Finite Impulse Response (FIR) Filter Algorithm in Electroencephalography (EEG) Data Processing,” Journal of Theoretical and Applied Information Technology,vol.88(3),2016,pp.558-567.
2. G.Repovs, “Dealing with Noise in EEG Recording and Data Analysis.” Informatica Medica Slovenica,vol.15(1),2010,pp.18-25. 3. Gerber, E. M., Sadeh, Boaz, Ward , Andrew , Knight, Robert T. and
4. D.Bansal, R. Mahajan, S. Roy, D. Rathee, S. Singh, “Real Time Man Machine Interface and Control using Deliberate Eye Blink,”International Journal of Biomedical Engineering and Technology,vol. 18(4),2015,pp.370-384.
5. T.Johannisson, “Correlations between Personality Traits and Specific Groups of Alpha Waves in the Human EEG”PeerJ PMC,vol.4,2016,e2245 . Available: 10.7717/peerj.2245.
6. T. K. Aich, “Absent Posterior Alpha Rhythm: An Indirect Indicator of Seizure Disorder? Indian Journal of Psychiatry,” PMC.vol.56(1)2014,pp.61–66. Available: 10.4103/0019-5545.124715. 7. D.Bansal and R.Mahajan, “EEG based brain computer interface:
Cognitive Analysis and Control Applications,” in Elsevier Academic Press, 2019.
8. A.S. Al-Fahoum, A. Al-Fraihat, “Methods of EEG Signal Features Extraction Using Linear Analysis in Frequency and Time-Frequency Domains,” Hindawi Publishing Corporation, ISRN Neuroscience,
2014,Article ID 730218, 1-7. Available
:https://doi.org/10.1155/2014/730218.
9. S.K.Goh, Abbass, Hussein A., Tan, Chen, Al-Mamun, Abdullah, Wang, Chuanchu and Guan, Cunta, “Automatic EEG Artifact Removal Techniques by Detecting Influential Independent Components,” IEEE Transactions on Emerging Topics in Computational Intelligence, vol.1(4),2017,pp.270 – 279. Available: 10.1109/TETCI.2017.2690913. 10.I. Mahmoud, Al-Kadi , B.I. Mamun, M.Reaz ,M.A. Alauddin, “
Evolution of Electroencephalogram Signal Analysis Techniques during Anesthesia”,.Sensors,vol. 13,2013,pp. 6605-6635. Available:10.3390/s130506605.
11.R. Mahajan, D. Bansal and A.Khatter,. “EEG Based Cognitive Brain Mapping in Time Domain to Analyze EM Radiation Effect on Human Brain. Advanced Informatics for Computing Research”, ICAICR 2018. Communications in Computer and Information Science, Springer, Singapore. vol. 955,2019,pp.308-319
12.M. Z Parvez and M.Paul, “ Prediction and Detection of Epileptic Seizure by Analysing EEG Signals,” in Biomedical Image Analysis and Mining Techniques for Improved Health Outcomes, . 1st ed. US: IGI Global.2015,pp.1-335.
13.R.Mahajan and D. Bansal, “Depression diagnosis and management using EEG-based affective brain mapping in real time,” International Journal of Biomedical Engineering and Technology,vol. 18(2),2015,pp.115-138.
14.P.Podder,T.Z. Khan ,Mamdudul Haque, R.,M. Muktadir, “Comparative Performance Analysis of Hamming, Hanning and Blackman Window”, International Journal of Computer Applications,vol.96(18),2014,pp.1-7. 15.J. G Proakis and D.G. Manolakis, Digital signal processing. 3rd ed.
Upper Saddle River, N.J.: Prentice-Hall, 1996, pp.622-692.
16.A. Chandra and S.Chattopadhyay, “Design of hardware efficient FIR filter: A review of the state-of-the-art approaches,” An International Journal of Engineering Science & Technology, Elsevier, vol.19(1), 2016,pp.212-226.
17.R. Mehboob,S.A. Khan, R. Qamar, R, “FIR filter design methodology for hardware optimized implementation” IEEE Transactions on Consumer Electronics,vol.55(3),2009,pp.1669-1673. Available:10.1109/tce.2009.5278041.
18.P.Das ,S.K. Naskar, P. Narayan, Sankar, “An Approach to Enhance Performance of Kaiser Window Based Filter”2016 Second IEEE International Conference on Research in Computational Intelligence and
Communication Networks (ICRCICN)(25th-26th
Sep.2016),2016,pp.256-261, Available:
10.1109/ICRCICN.2016.7813666
19.N.Iqbal, A. Zerguine, Kaka, SanLinn, A. Al-Shuhail, “ Observation-Driven Method Based on IIR Wiener Filter for Microseismic Data Denoising,”Pure and Applied Geophysics,vol.175(6), 2018,pp.2057-2075.
20.R. Shriram ,M. Sundhararajan , Shete, S.Daimiwal, Nivedita, “Statistical features based comparision of analysis and synthesis of normal and epileptic electroencephalogram for various wavelets,”Turkish Journal of Electrical Engineering and Computer Sciences,vol.25(3),2016,Available: 10.3906/elk-1511-254pp.1795-180 6.
21.W.Zhou and C.B. Alan, “ Mean Squared Error: Love It or Leave It?”, IEEE Signal Processing magazine,.2009,pp.98-117.Available: 10.1109/MSP.2008.930649.
22. A.Goldberger et al, “PhysioBank, PhysioToolkit, and PhysioNet”, Circulation,2000,vol. 101(23).
23.A.L.Goldberger ,L.A. Amaral ,L. Glass, J.M.Hausdorff , P.C.Ivanov ,R.G. Mark ,J.E. Mietus ,G.B. Moody, C.K.Peng ,H.E. Stanley, “PhysioBank, PhysioToolkit, and PhysioNet: Components of a New
Research Resource for Complex Physiologic Signals,” Circulation Pubmed,vol. 101(23),2000, e215-e220.
24. S. Zahoor,N. Shahzad and M.Wei , “Design and implementation of an
efficient FIR digital filter”,Cogent
Engineeringvol.,4(1),2017. Available: 10.1080/23311916.2017.132337 3.
25. V.Singh,K. Veer, R. Sharma and S. Kumar, “Comparative study of FIR and IIR filters for the removal of 50 Hz noise from EEG signal,” International Journal of Biomedical Engineering and Technology, vol.22(3),2016, pp.250-257.
AUTHORSPROFILE
Anshul is pursuing her doctorate in electronics and communication from the Manav Rachna International Institute of Research and Studies, Faridabad,Haryana, India. She did her B.Tech and M.Tech from Maharishi Dayanand University, Rohtak, Haryana, India and had experience in teaching of thirteen years. She is an eminent researcher. Her research interests include EEG, brain-computer interface, bio-signal processing. She has the publication of more than 15 research papers in international journals, national and international conferences. She has coordinated various academic and administrative activities. Presently, she is working as a young innovator in Guru Jambheshwar University of Science and Technology, Hisar, Haryana, India.
Dipali Bansal is a Professor in the Faculty of Engineering & Technology, Manav Rachna International Institute of Research and Studies, Haryana, India. She received her doctorate in biomedical signal processing and Biomedical Instrumentation from Jamia Milia University, New Delhi, and is an imminent and young scientist. She has research in the area of biomedical signal processing and biomedical instrumentation. She has an industrial, teaching and research experience of more than 22 years. She has the publication of more than 75 research papers in prestigious indexed international journals and international conferences and written a book titled “EEG based Brain Computer Interfacing: Cognitive Analysis and Control” published by Elsevier. She is also Reviewer of many international journals.