https://doi.org/10.5194/bg-16-1845-2019 © Author(s) 2019. This work is distributed under the Creative Commons Attribution 4.0 License.
Quantifying energy use efficiency via entropy production:
a case study from longleaf pine ecosystems
Susanne Wiesner1, Christina L. Staudhammer1, Paul C. Stoy2, Lindsay R. Boring3,4, and Gregory Starr1
1Department of Biological Sciences, University of Alabama, Tuscaloosa, AL 35487, USA 2Department of Land Resources and Environmental Sciences, Montana State University,
Bozeman, MT 59717, USA
3Jones Ecological Research Center, Newton, GA 39870, USA
4Odum School of Ecology, University of Georgia, Athens, GA 30602, USA
Correspondence:Gregory Starr ([email protected])
Received: 3 July 2018 – Discussion started: 8 August 2018
Revised: 1 April 2019 – Accepted: 15 April 2019 – Published: 30 April 2019
Abstract.Ecosystems are open systems that exchange mat-ter and energy with their environment. They differ in their efficiency in doing so as a result of their location on Earth, structure and disturbance, including anthropogenic legacy. Entropy has been proposed to be an effective metric to de-scribe these differences as it relates energy use efficien-cies of ecosystems to their thermodynamic environment (i.e., temperature) but has rarely been studied to understand how ecosystems with different disturbance legacies respond when confronted with environmental variability. We studied three sites in a longleaf pine ecosystem with varying levels of anthropogenic legacy and plant functional diversity, all of which were exposed to extreme drought. We quantified ra-diative (effrad), metabolic and overall entropy changes – as
well as changes in exported to imported entropy (effflux) in
response to drought disturbance and environmental variabil-ity using 24 total years of eddy covariance data (8 years per site). We show that structural and functional character-istics contribute to differences in energy use efficiencies at the three study sites. Our results demonstrate that ecosys-tem function during drought is modulated by decreased ab-sorbed solar energy and variation in the partitioning of ergy and entropy exports owing to differences in site en-hanced vegetation index and/or soil water content. Low effrad
and metabolic entropy as well as slow adjustment of effflux
at the anthropogenically altered site prolonged its recovery from drought by approximately 1 year. In contrast, stands with greater plant functional diversity (i.e., the ones that in-cluded both C3and C4species) adjusted their entropy exports
when faced with drought, which accelerated their recovery. Our study provides a path forward for using entropy to deter-mine ecosystem function across different global ecosystems.
1 Introduction
Ecosystems utilize resources, such as solar radiation, nu-trients and water, to maintain a state far from thermody-namic equilibrium (Amthor, 2010; Beer et al., 2009; Finzi et al., 2007; Thomas et al., 2016). Understanding ecosys-tem resource use efficiency is crucial, as anthropogenic and climate-induced changes around the globe continue to alter ecosystem structure and function (Haddeland et al., 2014; Porter et al., 2012; Reinmann and Hutyra, 2016; Thom et al., 2017).
Ecosystems are open and dynamic systems that exchange matter and energy with their surroundings as described by the ecosystem energy balance:
Rn=Rs,in−Rs,out+Rl,in−Rl,out=LE+H+G+M, (1)
whereRnis net radiation, Rs,in andRs,out are incident and
upwelling shortwave radiation, and Rl,in andRl,out are
assump-tion of a steady state over longer periods and because Mis much smaller in magnitude compared to other fluxes. How-ever,Mimposes a control on energy fluxes, likeRn, LE and
H, through changes in leaf area and reflective properties, as well as through active biotic control in response to changes in environmental variables (i.e., stomata opening and closing due to water availability, Hammerle et al., 2008).
From Eq. (1), ecosystem energy exchange is a function of its thermodynamic environment – the heat transfer of a sys-tem with its surroundings – which differs based on the dif-ferent mechanisms by which heat is transported: conduction, convection and radiation. Complicating our understanding of ecosystem energy dynamics is the fact that more frequent fluctuations in environmental variables are expected as a re-sult of global climate change, including extreme events like droughts, which will alter the resource efficiency of ecosys-tems across the globe and with it their resilience (Franklin et al., 2016; Woodward et al., 2010).
It is hypothesized that ecosystems aim to optimize their energy use and thus maximize their balance of entropy pro-duction and entropy exports to avoid thermodynamic equi-librium (Schneider and Kay, 1994; Schymanski et al., 2010). The magnitude of entropy production and entropy fluxes in ecosystems depends on thermodynamic gradients (i.e., thermal gradients, chemical gradients, etc.) between organ-isms and their surroundings (Kleidon, 2010). Ecosystems invest energy to build more complex structures (i.e., self-sustainability; Müller and Kroll, 2011; Virgo and Harvey, 2007), which can enhance their entropy export and there-fore keep the ecosystem far from thermodynamic equilib-rium (Odum, 1988; Schneider and Kay, 1994; Holdaway et al., 2010; Skene, 2015). For example, forest stands with more vertical structure were found to be more efficient in har-vesting available light, which consequently increased their productivity (Bohn and Huth, 2017; Hardiman et al., 2011). Productive sites with greater leaf area can maintain higher LE fluxes, which increases their entropy export (Meysman and Bruers, 2010; Brunsell et al., 2011); LE fluxes also maintain lower ecosystem surface temperatures and thereby greater entropy production. On the contrary, large values of H caused by surface temperatures that are greater than air temperatures result in lower entropy production (LeMone et al., 2007). This has been shown in deforested landscapes (Bonan, 2008; Khanna et al., 2017), as well as comparative studies of different vegetation types, and in ecosystems with heterogeneity in their vegetation distribution (Holdaway et al., 2010; Brunsell et al., 2011; Kuricheva et al., 2017).
Here, we evaluate how efficiently ecosystems use energy by assessing ecosystem entropy production as well as by quantifying the ratios in entropy imports and exports (effflux
and dS /dt) in three study ecosystems that represent an edaphic and management gradient. We do so by measuring their structural complexity over an 8-year period via the en-hanced vegetation index (EVI) and variation in annual un-derstory biomass, as well as in relation to the energy and
entropy partitioning of incoming energy from solar radia-tion. We build upon the techniques proposed by Holdaway et al. (2010), Brunsell et al. (2011) and Stoy et al. (2014), by calculating entropy production and entropy fluxes within longleaf pine (Pinus palustrisMill.) ecosystems. The sites differed in ecosystem structure (i.e., basal area, Table 1) and plant functional diversity due in part to differences in soil water holding capacity, as well as different levels of anthro-pogenic legacy. The sites experienced severe drought in the beginning of this study, which we used to quantify entropy exchanges in response to the disturbance. First, we compare and contrast differences in ecosystem energy fluxes (i.e.,Rn;
LE;H;G; and the net ecosystem exchange of carbon diox-ide, NEE) and entropy fluxes (JLE;JH;JG; metabolic
en-tropy,Sm; and radiative entropy production,σ) in response
to changes in structural and environmental variables (EVI; soil water content, SWC; vapor pressure deficit, VPD; and precipitation). Next, we quantify how entropy exports and entropy production at the different sites adjust to changes in incoming entropy when exposed to drought. We do so by estimating radiative efficiency (effrad), the ratio of
en-tropy production to an empirical maximum enen-tropy produc-tion (MEP), and ratios of daily imported and exported en-tropy fluxes (effflux), as well as through the overall change
in entropy (dS /dt) at the sites. We hypothesize that (1) the xeric site will have a higher entropy flux fromJHandJGbut
lowerSm due to its lower EVI and lower basal area, which
will result in more variable dS /dt compared to the other sites; (2) the mesic site will maintain higher effraddue to its
greater structural complexity (i.e., plant functional diversity and basal area) and thus greater absorptive capacity for solar radiation compared to the other sites; and (3) the interme-diate site will have lower effradand efffluxcompared to the
mesic and xeric sites, as a result of its lower plant functional diversity (i.e., low abundance of C4species) and structural
complexity, causing lower absorption of solar radiation and export of entropy through LE.
2 Materials and methods 2.1 Site description
This study was conducted at the Joseph W. Jones Ecological Research Center in southwestern Georgia, USA (31.2201◦N, 84.4792◦W), from January 2009 to December 2016. The three sites are maintained by frequent low-intensity fire on a 2-year return interval and were last burned in 2015 (Starr et al., 2016). The climate is humid subtropical with a mean an-nual precipitation of 1310 mm (Kirkman et al., 2001). Mean temperature extremes range from 3 to 16◦C in winter and 22 to 33◦C in summer (NCDC, 2011).
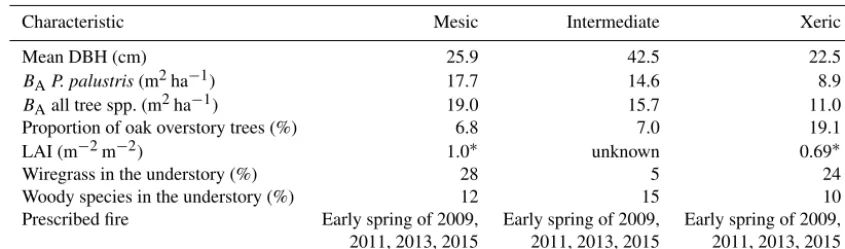
Table 1.Stand characteristics at the mesic, intermediate and xeric sites at the Joseph W. Jones Ecological Research Center, Newton, GA, USA.
Characteristic Mesic Intermediate Xeric
Mean DBH (cm) 25.9 42.5 22.5
BAP. palustris(m2ha−1) 17.7 14.6 8.9
BAall tree spp. (m2ha−1) 19.0 15.7 11.0
Proportion of oak overstory trees (%) 6.8 7.0 19.1
LAI (m−2m−2) 1.0∗ unknown 0.69∗
Wiregrass in the understory (%) 28 5 24
Woody species in the understory (%) 12 15 10
Prescribed fire Early spring of 2009, Early spring of 2009, Early spring of 2009, 2011, 2013, 2015 2011, 2013, 2015 2011, 2013, 2015
∗Wright et al. (2012).
and clay textured soils (Goebel et al., 1997, 2001). Soils at the intermediate site are well drained and have a depth to the argillic horizon of∼165 cm (Goebel et al., 1997). The xeric site lies on well-drained deep sandy soils with no argillic horizon (Goebel et al., 1997). All sites are situated within 10 km of each other and have average elevations of 165, 155 and 160 m for the mesic, intermediate and xeric sites, respec-tively.
Ninety-five-year-old longleaf pine trees (Pinus palustris Mill.) dominate the overstory of all sites, and overall basal area (BA) and diameter at breast height (DBH) varied by site
(Table 1). The overstories of each site also contain a small proportion of oak trees; the xeric site has the highest propor-tion with 22 %, versus 8 % and 7.7 % at the mesic and inter-mediate sites, respectively. The understory at the mesic and xeric sites is largely covered with perennial C4grass species,
such as wiregrass (Aristida beyrichiana [Trin.]), whereas woody species dominate the intermediate site. Composition and abundance of other plant species varies by site (Kirkman et al., 2001, 2016). Soil perturbation at the intermediate site affected species richness, so that wiregrass is almost absent.
We acquired EVI for 2009 through 2016 for all three sites from the online data pool at https://lpdaac. usgs.gov/products/mod13q1v006/ and https://lpdaac.usgs. gov/products/myd13q1v006/ via the NASA Land Processes Distributed Active Archive Center (LP DAAC) and the USGS Earth Resources Observation and Science Center (EROS), using MODIS Aqua and Terra data products (MYD13Q1 and MOD13Q1; Didan, 2015a, b) to quantify changes in ecosystem structure from disturbance. EVI prod-ucts for the sites were available on a 16 d basis and linearly interpolated to obtain daily estimates. We also acquired the Palmer Drought Severity Index (PDSI) for southwest Geor-gia from the National Oceanic and Atmospheric Administra-tion data archive for 2009 to 2016 to identify the months of drought disturbance (Dai et al., 2004).
Understory composition and biomass was estimated annu-ally from 2009 through 2013. Thereafter, the collection
fre-quency became biannual, so that 2014 and 2016 were miss-ing in the data collection. Understory biomass was estimated using 0.75 m2 clip plots, which were randomly located by tossing a plot frame from preinstalled litter trap positions (n=20 per site; see Wiesner et al., 2018). All live and dead vegetation smaller than 1 m in height was clipped and ana-lyzed in our laboratory. Vegetation was classified by plant life form (here, forbs, ferns, legumes, wiregrass, other grasses, and woody plants), and each sample was dried to constant weight.
2.1.1 Net ecosystem exchange of CO2measurements
Net ecosystem exchange (NEE) was measured continuously at 10 Hz at all three sites from January 2009 to Decem-ber 2016 using open-path eddy covariance (EC) techniques (Whelan et al., 2013). Data were stored on CR-5000 data-loggers (Campbell Scientific, Logan, UT). CO2 and water
vapor concentration were measured with an open-path in-frared gas analyzer (IRGA, LI-7500, LI-COR Inc., Lincoln, NE) and wind velocity and sonic temperature were mea-sured with a three-dimensional sonic anemometer (CSAT3, Campbell Scientific, Logan, UT). These sensors were in-stalled∼4 m above mean canopy height at each site (34.5, 37.5 and 34.9 m for the mesic, intermediate and xeric sites, respectively),∼0.2 m apart to minimize flow distortion be-tween the two instruments and vertically aligned to match the sampling volume of both instruments.
2.2 Sensible and latent heat flux measurements
measure-ments from the IRGA:
LE=λρaw0q0, (2)
H=ρacp
w0T0
s −0.000321Tsw0q0
, (3)
where λ is the latent heat of vaporization (J kg−1), ρa is
the density of air (kg m−3), cp is the specific heat of air
(kJ kg−1K−1),w0 is the instantaneous deviation of vertical
wind speed (w, m s−1) from the mean, and q0 andTs0 are
the instantaneous deviations of water vapor concentration (kg kg−1) and sonic temperature (Kaimal and Gaynor, 1991) from their respective means. The overbars in Eqs. (2) and (3) signify the time-averaged covariance. MissingHand LE were gap-filled on a monthly basis using simple linear mod-els as a function ofRn.
In cases where energy balance closure was not achieved, energy fluxes ofHand LE were corrected using the Bowen method following Twine et al. (2000), where fluxes are ad-justed using residual energy, and the estimated Bowen ratio (β=H /LE), which assumes thatβ was correctly measured by the EC system:
LE= 1
1+β(Rn−G) , (4)
H=β×LE. (5)
Closing the energy balance is important to quantify differ-ences in energy and entropy fluxes by site, as according to the first law of thermodynamics energy is always conserved. To quantify differences in environmental drivers and site varia-tion between energy and entropy fluxes, we established mod-els of average daily energy fluxes (described in Sect. 2.7) 2.3 Meteorological instrumentation
Meteorological data above the canopy were also collected and stored on the CR-5000 dataloggers (Campbell Scien-tific, Logan, UT). Meteorological data measured on the tow-ers included photosynthetically active radiation (PAR; LI-190, LI-COR Inc., Lincoln, NE), global radiation (LI-200SZ, LI-COR Inc., Lincoln, NE), incident and outgoing short-wave and longshort-wave radiation to calculateRn(NR01,
Hukse-flux Thermal Sensors, Delft, the Netherlands), precipitation (TE525 Tipping Bucket Rain Gauge, Texas Electronics, Dal-las, TX), wind direction and velocity (model 05103-5, R.M. Young, Traverse City, MI), air temperature (Tair) and
rela-tive humidity (RH; HMP45C, Campbell Scientific, Logan, UT), and barometric pressure (PTB110, Vaisala, Helsinki, Finland).
Soil temperature (Tsoil), volumetric water content of the
soil (SWC) and soil heat flux (G) were measured in one lo-cation near the base of each tower at each site every 15 s and averaged every 30 min on an independently powered CR10X datalogger.Tsoilwas measured at depths of 4 and 8 cm with
insulated thermocouples (type T, Omega Engineering, INC.,
Stamford, CT), andGwas measured at a depth of 10 cm with soil heat flux plates (HFP01, Hukseflux, Delft, the Nether-lands). SWC was measured within the top 20 cm of the soil surface using a water content reflectometer probe (CS616, Campbell Scientific, Logan, UT).
2.4 Data processing
Raw EC data were processed using EdiRe (v.1.4.3.1184; Clement, 1999), which carried out a two-dimensional coor-dinate rotation of the horizontal wind velocities to obtain turbulence statistics perpendicular to the local streamline. Fluxes were calculated for half-hour intervals and then cor-rected for mass transfer resulting from changes in density not accounted for by the IRGA. Barometric pressure data were used to correct fluxes to standard atmospheric pressure. Flux data screening was applied to eliminate 30 min fluxes of NEE,H and LE, resulting from systematic errors as de-scribed in Whelan et al. (2013) and Starr et al. (2016). Such errors encompassed (amongst other things) rain, poor cou-pling of the canopy and the atmosphere (defined by the fric-tion velocity, ustar), and excessive variafric-tion from half-hourly means.
Gross ecosystem exchange (GEE) and ecosystem respi-ration (Reco) were estimated from eddy covariance
mea-surements of net ecosystem exchange of CO2 (NEE;
µmol m−2s−1) at a time resolution of half an hour, from which GEE andRecocan be estimated as follows:
GEE= −NEE+Reco. (6)
Missing half-hourly data were gap-filled as described in Whelan et al. (2013) and Starr et al. (2016). Daytime and nighttime data were estimated utilizing a Michaelis– Menten approach for (PAR>10 µmol m−2s−1) and a mod-ification of the Lloyd and Taylor (1994) model (PAR≤ 10 µmol m−2s−1), respectively. Monthly equations were used to gap-fill data; however, where too few observations were available to produce stable and biologically reasonable parameter estimates, annual equations were used. NEE par-titioning to estimate daytimeReco was performed by using
the nighttime gap-filling equation and then utilizing Eq. (6) to estimate GEE. Nighttime GEE was assumed to be zero. 2.5 Entropy production calculations
Half-hourly GEE andRecowere converted to W m−2(GEEe
andRecoe), using the assumption that 1 µmol of CO2stores
approximately 0.506 J, where 1 J m−2s−1 equals 1 W m−2
(Nikolov et al., 1995), which is then released during respi-ration.
For entropy production and fluxes of shortwave (Rs) and
longwave radiation (Rl) we followed established approaches
W m−2K−1) was calculated as JRs=
Rs,net
Tsun
, (7)
where sun surface temperature (Tsun) was assumed to be
5780 K, withRs,netdefined as the difference of incident and
upwellingRs. The entropy flux ofRl(JRl, W m
−2K−1) was
calculated as JRl=
R l,in
Tsky
−Rl,out Tsrf
, (8)
whereRl,in/Tskyis the entropy flux ofRl,inas incomingRl
(JRl,in), andRl,out/Tsrfis the entropy flux ofRl,outas
outgo-ingRl(JRl,out). Surface temperature (Tsrf; K) was calculated
from upwellingRl(Rl,out):
Tsrf= Rl,out(A×esrf×kB) 1/4
, (9)
with emissivity of the surface calculated asesrf=0.99–0.16α
(Juang et al., 2007); the view factor A was assumed to be unity, and the Stefan–Boltzmann constant kB=5.67×
10−8W m−2K−4. The shortwave albedo (α) was calculated as the daily average of noontime outgoingRs(Rs,out) divided
byRs,in. The sky temperature,Tsky(K), was calculated from
Rlinusing the Stefan–Boltzmann equation:
Tsky= Rl,in
(A×eatm×kB)1/4, (10)
where the emissivity of the atmosphere (eatm) was assumed
to be 0.85, following Campbell and Norman (1998). All other ecosystem entropy fluxesJLE,JH,JG, andJGEE
andJReco (W m
−2K−1) were calculated by dividing the
en-ergy fluxes by temperature as Jx=
x Ty
, (11)
wherexrepresents LE,H,G, and GEEe andRecoe; andTy
was assumed to beTair (forJLE,JH,JGEE andJReco; K) or
Tsoil(forJG, in K).
We also calculated entropy produced from evaporation as-sociated with mixing of saturated air from the canopy with the fraction of air in the atmosphere that has RH below 100 % (JLEmix), following Holdaway et al. (2010):
JLEmix=ET×Rv×ln(RH) , (12)
where the evapotranspiration rate is calculated as ET=LE/λ (kg m−2s−1) and Rv is the gas constant of water vapor
(0.461 kJ kg−1K−1for moist air).
The sum of entropy of ecosystem fluxes (J, W m−2K−1)
for each half-hour was then calculated by adding all entropy fluxes between the surface and atmosphere:
J =JRl+JRs+JLE+JH+JG+JGEE+JReco+JLEmix. (13)
The conversion of low entropyRsandRlto high entropy heat
at the surface through absorption ofRs andRl, respectively,
was calculated as σRs=Rs,net
1 Tsrf − 1 Tsun , (14)
σRl=Rl,in
1 Tsrf − 1 Tsky , (15)
whereTsrfis the radiometric surface temperature (Eq. 9) and
σRsandσRlare in W m
−2K−1.
The overall half-hourly entropy production (σ, W m−2K−1) was then calculated as the sum of the en-tropy productions ofRsandRl:
σ=σRl+σRs. (16)
We excluded the factor 4/3, which is associated with the transfer of momentum exerted by electromagnetic radiation on a surface (Wu et al., 2008), in our calculations ofσ and J for entropy production and entropy fluxes because we as-sumed that radiation pressure at the sites would be negligible (see Ozawa et al., 2003; Kleidon and Lorenz, 2005; Fraedrich and Lunkeit, 2008; Kleidon, 2009; Pascale et al., 2012).
To account for the difference in absorbed radiation on leaf and non-vegetated surfaces, we partitionedσusing EVI as an approximation for fractional vegetation cover. Accordingly, σof non-vegetated surfaces (σland) was estimated as
σland=(1−EVI)×σ. (17)
Entropy production on leaf surfaces (σleaf, Eq. 18) was
cal-culated as the sum of entropy production (σPAREq. 19) from
absorbed photosynthetic active radiation (FPAR in W m−2, Eq. 20); entropy production from the remainder ofRs−PAR
(σRs,leaf, Eq. 21), assuming all was absorbed and converted
into heat on leaf surfaces; and entropy production from ab-sorbed longwave radiation on leaf surfaces (Eq. 22). σleaf=σPAR+σRs,leaf+σRl,leaf, (18)
where σPAR=FPAR
1 Tair − 1 Tsun , (19)
FPAR=EVI×PAR, (20)
σRs,leaf=(Rs−PAR)
1
Tair
− 1
Tsun
×EVI, (21)
σRl,leaf=σRl×EVI. (22)
We assumedTair was close to leaf temperature. While this
formulation may introduce assumptions about the absorptive behavior of leaves, it helps us to estimate entropy production from the metabolic processes of photosynthesis and respira-tion (Sm) as follows:
Finally, we estimated half-hourly change in entropy produc-tion (S) over time (t) in W m−2K−1 of the ecosystem by
adding entropy flux of imports (JRs,net,RRl,in) and exports
(i.e.,JLE,JH,JG,JGEE,JReco,JRl,up, JLEmix) and entropy
production of vegetated and non-vegetated surfaces:
dS/dt=J+σland+σleaf. (24)
Note that this approach does not account for entropy pro-duction due to frictional dissipation of entropy from rainfall or subsurface water flow, as these would be of even smaller magnitude than entropy production from metabolic activ-ity of the ecosystem (Brunsell et al., 2011). Here negative dS /dt represents the export of entropy of the ecosystem to its surroundings.
2.6 Ecosystem entropy models for radiation and ecosystem fluxes
We estimated half-hourly MEP of the radiation budget (MEPrad) in W m−2K−1, to compare site differences in
ra-diation energy use and entropy dissipation.
Empirical MEP (MEPrad) was determined following Stoy
et al. (2014), by estimating the MEP of half-hourly Rs
(MEPRs) andRl(MEPRl):
MEPRs=Rs,in
1
Tsrf
− 1
Tsun
, (25)
MEPRl=Rl,net
1
Tsrf
− 1
Tair
, (26)
MEPrad=MEPRs+MEPRl. (27)
This method offers a means to compare different sites with respect to their reflective and absorptive capacities versus a reference ecosystem that absorbs and dissipates all incident solar energy. Note that MEPRl is often of lower magnitude
than MEPRsbecause here we assume that an efficient
ecosys-tem would dissipate less energy through sensible heat, such thatTsrfwould approachTair.
The half-hourly entropy ratio of radiation is then calcu-lated usingσlandandσleafas follows:
effrad=
σland+σleaf
MEPrad
. (28)
We refer to this ratio as an efficiency to describe differences in the absorptive characteristics at the sites, where a ratio closer to 1 would indicate high radiation absorption. Further-more, sites that maintain lower surface temperatures through greater LE fluxes would also increase their entropy produc-tion, thus linking ecosystem functional efficiency with ra-diative entropy production. We then estimated the variable effflux as the ratio of incoming radiation entropy (JRs and
JRl,in) and the sum of exported entropy fluxes (JLE,JH,JG,
JGEE,JRecoandJRl,up) to assess how entropy was partitioned
into entropy production and entropy fluxes over the different study years.
2.7 Statistical analyses
We estimated average daily values for all response variables to decrease autocorrelation for statistical analysis. We first tested for significant differences in environmental and struc-tural variables among the three sites prior to the entropy analysis. We estimated simple general linear mixed models (GLMMs) using the R packagenmleto look at differences among sites for rain, SWC, vapor pressure deficit (VPD), EVI,Tsrf,Tair,Tsky andTsoil, as well asRs,in,Rs,out,Rl,in
and Rl,out. All response variables were daily means. For
rainfall we calculated monthly sums to estimate differences among the sites. We included a random effect for day of mea-surement to account for repeated meamea-surements, as well as an AR(1) structure to account for temporal autocorrelation among measurements. The model of rainfall only included year and site as independent variables and no random effects. Independent variables for the other models were month, year and site, as well as their interactions.
Subsequently, we estimated GLMMs of daily energy (Rn,
LE,H,Gand NEEe) and entropy fluxes (JLE,JH,JG and
Sm), entropy production (σ), entropy ratios (effradand effflux)
and overall entropy (dS /dt) to quantify their differences by environmental and structural variables by site. For all mod-els we included random effects and an AR(1) autoregressive correlation structure to account for repeated daily measure-ments. All models initially included independent variables for site, year and month, mean EVI, SWC, VPD and daily rainfall sums. We also included interactions of environmen-tal variables with site, site with year and site with month to determine changes in the energy efficiency over the study pe-riod among sites. Independent variables and their interactions were deemed significant whenp <0.05. We used a Tukey adjustment to test for significant differences among sites. GLMM analyses were performed via the R packagesnlme, lsmeansandcar(Fox and Weisberg, 2011; Lenth, 2016; Pin-heiro et al., 2014).
3 Results
3.1 Differences in environmental, radiative and temperature variables among sites
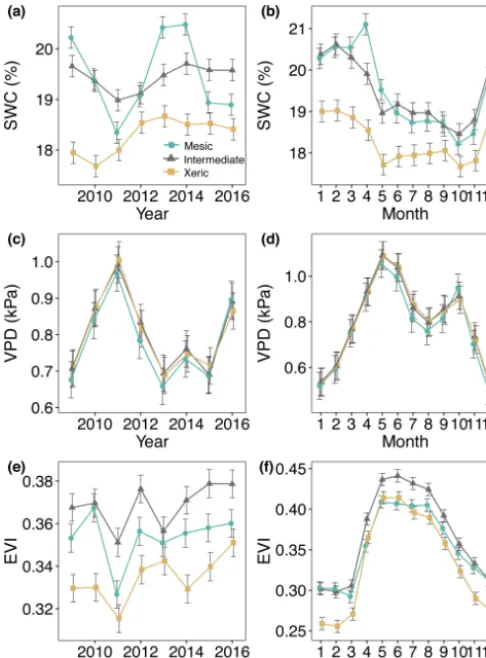
Figure 1.Least squares mean predicted values from mixed models of environmental and structural variables for the years 2009–2016 at the mesic, intermediate and xeric sites, with average annual(a, c, e)and monthly(b, d, f)means of(a, b)soil water content (SWC),
(c, d)vapor pressure deficit (VPD) and(e, f)enhanced vegetation index (EVI). Error bars represent standard errors (SE).
lower (0.02–0.04) at the xeric site compared to the other two sites (Fig. 1e and f), while the intermediate site had a sig-nificantly higher EVI compared to the mesic site, except in 2010.
DailyTsrfat the mesic site was significantly higher than the
xeric site for all years except 2012, 2014 and 2016 (Fig. 2a). From 2012 to 2016 the intermediate site had higherTsrf
com-pared to the other two sites. Tair was significantly lower at
the mesic site compared to the intermediate and xeric sites for all years, except in 2012 and in 2014, when the xeric site had higherTair compared to the intermediate (Fig. 2a).
Tsoil was significantly lower at the mesic site compared to
the other sites, except in 2013, when there was no significant difference between the mesic and xeric sites. For all years, dailyTsoilwas significantly higher at the xeric site compared
to the intermediate site except for 2011 and 2012, when the intermediate site was significantly higher.
Rs,outwas significantly higher at the xeric site compared
to the other sites, except for 2014, where we found no
sig-Figure 2.Least squares mean predicted values from mixed mod-els of annual sky temperature (Tsky), air temperature (Tair), surface temperature (Tsrf), and soil temperature (Tsoil) at the mesic, inter-mediate and xeric sites. Error bars represent SE.
nificant difference between the intermediate and xeric sites. Daily Rs,out was also significantly lower at the mesic site,
compared to the intermediate site, except in 2009. Aver-age daily Rl,out was significantly lower at the mesic site
compared to the intermediate site during all years, except for 2011 and 2012, and compared to the xeric site for all years, except for 2011. The intermediate site had signifi-cantly higherRl,outcompared to the xeric site during 2013,
2014 and 2016. As a consequence of these component fluxes, Rn was significantly higher at the xeric site compared to
the intermediate site for all years except 2009 and 2014 (Fig. S2a, Table S3). AverageRnwas significantly lower at
the mesic site compared to the xeric site in 2013 and 2016 and was significantly higher compared to the xeric site from 2009 to 2011. Average daily Rn significantly increased at
the intermediate and xeric sites but showed no change at the mesic site with an increase in EVI (Fig. S3a).
Environmental, radiative and temperature variables also tended to be significantly different among months within site and in many instances among sites by month. Differences followed seasonal patterns, as noted in Fig. S2 and Table S2. 3.2 Understory wiregrass and woody abundance at the
sites
Wiregrass was virtually absent at the intermediate site for all years of this study (Fig. 4a), whereas woody species were more abundant compared to the others. The mesic and xeric sites both had higher proportions of wiregrass in the under-story (∼25 % versus 5 % at the intermediate site), which slightly decreased during 2011 (Fig. 4a). In addition, woody biomass increased to∼75 g m−2at the xeric site during 2011 but not at the mesic site. In 2012, woody biomass decreased to ∼40 g m−2 at the xeric and intermediate sites and re-mained low during the following years at the xeric site but increased at the intermediate site (>100 g m−2, Fig. 4b). 3.3 Energy fluxes ofH, LE andG
[image:7.612.46.289.66.395.2]Figure 3.Least squares mean predicted values from mixed mod-els of annual average radiation at the mesic, intermediate and xeric sites for the years 2009–2016:(a)annual incoming and outgoing shortwave radiation (Rs,inandRs,out) and(b)annual incoming and outgoing longwave radiation (Rl,inandRl,out). Error bars represent SE.
the xeric site for all years, except for 2015. We found no sig-nificant difference between the mesic and xeric sites in 2009, 2010, 2014 and 2016, but for the other years of this study the xeric site had significantly higher LE. LE significantly in-creased at all sites with higher EVI, with a greater increase at the intermediate and a smaller increase at the xeric site, com-pared to the mesic site (Fig. S3g). LE significantly increased at all sites with an increase in SWC and VPD (Fig. S3e and f). LE at the intermediate site was significantly lower com-pared to the other sites for all levels of VPD (Fig. S3g). LE was significantly lower with higher rainfall, with no signifi-cant differences among sites (Fig. S3h).
There was no significant difference in H between the mesic and intermediate sites, except in 2011 and 2013, when the mesic site was higher than the intermediate site, and in 2015 and 2016, when the reverse occurred. H was signifi-cantly lower at the xeric site compared to the mesic site for all years except for 2014 and 2016 and compared to the interme-diate site for all years except 2011 and 2013. AverageHwas significantly higher at the mesic site compared to the xeric site during the months of May through October (Fig. S2b). The intermediate site had significantly lowerH compared to the other two sites for the months of January through March, and the xeric site had significantly lowerHfor June through October. Compared to the other two sites, average H was significantly lower at the intermediate site when EVI was
greater than 0.4 and significantly higher at the xeric site for EVI>0.5 (Fig. S3i). Average H significantly decreased at all sites with an increase in SWC (Fig. S3j). Average dailyH significantly increased at all sites with an increase in VPD, with a lower decrease at the intermediate site (Fig. S3k).
Gwas significantly lower at the intermediate site during 2016 (negative), compared to 2009 through 2011 and 2014. Average daily G was positive during summer months and negative during winter months (October through March) at all sites (Fig. S2b). Average dailyGsignificantly decreased with an increase in EVI at the mesic and intermediate site but had no significant change at the xeric site (Fig. S3m).G was significantly less positive at the xeric site compared to the other sites for EVI<0.3 but was significantly more neg-ative at the intermediate site compared to the mesic and xeric sites when EVI was above 0.4. AverageGsignificantly de-creased (to negative) with an increase in SWC (Fig. S3n) and significantly increased (to positive) with an increase in VPD but only at the intermediate and xeric sites (Fig. S3o). Daily rainfall did not significantly alterGat the sites, but the in-termediate site had significantly more negativeGcompared to the other two sites (2–10 W m−2) when daily rainfall was positive (Fig. S3p).
3.4 Entropy production and fluxes ofJH,JLEandJG For all years, average dailyσ (as the sum ofσlandandσleaf)
was significantly higher at the mesic site compared to the intermediate site (by>0.01–0.036 W m−2K−1; Fig. 5a, Ta-ble S4), whileσ was not significantly different between the mesic and xeric sites for almost all years (Fig. 5a). Aver-age dailyσsignificantly increased with EVI, independent of site (Fig. 6a), and also significantly increased with SWC and VPD, with a greater slope at the xeric site (Fig. 6b and c). Average dailyσ significantly decreased at all sites with an increase in rainfall (noting that entropy production from rain-fall itself is not considered here and assumed to be approx-imately equal among ecosystems), andσ was significantly lower at the intermediate site during rainy periods compared to the other two sites (Fig. 6d). There was no significant dif-ference inσat the mesic and xeric sites for all levels of rain. The xeric site had significantly higher average dailyJLE,
ranging from∼0.22 to 0.28 W m−2K−1, versus the interme-diate site with∼0.18–0.25 W m−2K−1 (Fig. 5a, Table S4) for all years, except 2015.JLEat the xeric site was also higher
than the mesic site in 2011 through 2013 and in 2015, rang-ing from 0.2 to 0.26 W m−2K−1. The mesic site had∼0.01–
0.06 W m−2K−1 higher J
LE compared to the intermediate
site, except in 2011.JLEsignificantly increased with greater
EVI and SWC (Fig. 6e and f).JLE was significantly higher
at the xeric site compared to the other sites for EVI<0.4. JLE was significantly higher at the xeric site compared to
the other sites when SWC was above 19 %, similar to the model of LE.JLEsignificantly increased with VPD and
Figure 4. (a)Wiregrass and(b)woody understory biomass from 2009 through 2015 at the mesic, intermediate and xeric sites. Note that the sampling protocol changed to a 2-year measurements cycle in 2013, such that measurements were not made in 2014 and 2016.
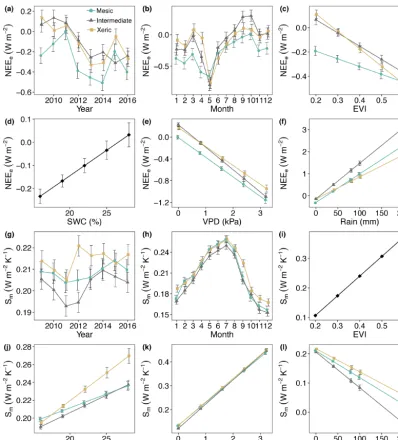
Figure 5.Least squares mean predicted values from mixed mod-els of annual(a)and monthly(b)average entropy production (σ) and entropy fluxes of latent energy (JLE), sensible heat (JH) and ground heat (JG) at the mesic, intermediate and xeric sites. Error bars represent SE.
model results for LE, the effects of VPD were not signifi-cantly different by site.
Models of H and JH were similar, except that JH
in the mesic and xeric sites was not significantly dif-ferent in 2015 (Fig. 5a, Table S4). Average daily JH
was significantly higher at the mesic site in 2011 and 2012 (∼0.2–0.24 W m−2K−1) compared to the
intermedi-ate (∼0.19 W m−2K−1; Fig. 5a) and xeric sites (∼0.16– 0.20 W m−2K−1). In 2009, 2010 and 2012, the xeric site had significantly lowerJH compared to the other sites (by ∼0.02 W m−2K−1).JH decreased only at the mesic and
in-termediate sites with increasing EVI (Fig. 6i) such that the intermediate site had significantly lowerJH compared to the
other sites when EVI was above 0.4.JH decreased with
in-creased SWC at all sites, and the xeric site had significantly lowerJH compared to the other sites when SWC was above
19 % (Fig. 6j). VPD significantly increasedJH at all three
sites, with a greater increase at the xeric site (Fig. 6k).JH
sig-nificantly decreased at all sites with increased rainfall, where the intermediate site had significantly lower JH compared
to the mesic and xeric sites when rainfall was greater than 40 mm per day (Fig. 6l).
Average daily JG was not significantly different among
the years 2009–2014 and 2016 at the mesic site but signif-icantly increased during 2015 (Fig. 5a, Table S4), similar to the model results for G. Similarly,JG was significantly
lower at the intermediate site during 2016 (negative).JGat
the xeric site was not significantly different by year. Aver-age dailyJG was positive during summer months and
nega-tive during winter months at all sites (Fig. 5b). Average daily JG significantly decreased from positive to negative at the
mesic and intermediate sites with an increase in EVI, with no significant change at the xeric site (Fig. 6m), similar to the model ofG.JG was significantly more negative at the
intermediate site compared to the other sites for EVI>0.4. AverageJG only significantly decreased at the intermediate
and xeric sites (to negative), such thatJG was significantly
more negative at the two sites when SWC was above 18 % (Fig. 6n).JG significantly increased with greater VPD,
in-dependent of site (Fig. 6o). Similar to the model ofG, daily rainfall did not significantly alter the magnitude ofJGat the
sites. However, the intermediate site had significantly more negativeJGcompared to the other two sites when daily
rain-fall increased (Fig. 6p).
3.5 Metabolic energy and entropy
[image:9.612.47.289.254.461.2]dur-Figure 6.Least squares mean predicted values from mixed models of(a–d)entropy production (σ) and entropy fluxes of(e–h)latent energy (JLE),(i–l)sensible heat (JH), and(m–p)ground heat (JG) by site and(a, e, i, m)enhanced vegetation index (EVI),(b, f, j, n)soil water content (SWC),(c, g, k, o)vapor pressure deficit (VPD) and(d, h, l, p)rain. For(g),(h)and(o)the interaction with site was not significant, as signified by a single black line. Error bars represent SE.
ing May and significantly decreased during August through October, which resulted in positive NEEe at the
intermedi-ate site (Fig. 7b). NEEe significantly decreased at all sites
with an increase in EVI, which was greater at the xeric site (Fig. 7c). An increase in SWC resulted in decreasing NEEe,
independent of site (Fig. 7d). An increase in VPD signifi-cantly decreased NEEe to more negative at all sites, with a
greater decrease at the intermediate site (Fig. 7e). Increases in rainfall significantly increased NEEeto positive at all sites,
where the intermediate site had a greater increase compared to the other sites (Fig. 7f).
Results of the model ofSmindicated that the mesic site had
significantly greater metabolic entropy production compared to the intermediate site for all years but 2009 and 2013. The xeric site had significantly greaterSmcompared to the mesic
site in 2012 through 2014 and in 2016 and compared to the intermediate site for all years (Fig. 7g).Smwas greater
[image:10.612.51.547.63.492.2]Figure 7.Least squares mean predictive values from mixed model of(a–f)the metabolic energy flux (NEEe) and(g, l)metabolic entropy fluxes of (Sm) by site and(a, g)year,(b, h)month,(c, i)enhanced vegetation index (EVI),(d, j)soil water content (SWC),(e, k)vapor pressure deficit (VPD) and(f, l)rain. For(d)and(i)the interaction with site was not significant, as indicated by a single solid black line. Error bars represent SE.
January, April, October and December. Values ofSm
signifi-cantly increased with an increase in EVI, independent of site (Fig. 7i). SWC significantly increasedSmat all sites, with a
greater slope at the xeric site (Fig. 7j). Higher VPD signifi-cantly increasedSmsimilar to the model of NEEe; however
slopes were more similar among the sites (Fig. 7k). Rainfall significantly decreasedSmto∼0 with a greater slope at the
intermediate site, similar to the model of NEEe(Fig. 7l).
3.6 Entropy models
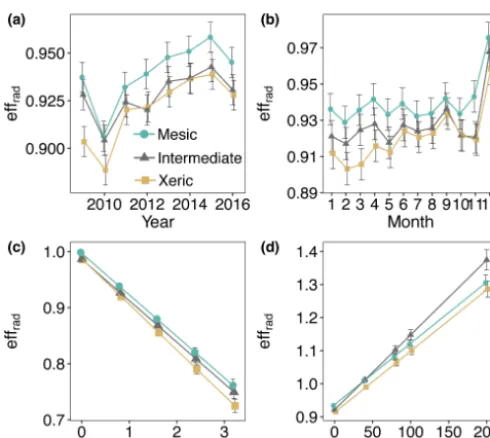
From 2011 through 2016, effrad was significantly higher at
the mesic site (0.89–0.93), compared to the intermediate (0.88–0.91) and xeric (0.88–0.92) sites, which were not sig-nificantly different (Fig. 8a). Average effraddid not
signifi-cantly change with EVI or SWC. Higher VPD signifisignifi-cantly decreased values of effradat all sites (Fig. 8c). The mesic site
had significantly higher values of effradcompared to the other
two sites for all levels of VPD (Fig. 8c). Rainfall significantly increased values of effradat all sites, with a greater increase
Figure 8.Least squares mean predicted values from mixed models of average daily half-hourly radiative entropy efficiencies (effrad) at the mesic, intermediate and xeric sites by(a)year,(b)month,
(c)vapor pressure deficit (VPD) and (d)rain. Soil water content and the enhanced vegetation index were not significant in the model. Error bars represent SE.
Daily average efffluxwas significantly greater at the mesic
site for most of the measurement period (Fig. 9a, Table S6). effflux was significantly higher at the xeric site compared
to the intermediate site for the years 2009, 2011, and 2013 through 2015. For 2012 and 2016 the intermediate site had significantly greater efffluxcompared to the xeric site. Greater
EVI only significantly increased effflux at the mesic site,
which had higher efffluxcompared to the other sites for all
levels of EVI (Fig. 9c). The intermediate site had signifi-cantly lower efffluxcompared to the xeric site when EVI was
above 0.3. An increase in SWC significantly decreased val-ues of efffluxonly at the intermediate and xeric sites, with a
greater decrease at the xeric site (Fig. 9d). Higher VPD sig-nificantly decreased efffluxat all sites, with a greater decrease
at the intermediate site (Fig. 9e). Rainfall significantly in-creased efffluxat all sites, where the intermediate site showed
the highest increase (Fig. 9f).
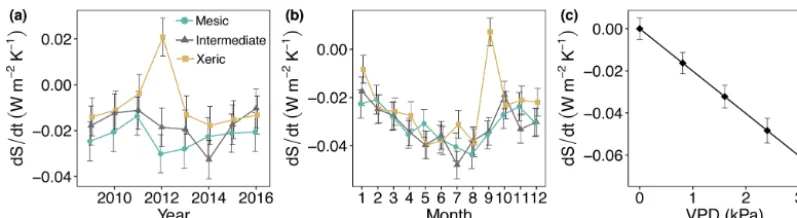
There was no significant difference in dS /dt among sites for all years and months, except in 2014, where the inter-mediate site had significantly higher dS /dtcompared to the other sites (Fig. 10a, Table S6). In addition, the xeric site ac-cumulated dS /dt during 2012 such that it was significantly different from the other sites. An increase in VPD resulted in a significant increase in dS /dt(more entropy export), inde-pendent of site (Fig. 10c). EVI, SWC and rainfall were not significant in the model of dS /dt. The diurnal variation in dS /dt was greater at the mesic and xeric sites during the drought years 2010, 2011 and 2012, compared to the
inter-Figure 9.Least squares mean predicted values from mixed mod-els of average daily half-hourly flux entropy efficiencies (effflux) at the mesic, intermediate and xeric sites by(a)year,(b)month,
(c)enhanced vegetation index (EVI),(d)soil water content (SWC),
(e)vapor pressure deficit (VPD) and(f)rain. Error bars represent SE.
mediate site, specifically during nighttime (Fig. S4). At the intermediate site dS /dt varied more during the years 2014 and 2016, as seen by greater entropy accumulation during nighttime hours and greater export during daytime hours for the year 2014.
4 Discussion
Here we describe differences in energy use efficiencies of sites with varying structural complexities (i.e., understory composition, basal area, DBH) using metrics of energy and entropy. Different from our expectations, environmental and structural effects on energy and entropy fluxes were not dif-ferent with the exception of NEEe and Sm. These results
[image:12.612.307.550.65.394.2]dur-Figure 10.Least squares mean predicted values from mixed models of average daily entropy at the mesic, intermediate and xeric sites by
(a)year,(b)month and(c)vapor pressure deficit (VPD). Soil water content and rain, as well as the interactions with site, were not significant in the model. Error bars represent SE.
ing the drought at all sites but not significantly so (Fig. 7), whereas NEEe showed significant change at the mesic site.
The different results were a function of SWC, which de-creased during the summer of 2011, thus lowering the flux of Sm (Fig. 7). Furthermore, greater Rs,out during the drought
indicated lower available energy to drive photosynthetic pro-cesses. The decreases inSmand NEEesuggest that metabolic
activity was affected by low rainfall, increasing VPD and changes in temperature, demonstrating lower physiological activity of plant species during drought (Barron-Gafford et al., 2013). This decrease in metabolic efficiency supports a previous study at the mesic and xeric sites, which found lower electron transport and carboxylation capacity during drought (Wright et al., 2012).
Differences in the underlying reflective capacities at the sites significantly altered their entropy production and resulted in variation in entropy exchanges (Stoy et al., 2014). The more structurally complex mesic site had greater metabolic entropy production (Sm) compared with the
inter-mediate site. GreaterSmat the mesic site translates to greater
energy accumulation, in addition to greater radiation entropy and export efficiencies (effrad, effflux), compared to the
in-termediate site, which had greater land use legacy and was structurally similar but lower in plant functional diversity. Al-though the radiation entropy ratio (effrad) indicated that both
the intermediate and xeric sites were equally energy efficient in terms of absorbing radiation, effflux andSm showed
pro-longed recovery of energy efficiency from drought by 1 year at the intermediate site. Entropy change over time (dS /dt) did not significantly vary at the mesic site but was more vari-able at the xeric and intermediate sites following the drought. We hypothesized that the xeric site would have higherH andJH, due to its open canopy and sandy soils, and
there-fore lower volumetric heat capacity. In contrast to our first hypothesis, the mesic and intermediate sites and not the xeric site had a more pronounced increase inH andJH when EVI
decreased during drought (Fig. 1). Lower H andJH at the
xeric site was a consequence of greater energy partitioning into LE, enabled by greater transpiration rates of plant func-tional types present at the site (deciduous and evergreen oaks
in the understory, midstory and overstory; Klein et al., 2013; Renninger et al., 2015; Stoy et al., 2006). This result was confirmed, as JH fluxes did not significantly change with
an increase in EVI, whereasJLE increased, suggesting that
evapotranspiration and the cooling of leaf and soil surfaces had greater influence on the partitioning of available energy. In contrast,JH increased more at the mesic and xeric sites
with increasing VPD, suggesting that drier air increased the sensible heat flux from the surface to the atmosphere (Mass-mann et al., 2018). Similarly, as VPD increased so did σ at all sites. This response was also observed in Kuricheva et al. (2017), where drier summers resulted in greater en-tropy production, likely because an increase in VPD cor-related with greater absorption of solar radiation and parti-tioning to H (Fig. 3a). Even though plant abundance was lower at the xeric site, its species composition was better adapted to drought conditions, which allowed for higherJLE
compared to the other sites (Roman et al., 2015). Further-more, an increase in EVI during summer months at the xeric site increasedJLE, demonstrating that greater leaf area
en-hanced ecosystem function (Peng et al., 2017; Zhu et al., 2016). Interestingly, JLE did not vary significantly by site
with changes in VPD, which supported the findings of Whe-lan et al. (2013) that all sites had similar stomatal regulation to increases in VPD. Overall, the xeric site had higherJLE
compared to the other sites for EVI<0.5, even though the site basal area was almost half that of the mesic and inter-mediate sites (Table 1). An overstory composed of more oak species at the xeric site (∼20 %) along with the C4
under-story resulted in higher transpiration during spring and sum-mer, compared to stands containing just pine trees (Klein et al., 2013; Renninger et al., 2015; Stoy et al., 2006). Addition-ally, C4grasses and oak species at the xeric site were better
[image:13.612.99.498.64.173.2]dur-ing summer. This led to similar entropy export efficiencies at all sites as evidenced by all sites having comparable dS /dt. Nevertheless, asσ increased with greater absorption of radi-ation due to an increase in EVI,JH decreased as a result of
higher SWC, resulting in temporary entropy accumulation at the xeric site during the end of 2012 (Fig. 4), which may have contributed to higherTaircompared to the other sites (Fig. 2).
In contrast, the mesic site was affected by the interaction of biological and radiative forces, asJLEand effraddecreased
more severely with decreasing plant leaf area compared to the xeric site (lower EVI; Fig. 1e). As a consequence of lower LE andJLEduring the drought, more energy was partitioned
intoHin 2011 (Fig. 6), as air, soil and surface temperatures increased due to lower leaf area (Figs. 1 and 2), indicating a shift of ecosystem function (Ban-Weiss et al., 2011) towards lower-quality energy degradation (Kuricheva et al., 2017). This initially depleted soil moisture storage at the mesic site (Fig. 1) and further decreased LE and JLE(Kim and Wang,
2012; Lauri et al., 2014). Nevertheless, the shift in energy partitioning at the mesic site allowed for the maintenance of dS /dt during drought, by export of entropy which had ac-cumulated during nighttime hours (Fig. S4), demonstrating an adaptation of the site to changes in resource availability (Basu et al., 2016; Brodribb et al., 2014). In contrast, the xeric and intermediate sites showed greater variability in an-nual dS /dt following the drought when rainfall returned to pre-drought levels and SWC increased (Fig. 10a). Neverthe-less, the rapid increase inJLEin 2012 at the mesic and xeric
sites indicated an increase in ecosystem function through greater evapotranspiration. This provides evidence of recov-ery following the drought, because JLEis of higher-quality
entropy dissipation (Kuricheva et al., 2017), coupling both mass and heat dynamics (Brunsell et al., 2011), whereasJH
is a function of the thermal gradient (Kleidon, 2010; LeMone et al., 2007). In general, plant species at the mesic site were better adapted to higher soil water conditions, as entropy and energy fluxes did not change as drastically with increasing SWC compared to the other sites.
This recovery of EVI following drought also allowed for greater effradat the sites. But effradwas higher at the mesic
site despite lower EVI compared to the intermediate site. This finding supports our second hypothesis, that sites with greater plant functional diversity maintain greater radiative entropy production. The mesic site efficiently used available energy from incoming solar radiation (Fig. 2) through lower reflection ofRsand by emitting less longwave radiation (Lin,
2015). Effrad decreased during the initial drought year
be-cause all sites reflected more Rs, likely a consequence of
a change in EVI, as well as leaf angle from a decrease in SWC and altered plant hydraulics. Higher effradand effflux
at the mesic site are consistent with enhanced function due to greater plant diversity in the understory (Fig. 4a). For ex-ample, wiregrass, a C4species, can maintain photosynthetic
rates under high temperatures (Osborne and Sack, 2012; Ward et al., 1999), which allows for greater energy storage
during unfavorable environmental conditions (Brunsell et al., 2011). Despite higher wiregrass biomass in the understory, the xeric site was less efficient in using available radiation energy, indicated by highRs,outandRl,out(Brunsell et al.,
2011). Structural limitations of the canopy (i.e., lower basal area) impeded the efficient absorption of available radiation, therefore lowering effrad(Norris et al., 2011). Furthermore,
larger proportions of deciduous oak trees at the xeric site (Ta-ble 1), which typically shed their leaves during the winter, lowered the capacity of the system to acquire radiation (Bal-docchi et al., 2004: Fig. 8b). Nevertheless, this inefficiency was not confirmed by model results forSm, which, in contrast
to NEEe, revealed higher metabolic function at the xeric site
relative to the mesic and intermediate sites, reflecting greater metabolic performance despite differences in basal area and site EVI. Overall our results demonstrate that the mesic site was better adapted to changes in resource availability by way of altering its reflective properties, where energy partitioning adjusted to maintain steady entropy exports relative to in-coming entropy (Gunawardena et al., 2017; Otto et al., 2014; Taha et al., 1988).
Nevertheless, metabolic activity decreased during rainy periods (Sm∼0), demonstrating an inefficiency in
maintain-ing optimal function when environmental pressure was im-posed on the system. High metabolic function at the mesic site resulted in more rapid increases in the structural com-plexity as indicated by a decrease in Rs,out following the
drought when compared to the intermediate site (Brunsell et al., 2011; Holdaway et al., 2010). Metabolic activity (in energy terms) at the intermediate site was largely dependent on EVI (i.e., leaf area), demonstrating lower biological con-trol of individual plant species (i.e., stomatal concon-trol; Ur-ban et al., 2017) but a strong influence of total leaf area on metabolic function and the export of entropy (Brunsell et al., 2011; Figs. 4 and 6). This was further illustrated at the inter-mediate site through less negative metabolic energy (NEEe)
when EVI was∼ 0.25 (Fig. 7c). Even though EVI in 2012 was greater at the intermediate site this did not correspond to higherJLE(Fig. 5a), which was also shown by a lack of
significant change in entropy exports with changes in EVI (effflux, Fig. 9c). The result of lower metabolic function at
the intermediate site is intriguing as the mesic and intermedi-ate sites were structurally similar, based on similarBA, mean
DBH and overstory tree composition (Table 1). The ineffi-ciency appears to be a consequence of anthropogenic modi-fication, which homogenized the ecosystem, leading to a de-crease in understory plant functional types (Table 1; Fig. 3), thereby reducing values of effrad, efffluxandSm. This result
inter-mediate site. Our third hypothesis was therefore supported, as the intermediate site had lower efffluxrelative to the mesic
and xeric sites. Lower plant functional diversity, specifically the lack of wiregrass, due to soil perturbations that took place prior to stand establishment (>95 years ago), likely lowered metabolic function, which in turn affected entropy exports at the intermediate site and its recovery from drought. For ex-ample, a negativeJG at the intermediate site was observed
with increasing SWC, suggesting poor soil water drainage, which is also likely a consequence of agricultural legacy (Kozlowski, 1999). A prolonged increase in efffluxcompared
to the other sites showed that the intermediate site did not adapt its entropy exports, in addition to greater reflection of Rsduring drought recovery. This result indicates that
differ-ences in soil conditions and lower plant functional diversity at the intermediate site reduced entropy exports compared to the other sites (Meysman and Bruers, 2010), such that plant functional types present at the site could not rescue the ecosystem’s function during disturbance (Elmqvist et al., 2003). Furthermore, while the intermediate site showed no change in dS /dt during the drought, following the drought the export of entropy significantly increased, resulting in more unstable conditions (Fig. 10a). The increase in entropy export corresponded to high annual rainfall and soil moisture conditions (Figs. 1 and S1), once more suggesting that soil characteristics were altered due to its agricultural legacy. The lower ability to adapt to changes in resource availability at the intermediate site could induce its degradation if environ-mental fluctuations become more frequent and severe with climate change (Mori, 2011; Siteur et al., 2016). This could further exacerbate instabilities for nearby sites, as changes in the reflective properties of degraded sites can alter microcli-mate and weather patterns across whole ecosystems (Norris et al., 2011).
We conclude that the analysis of entropy dynamics in re-lation to structural and environmental variables gives valu-able insights into the functional complexity of ecosystems and their ability to adapt to drought. A combination of en-tropy fluxes and enen-tropy ratios revealed how differences in structural and/or functional characteristics affect energy effi-ciencies in longleaf pine ecosystems. Our results show that all sites demonstrated adaptive capacity to extreme drought, as indicated by a lack of significant change in dS /dt, except for greater variations at the xeric and intermediate sites fol-lowing the drought. We show that overall low entropy exports at the site with greater land use legacy had the potential to decrease ecosystem function (Meysman and Bruers, 2010), especially during high rainfall events. Changes in climate and natural and human-induced disturbances are becoming more frequent and severe (IPCC, 2014), demanding more predictive power about how changes in ecosystem structure and function will alter resilience to disturbances. Future pol-icy, conservation or restoration applications depend on reli-able measures such as the metrics presented here to monitor ecosystem function following disturbances (Haddeland et al.,
2014; Porter et al., 2012; Reinmann and Hutyra, 2016; Thom et al., 2017). This is especially critical for anthropogenically modified systems, as their land use history can affect changes in energy use efficiency and thus alter their ability to recover from disturbances (Bürgi et al., 2016; Foster et al., 2003). The application of entropy metrics could improve our under-standing of the interaction of structure, function and legacy on energy use efficiency across a variety of global ecosys-tems.
Data availability. Data used in this paper have been archived
with the AmeriFlux Data Management Project (https://ameriflux. lbl.gov/sites/siteinfo/US-LL1, Starr and Brantley, 2019a; https:// ameriflux.lbl.gov/sites/siteinfo/US-LL2, Starr and Brantley, 2019b; https://ameriflux.lbl.gov/sites/siteinfo/US-LL3, Starr and Brantley, 2019c). Interested parties can access the data through their own ac-count, which can be created on the AmeriFlux Management Project website. Enhanced vegetation index (EVI) estimates were obtained from MODIS Aqua (MYD13Q1) and Terra (MOD13Q1) vegetation indices products 16-Day L3 Global 250 m SIN Grid via the NASA Land Processes Distributed Active Archive Center (LP DAAC) and the USGS Earth Resources Observation and Science Center (EROS) at https://lpdaac.usgs.gov/products/mod13q1v006/ (Didan, 2015a) and https://lpdaac.usgs.gov/products/myd13q1v006/ (Di-dan, 2015b).
Supplement. The supplement related to this article is available
online at: https://doi.org/10.5194/bg-16-1845-2019-supplement.
Author contributions. GS and LRB designed and acquired funding
for the research. SW and CS analyzed the data. PCS aided SW with the theories of entropy and energy density. All authors contributed to the writing of the manuscript.
Competing interests. The authors declare that they have no conflict
of interest.
Acknowledgements. The authors thank the Forest Ecology
lab-oratories personnel, with special thanks to Tanner Warren, An-dres Baron-Lopez and Scott Taylor for data collection and provision during the study at the Joseph W. Jones Ecological Research Cen-ter. Christina L. Staudhammer and Gregory Starr acknowledge sup-port from the US National Science Foundation (DEB EF-1241881). Paul C. Stoy acknowledges support from the US National Science Foundation (DEB 1552976 and 1702029) and the USDA National Institute of Food and Agriculture (Hatch project 228396).
Review statement. This paper was edited by Christopher Still and
References
Amthor, J. S.: From sunlight to phytomass: On the poten-tial efficiency of converting solar radiation to phyto-energy, New Phytol., 188, 939–959, https://doi.org/10.1111/j.1469-8137.2010.03505.x, 2010.
Aoki, I.: Entropy Principle in Living Systems (Min–Max Princi-ple), Entropy Principle for the Development of Complex Bi-otic Systems, chap. 2, 87–88, https://doi.org/10.1016/B978-0-12-391493-4.00008-1, 2012.
Baldocchi, D. D., Xu, L., and Kiang, N.: How plant functional-type, weather, seasonal drought, and soil physical proper-ties alter water and energy fluxes of an oak–grass savanna and an annual grassland, Agr. Forest Meteorol., 123, 13–39, https://doi.org/10.1016/j.agrformet.2003.11.006, 2004.
Ban-Weiss, G. A., Bala, G., Cao, L., Pongratz, J., and Caldeira, K.: Climate forcing and response to idealized changes in sur-face latent and sensible heat, Environ. Res. Lett., 6, 034032, https://doi.org/10.1088/1748-9326/6/3/034032, 2011.
Barron-Gafford, G. A., Scott, R. L., Jenerette, G. D., Hamer-lynck, E. P., and Huxman, T. E.: Landscape and environmen-tal controls over leaf and ecosystem carbon dioxide fluxes under woody plant expansion, J. Ecol., 101, 1471–1483, https://doi.org/10.1111/1365-2745.12161, 2013.
Basu, S., Ramegowda, V., Kumar, A., and Pereira, A.: Plant adaptation to drought stress, F1000Research, 5, 1554, https://doi.org/10.12688/f1000research.7678.1, 2016.
Beer, C., Ciais, P., Reichstein, M., Baldocchi, D., Law, B. E., Pa-pale, D., Soussana, J. F., Ammann, C., Buchmann, N., Frank, D., Gianelle, D., Janssens, I. A., Knohl, A., Köstner, B., Moors, E., Roupsard, O., Verbeeck, H., Vesala, T., Williams, C. A., and Wohlfahrt, G.: Temporal and among-site variability of inherent water use efficiency at the ecosystem level, Global Biogeochem. Cy., 23, GB2018, https://doi.org/10.1029/2008GB003233, 2009. Bohn, F. J. and Huth, A.: The importance of forest structure to biodiversity–productivity relationships, Roy. Soc. Open Sci., 4, 160521, https://doi.org/10.1098/rsos.160521, 2017.
Bonan, G. B.: Forests and climate change: forcings, feedbacks, and the climate benefits of forests, Science, 320, 1444–1449, https://doi.org/10.1126/science.1155121, 2008.
Brodribb, T. J., McAdam, S. A. M., Jordan, G. J., and Martins, S. C. V.: Conifer species adapt to low-rainfall climates by following one of two divergent pathways, P. Natl. Acad. Sci. USA, 111, 14489–14493, https://doi.org/10.1073/pnas.1407930111, 2014. Brunsell, N. A., Schymanski, S. J., and Kleidon, A.: Quantifying the
thermodynamic entropy budget of the land surface: is this use-ful?, Earth Syst. Dynam., 2, 87–103, https://doi.org/10.5194/esd-2-87-2011, 2011.
Bürgi, M., Östlund, L., and Mladenoff, D. J.: Legacy effects of hu-man land use: Ecosystems as time-lagged systems, Ecosystems, 20, 94–103, https://doi.org/10.1007/s10021-016-0051-6, 2016. Campbell, G. S. and Norman, C. G.: An introduction to
environ-mental biophysics, Springer Science & Business Media, 1998. Clement, R.: EdiRe data software, School of Geosciences, The
Uni-versity of Edinburgh, Edinburgh, Scotland, 1999.
Dai, A., Qian, T., Dai, A., Trenberth, K. E., and Qian, T.: A Global Dataset of Palmer Drought Severity Index for 1870–2002: Re-lationship with Soil Moisture and Effects of Surface Warming, J. Hydrometeorol., 5, 1117–1130, https://doi.org/10.1175/JHM-386.1, 2004.
Didan, K.: MYD13Q1 MODIS/Aqua Vegetation In-dices 16-Day L3 Global 250 m SIN Grid V006 [Data set], NASA EOSDIS Land Processes DAAC, https://doi.org/10.5067/MODIS/MYD13Q1.006, 2015a. Didan, K.: MOD13Q1 MODIS/Terra Vegetation
In-dices 16-Day L3 Global 250 m SIN Grid V006 [Data set], NASA EOSDIS Land Processes DAAC, https://doi.org/10.5067/MODIS/MOD13Q1.006, 2015b. Elmqvist, T., Folke, C., Nyström, M., Peterson, G., Bengtsson,
J., Walker, B., and Norberg, J.: Response diversity, ecosystem change, and resilience, Front. Ecol. Environ., 1, 488–494, 2003. Finzi, A. C., Norby, R. J., Calfapietra, C., Gallet-Budynek, A., Gie-len, B., Holmes, W. E., Hoosbeek, M. R., Iversen, C. M., Jackson, R. B., Kubiske, M. E., Ledford, J., Liberloo, M., Oren, R., Polle, A., Pritchard, S., Zak, D. R., Schlesinger, W. H., and Ceulemans, R.: Increases in nitrogen uptake rather than nitrogen-use effi-ciency support higher rates of temperate forest productivity un-der elevated CO2, P. Natl. Acad. Sci. USA, 104, 14014–14019, https://doi.org/10.1073/pnas.0706518104, 2007.
Foster, D., Swanson, F., Aber, J., Burke, I., Brokaw, N., Tilman, D., and Knapp, A.: The importance of land-use legacies to ecology and conservation, Bio-Science, 53, 77–88, https://doi.org/10.1641/0006-3568(2003)053[0077:TIOLUL]2.0.CO;2, 2003.
Fox, J. and Weisberg, S.: car: Companion to Applied Regression, Second Edition, Thousand Oaks CA, 2011.
Fraedrich, K. and Lunkeit, F.: Diagnosing the entropy budget of a climate model, Tellus A, 60, 921–931, https://doi.org/10.3402/tellusa.v60i5.15498, 2008.
Franklin, J., Serra-Diaz, J. M., Syphard, A. D., and Re-gan, H. M.: Global change and terrestrial plant commu-nity dynamics, P. Natl. Acad. Sci. USA, 113, 3725–3734, https://doi.org/10.1073/pnas.1519911113, 2016.
Goebel, P. C., Palik, B. J., Kirkman, L. K., and West, L.: Field guide: landscape ecosystem types of Ichauway, Joseph W. Jones Eco-logical Research Center at Ichauway, Newton, Report number 97–1, 1997.
Goebel, P. C., Palik, B. J., Kirkman, L. K., Drew, M. B., West, L., and Pederson, D. C.: Forest ecosystems of a Lower Gulf Coastal Plain landscape: Multifactor classification and analysis, J. Torrey Bot. Soc., 128, 47–75, https://doi.org/10.2307/3088659, 2001. Gunawardena, K. R., Wells, M. J., and Kershaw, T.:
Util-ising green and bluespace to mitigate urban heat is-land intensity, Sci. Total Environ., 584–585, 1040–1055, https://doi.org/10.1016/j.scitotenv.2017.01.158, 2017.
Haddeland, I., Heinke, J., Biemans, H., Eisner, S., Flörke, M., Hanasaki, N., Konzmann, M., Ludwig, F., Masaki, Y., Schewe, J., Stacke, T., Tessler, Z. D., Wada, Y., and Wisser, D.: Global water resources affected by human interventions and climate change, P. Natl. Acad. Sci. USA, 111, 3251–3256, https://doi.org/10.1073/pnas.1222475110, 2014.
Hammerle, A., Haslwanter, A., Tappeiner, U., Cernusca, A., and Wohlfahrt, G.: Leaf area controls on energy partitioning of a temperate mountain grassland, Biogeosciences, 5, 421–431, https://doi.org/10.5194/bg-5-421-2008, 2008.