Abstract— The urban population in 2014 accounted for 54% of the total global population, up from 34% in 1960, and continues to grow. The global urban population is expected to grow approximately 1.84%, 1.63% and 1.44% between 2015 and 2020, 2020 and 2025, and 2025 and 2030 respectively. This growing population puts pressure on government not only to accommodate the current and potential citizens but also provide them facilities and services for a better living standard. Providing a sustainable growing environment for the citizens is the biggest challenge for the government. As the populations increase, complexity network of transportation, water and sanitation, emergency services, etc. will increase many folds. SMART CITY Mission is being implemented to resolve this issue. As the cities turn smart, so should the transportation facilities. India on June 2018 had only 20 cities with populations of over 500,000 have organized public transport systems, pointing to the large gap to be bridged in their journey to turn smart. The aim of this paper is to examine the impact of smart card data from public transport for improving the predictions and planning of public transport usage and congestions. The mobile apps like M-Indicator, Google Maps don’t interlink, do not have a real time tracking of vehicles, fare distribution, congestion-based route mapping for public transportation. These factors are addressed in the paper with its advantages and disadvantages. This paper also talks about how information from smart card is to be extracted, how Big Data is to be managed and finally come to a smart, sustainable Urban Transit System. This paper also brings into light the data security issues and measures to curb those issues. This paper proposes and emphasizes on a single smart card for all modes of public transport.
Keywords: Application, Data, Mobile Application, Smart Card, Transportation
I. INTRODUCTION
Majority of the existing public transportation systems including metro lines, suburban railways and bus connectivity has been expanded based on the idea majority of the population live in both ends of a business area. Thus, these routes are often complex and sometimes even difficult to use. Cities and urban transportation systems face several challenges, such as traffic congestion, inadequate parking spaces, inequitable access for all residents, lack of last mile connectivity, poor road safety or pollution. According to Forbes India Article published in July 2018, India loses $21.3 billion annually due to traffic congestion. Coupling with this, there are connectivity issues. One, where there is actually no connectivity to parts of town or a city. This is coupled with other issues such as reliability, frequency, punctuality, accessibility. In this case, people want to travel but there is no sufficient mode of public transport available.
Revised Manuscript Received on September 10, 2019.
Angshuman Baruah, currently pursuing MBA in Infrastructure Management from SCMHRD, Pune, Maharashtra, India.
Lalitha Sannidhi, currently pursuing MBA in Infrastructure Management from SCMHRD, Pune, Maharashtra, India.
Two, where there is connectivity but then people do not know how to travel or navigate. This happens usually when there is huge influx of population specially to metropolitan cities that are spread across large areas. People migrate from rural areas to these urban areas have difficulty in travelling. And people who want to explore or visit few parts of the city face difficulty in reaching their destination using public transport because they are not aware and of the modes available and the path that is to be taken. There is also no system or platform that provides information regarding modes of transport available. Also due to large population growth, the existing transportation systems become insufficient. Hence people resort to usage of private vehicles and the use of public transportation is declining with only 18.1 percent people in Indian cities using public transportation for work-related travel.
To fully utilize the urban transportation, great importance must be given on transfer nodes. Though studies have been done on the importance of transfer nodes on efficient utilization of urban transport, effective research has not been done to harness full potential of smart card and its applications. Also, there is no direct integration of web-based applications, routes, mode of transport and fares. Google Maps give us a route which will take the least time depending on the mode of transportation and m-Indicator (which is used for navigating in Mumbai)- a mobile application gives us the timings of various modes of transport. However, if we are in a railway station or bus stand, both these app doesn’t show where the bus or train is at currently and how long will it take to reach the station or bus stop. Also, both apps don’t show the fares.
The availability of data for transportation planners is increasing day by day. This is helpful in analyzing, modeling and predicting urban mobility behavior. Data from General Transit Feed Specifications (GTFS), Automatic Vehicle Location (AVL), Automatic Passenger Counting (APC), and Automatic Fare Collection (AFC) technologies help in getting the raw feed which can be used to plan the layout of the transportation system.
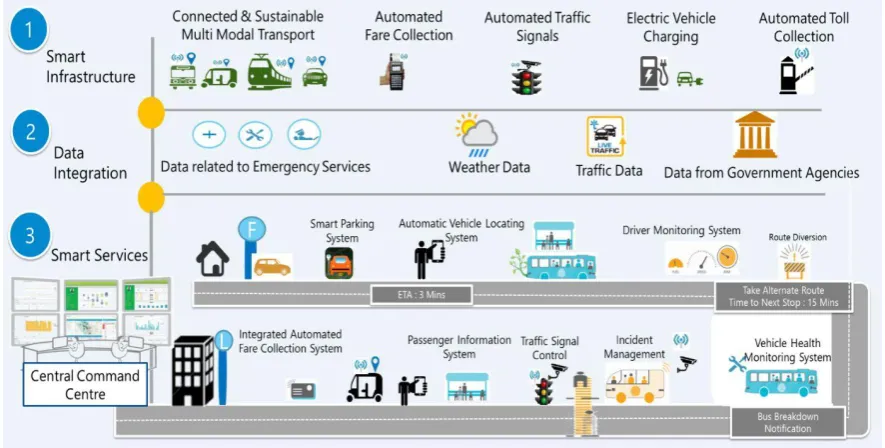
Growing population puts pressures on cities to enhance their infrastructure and services to not only accommodate all existing and potential residents but also to enable them to lead a good quality of life. In solving the pain points faced by city-dwellers today, smart transportation can offer an
Rationalizing Urban Transportation using Smart
Card Data
answer where conventional approaches such as interlinking roads, upgrading constructions or introducing high-speed vehicles fall short. This can be done by implementing new
[image:2.595.81.524.101.325.2]and smart techniques at the root level that is the planning stage for transportation systems in cities. It can also be used for restructuring and improving the transportation system.
Fig. 1 . Smart Transportation
One of the major challenges in upgradation or new development according to Moh senNa zemet alNazem et al are construction around stations could significantly limit accessibility; bus route detours or major schedule modifications due to events or construction; and partial or complete service disruptions due to major construction or renovation on strategic infrastructure. So prior planning with minimum disruption in essential.
“Smart card data according to Moh senNa zemet alNazem et al will would help decision makers to arrange better disruption schedule, design more adequate mitigation strategies and communication plans, and maintain ridership and customer satisfaction. Also, any travel pattern change can be detected in the system. Smart card will also monitor any disruption is service. In London, UK, AFC data was used to analyze trip patterns before and after the closure of the East London Line for reconstruction (White et al., 2008).”
“In recent years, researchers and practitioners exploited the very precise and voluminous data from smart card AFC systems on strategic (long-term planning), tactical (service adjustment and network development) and operational (ridership statistics and performance indicators) levels (Pelletier et al., 2011).”
The data-driven approach delivers a structured framework of using smart card data as a panel survey, and also an alternative to conventional before-after surveys.
One of the many solutions such as connected transportation system, intelligent transport management etc is smart card system. And data being prime component essential for planning can be acquired through the use of smart card in public transport.
II. NEED/BACKGROUND OF THE STUDY
The purpose of this paper is to examine the impact of smart card data from public transport for understanding the existing situation and also improving the predictions of public transport usage and congestions. The ultimate goal is to propose a system that incorporates smart card and a user-based application that can be used to collect data and make use of the data recorded to plan public transportation.
Several studies questioned if one day observation records would be sufficient to build mobility models. “In this context, Huff and Hanson (1986) [1] discussed the relation between regularity and variability in human mobility behavior and define some metrics to measure both phenomena. In their research, they observed high regularity around few places (home, work and shopping), but also a high travel variability between each day. They found that users had more than one daily pattern and each daily pattern was highly distinctive.”
Also, conducting surveys specifically for the purpose of transportation incurs time, manpower and huge costs.
III. SMART CARD
A system of multi mobility cards for public transportation already exists in London and Singapore. Based on this concept, a single card has been developed for making payments across all segments including metro, bus, suburban railways, toll, parking, smart city and retail shopping, called One Nation One Card.
[image:3.595.373.486.97.258.2]Currently in India, there are individual passes for buses and suburban local trains that are given and are to be renewed on a monthly basis. Plus, there are separate cards for metro rails that are recharged as per basis of usage and requirements by individuals.
Fig. 2. Hyderabad Metro Card
For example, in case of Hyderabad Metro, L&T has made a provision of metro card for passengers. The passengers have to deposit a basic fare to purchase the card. He can recharge it with amount as per his requirement either at the counter or via Paytm. There is also a provision to search for the route from one place to another via paytm.
Function of the card: By using this card at the station, a passenger gets access to the station area. He can board any train and also change route/train as per his travel needs till his destination. At his destination, he has to use his card again to exit the station. The fare gets collected by the system according to the distance travelled by the passenger.
IV. SMART CARD APPLICATION FORM
A single application form that can be filled online or offline has to be created. This form should be available at all bus stops, metro stations, sub urban railway stations. Assumption is taken that one card will be used by single individual. The following details must be obtained from the users via this application form:
1. Name
2. Age
3. Gender 4. Occupation
5. Residential Address
6. Contact Numbers (including emergency contact details)
7. Physically Challenged
[image:3.595.74.275.187.268.2]When the application form is submitted online, a unique identification code/number is generated. The transport authorities should connect this number to a smart card and deliver it to the users via post or ask the users to collect it from station. When the user collects it from a station, he has to give the unique code generated online.
Fig. 3. Bar Code/Chip linked to Unique Identification Number
[image:3.595.326.538.362.443.2]When this application form is submitted at a station, a card with unique code is given to the user. The details of the application form must be fed directly into the system after linking it with the code.
Fig. 4. Card reader/scanner
These cards have bar code or chips that are linked to the unique identification code/number. All the public transport systems must have card reader or scanner that reads the chips. These readers/scanners must be put at appropriate places such as entrances at metro stations and sub urban railway stations, entrances of buses and enabled with meters in auto rickshaws. That is all the public transport systems must be full check-in/check-out.
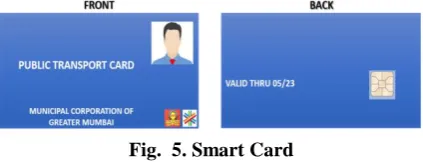
Fig. 5. Smart Card
V. KEY FEATURES OF THE CARD
Smart cards can be used for multiple modes. They can be bought by users with basic fare for once and then recharge it. Smart card requires fare deposit, hence is more secure and can reduce fraud [2]. These cards can be used for 1 year and then renewed. Upon giving the card back, users get back the basic fare paid. The card has to be recharged with amount as per requirement either at the stations manually or via the app.
To encourage people to use smart card, for every 100 rupees spent, get 1 coin. These coins can later be converted/used for travel. Multifunctionality of a smart card presents the flexibility that ensures that not all their cash is committed to just one use [2]. This will result in commuters going for this card. As the volume of card users increases, so does the population pool. This will enable us to plan for sustainable transportation aimed at fulfilling the efficiency of transportation.
[image:3.595.60.280.689.787.2]Fare and ticketing integration can affect the travel experience and the willingness to take public transport [4], [5].
Another method to encourage users is by giving special provisions. Senior citizens and persons with disability (PWD) can avail concession upon application and submission of necessary documents since these are personalized. (copied from who uses smart card paper). Concessions are given to students.
Currently, only while boarding a public transport service, commuters are required to validate their fare. But we put the system where money is taken at the end of the trip and not at the beginning. This way people can recharge their cards directly themselves. They do not have to get the pass renewed. Also, it's better as it becomes citizen friendly.
VI. MOBILE APPLICATION
There are multiple apps that are currently used for navigation in India. One of the most prominently used app is google maps. This can be used in a city of the country. When a user sets the origin and destination in google maps, it gives information related to various modes. It has a separate tab for each mode. In case of cars and 2-wheelers, the app displays distance that is to be travelled with multiple route options, associated time and delay.
The other options are walking and use of public transport. In the public transport tab, it gives information about metro and bus routes that are available, their station locations and the distance that is to be covered by walk.
Example:
I am taking an example where I travel from my house to my college. There are 2 localities called KPHB and Masab Tank in Hyderabad. My house is located in KPHB and my college is located in Masab Tank.
Google maps shows the gives options to travel using public transport connecting bus and metro.
Option 1:
One of the options it gives is direct travel by bus. But nowhere is it mentioning the fare that will be incurred if I travel by bus.
Option 2:
It gives multiple options of travel via metro and bus together. A passenger taking the routes that are displayed has to travel in metro either till Lakdi-Ka-Pul or Nampally and then take a bus. Again, the fare for each mode is not given.
The route options that are displayed are helpful but are limited. There are other options that are faster. A passenger has the following options:
Fig. 6. (From left) My location-KPHB to College, Masab Tank, Bus Route, Metro & Bus Rout
1. Take a bus from KPHB till SR Nagar and transfer to another bus or an auto till Masab Tank.
2. Take a bus from KPHB till Ameerpet and then transfer to another bus or an auto till Masab Tank.
3. Take a bus from KPHB till Panjagutta and then transfer to another bus or an auto till Masab Tank.
4. Take a bus from KPHB till Ladki-Ka-Pul and then transfer to another bus or walk or take an auto till Masab Tank.
5. Take metro till Ameerpet and then transfer to a bus or an auto.
6. Take metro till Panjagutta and then transfer to a bus
or an auto.
[image:4.595.89.514.385.649.2]7. There is a shared auto service from JNTU, which is the closet point from my house, till Hi-Tech City railway station. A passenger can avail shared auto service till Hi-Tech City railway station, from there he can take a train till Lakdi-Ka-Pul and then either walk or talk an auto to Masab Tank.
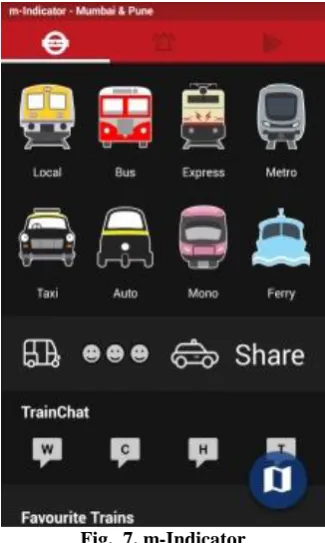
Fig. 7. m-Indicator
Google maps does not give any details regarding the fares of the mode of travel. It does not give any information regarding suburban railways or autos/shared autos.
There is also another mobile app that is used in m-Indicator that can be used for navigation in Mumbai and Pune. All the tabs give information about available suburban trains, buses, metro rails etc when origin and destination is fed with their timings. But this information is given separately for all the modes. It is not given for the entire route.
Both these apps give information about routes to be taken and transport modes that are available but there are drawbacks with both of them as they give information only about one mode of transport, do not disclose fares, do not show connection between various modes or do not show route options that include all the modes of public transport, do not show the real time location of the mode of transport.
A new mobile application can be developed that overcomes these issues. This mobile app must be linked to the Smart Card via the unique identification code/number by the users. This app gives the following information when a user feeds in origin and destination:
1. Routes that are available and can be taken
2. Information about all modes (connectivity, interchanges, platform)- number and availability of modes involved, distance to be travelled in each mode,
3. Fares- total fare and break up of fare of each mode 4. Frequency
5. Time taken to travel in each mode and time taken for transfer from one mode to another
6. Provides information that ensures user convenience when transferring between different transportation [6].
7. Complete path to reach destination 8. Real time scenario of crowd (red, blue) 9. Track location of vehicle
10. Automatic fare collection/e-Payment option 11. Feedback tab
The app also saves the route travelled so it can be tracked by the user as well as the transport department/manager. Users can also update the other modes of transport and routes that can be taken.
The data from the smart card captures the origin departure time and destination time of the commuters which enable in determining the arrival and destination time. Also, since the smart card will be linked by smartphone, we can get real time data and thus we can get real time location.
The integrated app can be used to inform users about any such issues before hand. The app will not only inform but also give information about other possible routes so that they can change their course of travel.
Let us take an example of Mumbai. Suppose I’m in Bhandup station and I want to go to Thane Kopri, now Google maps will give me options of two wheelers, four wheelers, Bus and walking. Now suppose I select train, then it will show option of train and walking, but there is no mention of where the train is currently at or what is my fare. Now if I open M-Indicator, I will find out only on which platform the train will arrive. Also, if I don’t have an ATMV card or a train pass, I will have to stand in queue for ticket. A smart card integrated with an app will solve this entire problem.
1. I’ll open the app and enter my location and destination.
2. It will give me multiple route options to chose from with their fares and frequencies
3. Suppose I chose Train-Bus-Metro, then at the end of each journey I will have to touch a card reader pad and amount will be paid.
The app will also have a provision to see the current location of the train, bus and metro. A master run of the data will give me location wise segregation of population density and their mode of transportation.
VII. DATA RECORDED
With the advent of smart card data, public transport authorities can now have access to a better view of the use of their service [1]. As the card is linked with information provided by the users, it gives a better idea of the socio-economic and demographic profile of the users. Data related to the physical condition (physically challenged) of the population using public transport can be obtained.
replaces the need for surveys and data can be collected directly. This can also reduce the amount of fraud data collected.
VIII. BIG DATA MANAGEMENT
Data recorded can be managed by transferring to Data Warehouse. Hadoop/Map reduce can be used to manage & analyze big data. Sentiment analysis of feedback through text mining techniques can also be performed.
IX. TRANSPORTATION PLANNING
Transportation planning comprises of 5 aspects. They are strategic planning, tactical planning, operational planning, transit planning and marketing policy. The following can be done under each of the aspects.
1. Strategic Planning: Plan distance between stops, network layout planning, user type segmentation, loyalty and long-term ridership study.
2. Tactical Planning: Frequency and scheduling based on hourly variations, travel patterns, route use and journey reconstruction
3. Operational Planning: Vehicle scheduling, fraud analysis, schedule adherence and load profile
4. Transit Planning: Focus on how service can be improved
5. Marketing & Policy: Integrated system of transport & fares
X. ADVANTAGES & DISADVANTAGES OF SMART CARD
The advantages of using smart card are as under: 1. Improved access & information
2. Hassle free travel 3. Grievance redressal
4. Safety & profile of passenger known 5. Manage accidents
There might be users who are not willing to share their information. Considering the socio-economic profile of the country, the population of illiterate is high. These people might not be able to use the card.
XI. DATA ANALYSIS & RESULTS
Our analysis and various studies have proved that mode integration including fare and ticketing with the use of technology can affect the travel experience and the willingness to take public transport.
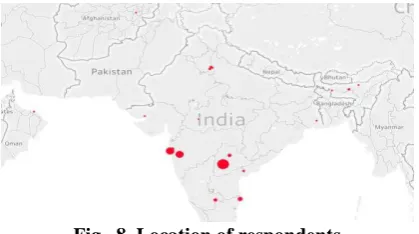
[image:6.595.328.538.49.166.2]The source of data was primary data. A total of 500 samples were collected from various parts of the globe to get an overall idea of responsiveness of the people, at the same time confining 99% the population to India. The total responses may not total up to 500 specially in case of questions related to current use and non-use of smart cards or pass.
Fig. 8. Location of respondents
The survey instrument used for data collection is questionnaire. This was shared with people spread across various parts of the world using online platforms such as google. Responses were also recorded electronically. The data that was collected online was retrieved into format where it could be cleaned. Microsoft excel was used for the purpose of analysis.
[image:6.595.372.487.322.447.2]They were answered by people living in major metropolitan areas of India. To get an international view we also collected a few responses from Kabul, Afghanistan & Muscat, Oman too. The responses were given by people who work.
Fig. 9. Analysis- figure 1
According to figure 1, out of the total population 19% of the commuters have the option of Personal vehicles and another 19% of the population have the option of commuting via Auto Rickshaw. It is also worth noting that 12% of the population have the option of walking and another 5% have the option of commuting to work via cycle.
Fig. 10. Analysis- figure 2
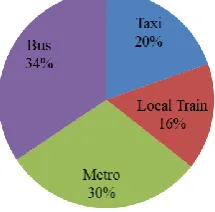
[image:6.595.379.486.532.644.2]Fig. 11. Analysis- figure 3
[image:7.595.121.229.59.165.2]We asked for their daily modes of travel and as shown in the figure 3, out of 74% of the people who use public transportation, 34% of the population travel by Bus, 30% travel by Metro and only 16% of the population commute by Local Train for their daily commute. However even though 12% of the population have the option of walking and another 5% have the option of commuting to work via cycle (fig 1), no one of our respondents uses cycle or walk to their places of work.
Fig. 12. Analysis- figure 4
The demographics of our data is quite balanced as shown in figure 4.
Fig. 13. Analysis-figure 5 (From left) Male & Female
[image:7.595.325.535.256.454.2]We analyzed the selection of modes of public transport for both the genders and found out it’s almost the same in all the cases except for Local Train and Taxi. The male population gave preference to Local Train over Taxi and this is exactly the opposite in case of female population. (Figure 5)
Fig. 14. Analysis-figure 6 (From left) Male & Female
[image:7.595.112.234.305.436.2]This raises the question of comfort, space and reliability. (Figure 6)
Fig. 15. Analysis-figure 7 (from top left) Male-Before, After & Female-Before, After
Respondents were willing to travel via public transportation if the issues with comfort, space and reliability were addressed. (Figure 7) Adressing the issues with comfort, space and reliability, there is a 40% increase in potential male users and 21% increase in potential female users.
Fig. 16. Analysis-figure 8
[image:7.595.58.289.480.603.2] [image:7.595.371.491.575.700.2]Fig. 17. Analysis-figure 9
We then asked our respondents why they don’t have any smart card or passes. (figure 9)
Fig. 18. Analysis-figure 10 (Metro-M, Bus-B, Local Train-LT, Auto-A)
According to our respondents they don’t opt for such smart card or passes because as per 29% of the total population, they are useful for one mode of transport. We don’t have a single smart card for all modes of transportation available. In our transfer nodes, we have to either get new tickets or use different passes and if the pass gets expired people either renew their pass then or travel without ticket for that day. This practice is very prevalent in Mumbai suburban railways. This is one of the factors as to why people don’t go for public transportation. (figure 10)
[image:8.595.73.275.55.198.2]As per our responses, majority of the population wants a single card integrating Buses, Metro and Local Trains in a smart card. The next major response is for integrating Auto Rickshaws and Taxis to Buses, Metro and Local Trains in a single smart card.
Fig. 19. Analysis-figure 11
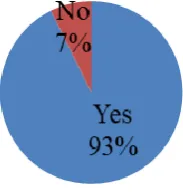
[image:8.595.59.288.241.327.2]When asked our population that if we single card integrating Buses, Metro and Local Trains in a single smart card, a staggering 93% of the total population agreed for going for this all-purpose single smart card. (figure 11)
Fig. 20. Analysis-figure 12
Even though all the details of the users will be protected and kept confidential only 23% are comfortable in sharing their names and 22% of the population is comfortable sharing their contact number. People are quite uncomfortable in sharing their occupation and their residential address. This raises a question on the people’s trust on the system and the way their data is protected. (figure 12)
XII. CONCLUSION
The study done is a complete bottom up approach. It focuses on the importance of transfer nodes instead of end to end connectivity. We bought out what the commuters want and how their services can be made better. The study of smart cards is limited in India and confined to a few places only. The existing apps like Google Maps and m-indicator give the information on public transport and routes, not its location and availability. This study addresses the gap between the existing apps and smartcard. Smart card data can be used for overall sustainability planning of the public transportation network. Significant emphasis is given on one card for all modes of public transport. The study suggests that collection of fare should happen at the time of embarking not at the time of alighting. It also brings out the advantages and disadvantages of smartcard. Finally, this paper sheds light on the various issues in data sharing and which information people would like to share. This gives an insight on people’s perspective in data security and its importance.
XIII. REFERENCES
1. C. Espinoza, M. Munizaga, B. Bustos, and M. Trépanier, Assessing the public transport travel behavior consistency from smart card data”, Transportation
Research Procedia, vol 32, 2018, pp. 44-53. DOI:
10.1016/j.trpro.2018.10.008
2. Y. Lu, I. Mateo-Babiano, and E. Sorupia, “Who uses smart card? Understanding public transport payment preference in developing contexts, a case study of Manila's LRT-1”, IATSS Research, vol 43(1), 2019, pp 60-68. DOI: 10.1016/j.iatssr.2018.09.001
3. H. Gong, and W. Jin, “Analysis of Urban Public Transit Pricing Adjustment Program Evaluation Based on Trilateral Game”, Procedia - Social And Behavioral
[image:8.595.127.219.533.630.2]10.1016/j.sbspro.2014.07.211
4. M. Štastná, A. Vaishar, and K. Stonawská, “Integrated Transport System of the South-Moravian Region and its impact on rural development”, Transportation Research
Part D: Transport And Environment, vol 36, 2015, pp
53-64. DOI: 10.1016/j.trd.2015.02.012
5. S. Chowdhury, and A. Ceder, “Users’ willingness to ride an integrated public-transport service: A literature review”, Transport Policy, vol 48, 2016, pp 183-195. DOI: 10.1016/j.tranpol.2016.03.007
6. H. Nishiuchi, T. Todoroki, and Y. Kishi, “A
Fundamental Study on Evaluation of Public Transport Transfer Nodes by Data Envelop Analysis Approach Using Smart Card Data”, Transportation Research
Procedia, vol 6, 2015, pp 391-401. DOI:
10.1016/j.trpro.2015.03.029
XIV. AUTHORS PROFILE
Angshuman Baruah, currently pursuing MBA in Infrastructure Management from SCMHRD, Pune (2018-2020). Completed B. Tech in Mechanical Engineering from Vellore Institute of Technology, Vellore (2010-2014). Research work includes ELSEVIER Paper Publication, titled ‘Optimization of AA5052 in incremental sheet forming using grey relational analysis’ & IJCAET Paper Publication, titled ‘Optimization and formability study of AA5052 through incremental sheet forming’.