Abstract: Controlling crime is one of the necessary things for a peaceful life. Forecasting the crime helps in planning the strategies in this task. Modern data analysis techniques like classification and prediction may be utilized for this purpose. Classification is a data mining approach that allocates items in a group to target categories or classes. It also may be used to label a target item into any one of the classes identified.Among many available classification techniques, clustering is one of the unsupervised machine learning approaches that could be used for creating clusters as features to enhance classification models. There are various clustering algorithm available like K-mean clustering, Kernel K-mean algorithm etc.PCA algorithm is used to reduce the dimension of the huge amount of data used so that the data can be represented in smaller database with reduced noise in the dataset. In general, mode is a set of values which occurs frequently. Hence, instead of k-mean which is an average value, frequent values may produce better result.K-Mean algorithm creates clusters and groups data properly. But randomly assuming centroid for clusters in the initial stage leads to too much of computational cost. So, in this work, K mode Clustering algorithm was used for clustering asit replaces the Euclidean distance function with the simple matching dissimilarity measure. Once the clusters were formed, a new algorithm was used to forecast the crime rate or future values of the data in the cluster.The proposed approach was tested on crime dataset and found efficient in this domain while comparing with some existing approaches.
Keywords: Machine Learning, K-mode, PCA, Crime rate prediction, Clustering
I. INTRODUCTION
A crime is an unlawful activity for which a man can be penalized by law. Identifying the patterns of the crime and forecasting it to the possible extend is useful for maintaining peace in the society. Crime analysis using previous crime data is a necessary one towards this goal. It is a law implementation task which includes an organized analysis that recognizes and determines the pattern of crime. Also, it is a precise approach for recognizing and analyzing patterns and trends in crime. For analysis of crime using computers, we need to perform some steps like data collection, feature reduction, clustering, prediction.
Feature reduction helps in reducing the dimensions or size of the data to analyze further. Classification is useful in grouping the related data and to identify the label of a data. It also helps to accurately predict the target class for each case in the data.Clustering is one of the techniques used to classify or
Revised Manuscript Received on September 22, 2019.
S. Prabakaran, SRM Institute of Science And Technology
Kattankulathur
Shilpa Mitra, SRM Institute of Science And Technology Kattankulathur
group the data. In this work, an approach used to cluster the crime data and an approach to forecast the crime data are discussed. The result obtained by applying the proposed techniques was found efficient.
II. RELATEDWORK
McClendon and Meghanathan [1] studied different patterns of crime and dataset. They tested the Linear Regression, Additive Regression, and Decision Stump on limited amount of crime set. Linear regression algorithm was found to performtop among three algorithms. The extension was to demonstrate viability and precision of machine learning algorithm which was used in data mining examination for forecasting violent crime patterns. TahaniAlmanie and Lor [2] focused on finding spatial and temporal criminal hotspots using Apriori algorithm for producing interesting frequent patterns for criminal hotspots. Decision tree classifier and Naive Bayesian classifier were applied for predicting future crime in a particular area in a specific time. Through this analysis, we could raise people alertness for various dangerous area and help agencies to forecast crime in particular place in particular time. Malathi A [3] built up a crime examination device using MV Algorithm and Apriori Algorithm for Indian situation. The crime examination device developed consisted four stages for information cleaning, clustering, arrangement and anomaly discovery. The clustering system was utilized to gather information as per the distinctive sort of crime. The arrangement of information was basically used to anticipate future crime pattern and to distinguish future violations. Apparatus created was efficient as far as investigation of speed, recognizing regular crime trend and future forecast. ShijuSathyadevan [4] predicted the regions having high likelihood for crime event and pictured crime inclined ranges. They used Naive Bayes, Apriori algorithm, decision tree algorithm for testing precision of order and forecast various test set. System was trained based on some specific sources of info with the goal that it naturally took in the changing examples in crime by looking at the crime designs. It additionally anticipated crime inclined areas in India on a specific day. Yufei Zhang [5] forecasted crime rate using markov chain model of GIS. The information arrangement of the crime rate was similar to the arbitrary grouping which was reliable to transition probability matrix.
S.Sivaranjani [6] implemented K-Means clustering, agglomerative hierarchical clustering and DBSCAN clustering, execution was
assessed by precision accuracy. It helped law requirement
Design and Development of Machine Learning
Algorithm for Forecasting Crime Rate
organizations to forecast and recognize violations in Tamil Nadu with enhanced exactness which lessened the crime rate. Revised classification algorithms will be used for recognizing criminal to upgrade security and other safety efforts to ensure the crime information are to be developed. Malarvizhi S [7] demonstrated the experimental result on improvised k-means clustering and traditional k means clustering for finding the optimized value for the k value. The improvised clustering algorithm was better to analyze crime from criminal activities dataset. JyotiAgarwal [8] performed crime analysis utilizing k-mean grouping on crime dataset utilizing fast digger instrument. It is simple to distinguish crime pattern over years and can be utilized to outline safety measure techniques for future. It builds viability and proficiency of criminal and knowledge examination. Aaron Christian P [9] proposed genetic algorithm approach. The system provided detection for both violation but detected swerving violations faster than blocks the pedestrian lane violation and process one data at a time but runtime of the system was slow.Anshu Sharma [10] proposed k means clustering algorithm which was used for constructing patterns of data. Data were collected and distributed, two third of genuine data and fraud history data were used for training and remaining data were used for prediction and web crime detection. The accuracy of the proposed work was 94.75% and it efficiently detected the false rate of 5.28%.
III. BACKGROUND
Dimension Reduction
Dimension Reduction is the process of converting a set of data with huge dimensions into data with lesser dimensions suchthat it conveys same type of information. It is useful in reducing the irrelevant data pertained to a particular problem under investigation which in turn reduces the computational burden. Also, it helps for solving machine learning problem to obtain better features for a classification.It helps in data compression which reduces storage space. Various techniques used for feature reduction. Some important feature reduction techniques are Principal component analysis, generalized discriminant analysis, Linear Discriminant Analysis, etc. Among these, PCA is a statistical method used to convert a set of correlated data into linearly uncorrelated data and number of principal component is less or equal to the original number of variables or observation. On the other hand,linear discriminant analysis (LDA) is a methodfor finding a linear combination of features which separates two or more classes of objects or events, mainly used in statistics, pattern recognition and machine learning. Another method is generalized discriminant analysis (GDA), which deals with nonlinear discriminant analysis using kernel function operator. This provides a mapping of the input vectors into high-dimensional feature space. into data with lesser dimensions such that it conveys same type of information. It is useful in reducing the irrelevant data pertained to a particular problem under investigation which in turn reduces the computational burden. Also, it helps for solving machine learning problem to obtain better features for a classification. It helps in data compression which reduces storage space. Various techniques used for feature reduction. Some
important feature reduction techniques are Principal component analysis, generalized discriminant analysis, Linear Discriminant Analysis, etc. Some of the advantage of using dimension reduction method are reduces the time for performing the same task and storage space required, removes multi co-linearity which improve the performance of the machine learning model, can visualize the data easily when it is reduced to low dimensions data.
Clustering
Clustering is the grouping of a similar set of objects based on their characteristics. The condition for clustering is data must be scalable. It must deal with different types of attributes, able to find cluster data and able to find data of high dimensionality. Various clustering techniques used for clustering. Some important clustering techniques are K-Mean clustering, Hierarchical clustering, Fuzzy K-Mean Clustering, etc. Among these, K-mean clustering is an unsupervised algorithm, used for unlabeled data. It is used to find group of data point that are similar in nature. On the other hand, Hierarchical clustering build hierarchy of clusters by assigning data points to a cluster. After that, two nearest clusters are merged into the same cluster and terminated when one cluster is formed. Another method isFuzzy K-Mean Clustering which generate overlapping clusters. Each point of the cluster has the probability that belongs to each cluster based on distance of each centroid.
Proposed Method for crime data analysis
Huge amount of dataset related to crime are collected at the end of the year by the police and stored.Now a days, this data is available in the internet. Datafor this work was collected from the “Open Government Data Platform India (data.gov)”. This consists of data related to various crime across states and union territory for the year 2001 to 2012.Data.gov dataset has been selected because in this dataset, huge number of data is present which consists of data of different types of crimes. This dataset contains the details of 10 years, 28 states and 7 union territories data. As the number of data is more, so for training and testing purpose this data is more useful. Also, it is not a simulated data.
Data analysis
Analyzing this crime data was performed using the combination of PCA and K-mode algorithm, the former used for feature reduction and later used for clustering the data into similar group.
A new approach was used for forecasting the crime rate. For this purpose, the data was divided into two groups: training data set used for clustering and testing data set to evaluate the forecasting technique.
represented in smaller database with reduced noise in the dataset. K-Mode algorithm is used to find the center of the cluster of similar data. Hence, the the combination of PCA and K-Mode algorithm works well and this combination is not used in any other work. New prediction algorithm is chosen as this algorithm is more effective than other algorithms discussed in this work.
PCA Algorithm
PCA is a statistical procedure which is used to convert a set of correlated data into a set of values of linearly uncorrelated variables, called principal components. The number of principal components is less than or equal to the smaller of the number of original variables or the number of observations. It is mainly used in the fields like face a set of correlated data into a set of values of linearly uncorrelated variables, called principal components Principal components consist of fixed pattern in the data and succeeding components maintain the same pattern. It is similar to multivariate procedure called Factor Analysis. The goal is to reduce the dimension but there is no guarantee that the dimensions are interpretable for the principal component. It is good for mean squared error for compressing a pattern of high dimensional vectors into a pattern of lower dimensional vectors and then forms the actual set. The design parameters can be cataloged especially with the instruction for instance by diagnosing the specimen co variance grid. Compression and decompression are simple operations for performing task, using model parameters which require only grid augmentation. Advantages of PCA algorithm are that it reduces the complexity of data, represents the smaller database and reduces the noise in the dataset. In PCA following output arguments are present:
Principal component coefficients: It is returned as a p-by-p matrix, column contains coefficients for one principal component.
Principal component scores: It is returned as a matrix. Rows are observation, and columns are components.
Principal component variances: It is the eigenvalues of the covariance matrix of X.
T-square: It is the sum of squares of the standardized scores for each observation.
Steps of PCA Algorithm:
Dataset is taken and Covariance of matrix is obtained by calculating variances of x1& x2 and covariance of x1-x2is calculated.
Variance (1) Covariance (1, 2) Covariance (1, 2) Variance (2)
Eigen value is obtained by solving function determinant. Eigen vector is obtained by solving matrix.
Obtain coordinate of data point in the direction of Eigen vectors
K-Mode Clustering
The k-mode clustering algorithm is an extension to the
standard k-means clustering algorithm for clustering categorical data. It replaces the Euclidean distance function used in k-means with the simple matching dissimilarity measure.. It is represented by vector of modes of categorical attributes. In general, mode is a set of values which occurs frequently. For example, the mode of set [a, b, a, a, c, b] is a, also more than one mode value. The mode vector of a cluster minimizes the sum of the distances between every single object within the cluster and the cluster center. K-Mode algorithm is used in many fields like Identifying frauds, identification of insurance policy holders with a high claim cost, classification of flora and fauna based in its characteristics, discovering group of customers with similar requirements given a database of customer information and previous buying records, clustering of weblog information to find similar access patterns.Mode is used to represent cluster centers.By using K-Mode algorithm, the efficiency of the clustering process is maintained.In general, mode is a set of values which occurs frequently. Hence, instead of k-mean which is an average value, frequent values may produce better result. The k-mode clustering algorithm is an expansion to the traditional k-means clustering algorithm for clustering categorical data. It is represented by vector of modes of categorical attributes. In general, mode is a set of values which occurs frequently. The mode vector of a cluster minimizes the sum of the distances between every single object within the cluster and the cluster center. The K-mode technique extends K-mean pattern for clustering categorical data by eliminating the limitation of K-means.
Steps of K-Mode Clustering
Select K initial modes, one for each of the cluster. Allocate data object to the cluster whose mode is nearest
to it.
Compute new modes of all clusters.
Repeat step 2 to 3 until no data object has changed cluster membership.
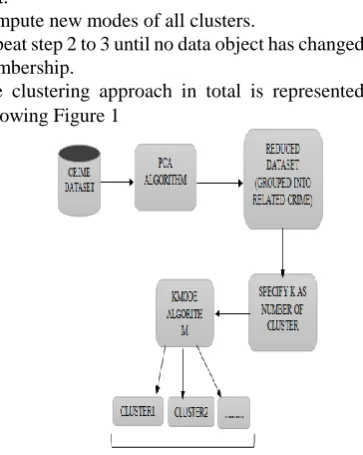
[image:3.595.337.519.477.705.2]The clustering approach in total is represented in the following Figure 1
Figure 1: Flowchart of crime analysis
IV. FINDCENTROIDANDCRIMERATE PREDICTED
analyzing the current and historical fact to determine the future or unknown value. Proposed prediction algorithm is based on the cluster center. For validation of the prediction approach proposed, data from 2001-2010 was used for training data and data of 2011 and 2012 was used for testing.Prediction of crime is done by using PCA, K-Mode and new prediction algorithm. First the dataset is reduced to some dimension and clusters and centers of each cluster are decided by using K-Mode algorithm. After that, summation of each cluster data is calculated and rate is determined by dividing the total value of each cluster with the mean of cluster center. Addition of the total value of each cluster with the rate determined is used to predict the value of next year.
Steps of Proposed Prediction Algorithm Form the clusters usingtraining crime data. Determine the cluster centers.
Determine the summation of each cluster data which are taken for training set.
Calculate the rate by dividing the total value of each cluster with the mean of cluster center.
Add the total value of each cluster with the rate determined in step 4 to predict the value of next year.
Advantages of Proposed prediction Algorithm The increment in the performance of the proposed
algorithm in comparison with the previous popular algorithm is average.
Complexity of the proposed algorithm is less compared to two popular algorithms.
It provides the increased performance with very simple steps used.
Result
Firstly, crime related data were collected from the internet, which consisted of different crime rate of all states and union territory for the year 2001-2012. Crime rate was analyzed by applying PCA algorithm was applied on these data so that attributes were reduced. Then, after reduction, K-mode clustering was applied. By this, five clusters were formed according to states. The same procedure is applied for two different crimes i.e. cruelty, rape. The result obtained after clustering is depicted in the table 1 and table 2.
Cluster States grouped in the cluster Cluster1 Gujarat, Jharkhand, Haryana,
Karnataka, Kerala, Punjab, Tamil Nadu, Delhi
Cluster2 Andhra Pradesh, Assam, Bihar, Odisha, Chhattisgarh, Rajasthan, West Bengal
Cluster3 Madhya Pradesh, Maharashtra, Uttar Pradesh
Cluster4 Himachal Pradesh, Jammu & Kashmir, Tripura, Uttarakhand
Table 1: Clusters formedand the states in these clusters for
data of Rape Crime
Cluster States grouped in the cluster Cluster1 Kerala, Madhya Pradesh, Rajasthan
Cluster2 Andhra Pradesh, Gujarat, Maharashtra, Uttar Pradesh, West Bengal
Cluster3 Assam, Bihar, Haryana, Karnataka, Odisha, Tamil Nadu
[image:4.595.308.541.51.214.2]Cluster4 Chhattisgarh, Jharkhand, Punjab, Tripura, Uttarakhand, Delhi
Table 2: Clusters formed and the states in these clusters for data of Cruelty Crime
After clustering, proposed prediction algorithm was used.
It was applied to each cluster of crime data to forecast the future crime rate. Accuracy of the algorithm on rape crime was73.3%. The results are shown in Table 3.
Table3: Result of applying the proposed algorithm on data of rape crime
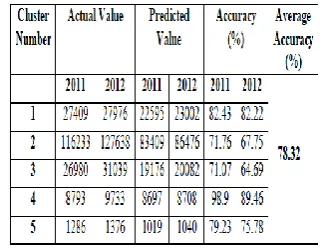
[image:4.595.312.453.333.445.2]The accuracy of the proposed algorithm on administering it on data of cruelty crime was found to be 78.3%. The results are shown in Table 4.
Table 4: Result of applying the proposed algorithm on data of Cruelty Crime
The results were encouraging and the simple algorithm was found to be effective. It also seems to be that even simple forecasting techniques may work better when they are applied on clustered or similar data.For
[image:4.595.310.472.553.678.2]proposed algorithm, proposed approach was compared with two popular existing models namely Gaussian Process [11] and Zero Rule algorithm [12]. The testing with these algorithms were performed through the use of the WEKA tool. A Gaussian process is a stochastic process which uses lazy learning and a measure of the similarity between points for predicting the values of the unknown point. On the other hand, Zero Rule is a classification method which relies on the target and ignores all predictors. It predicts the majority class and also determines baseline performance of another method.The results of applying Gaussian process on the given data set of rape crime is shown in Table 5.
Table 5: Result of applying the Gaussian process on data of rape Crime
[image:5.595.312.463.49.117.2]Similarly the result of applying Zero rule algorithm on the given data set of rape crime is shown in Table 6.
Table 6: Result of applying the Zero rule algorithm on data of rape Crime
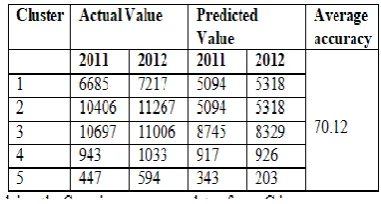
Similarly, the result of applying Gaussian Process algorithm on the given data set of cruelty crime is shown in Table 7.
Table 7: Result of applying the Gaussian process on data of Cruelty Crime
Similarly the result of applying Zero Rule algorithm on the given data set of cruelty crime is shown in Table 8.
Table 8: Result of applying the Zero Rule on data of Cruelty Crime
The results of applying various algorithms in forecasting the crime data simple proposed algorithm was then compared and the results are shown in Table 9.
Algorithm Ra
pe Crime
Cr uel crime Proposed
Algorithm
73. 35
78. 32
Gaussian Process
70. 12
75. 44
ZeroRule 73.
03
78. 30
Table 9: Comparison of various algorithms in predicting the future values
Table 9 shows that the proposed simple algorithm performs better than the two popular algorithms in finding the future data. Also, in comparison, the proposed algorithm is simple in comparison with these two popular algorithms in use.
V. RESULTANDCONCLUSION
Crime analysis is a necessary domain of research in view of detection and prevention of crimes in the society. Many state of the art techniques were used for this purpose. Clustering is one of them to group similar crime zones. In this work, we proposed the clustering approach based on PCA and K-mode clustering. Also, a new simple prediction algorithm based on crime rate was introduced. The proposed techniques were tested using the bench marked datasets. Despite their simplicity, both the clustering and prediction techniques were found to perform better in comparison with the two popular existing algorithms. A further improvements in this direction also is possible. The techniques may also be effectively utilized for other types of crimes which are not used in this work.One such work is that developing some technique for identifying the optimal number of clusters to be used in K-Mode clustering. This optimal number of clusters may increase the accuracy more. Despite, the number of ’k’ in this work was determined by projecting the data into a graph. The techniques may also be effectively utilized for other types of crimes which are not used in this work. Also, forecasting crime rate may help in formulating strategies to tackle it in advance.
In this study we found why we implement participative decision making in all the organizations through various research papers.If we implement employees participation in decision making in compulsory manner, The employees loyalty ,trust, ownership will be increased The employees will feel that is his/her own company. Transparency will be maintained automatically and it
[image:5.595.55.246.199.301.2] [image:5.595.52.214.366.479.2]relationship. Employees will start to behave like their own family members .Through PDM, employers and employees will get good knowledge from different kind of experienced people. We suggest, Indian govt should make ordinance for all the organizations should follow PDM in compulsory and genuine manner. This will maintain the workplace equality and increase Organizational productivity.
References
1) McClendon, L. and Meghanathan, N. “Using machine learning algorithms to analyze crime data.” Machine Learning and Applications: An International Journal (MLAIJ), 2015.
2) TahaniAlmanie, R. M. and Lor, E. “Crime prediction based on crime types and using spatial and temporal criminal hotspots.” International Journal of Data Mining Knowledge Management Process (IJDKP), 2015.
3) Malathi. A, D. S. S. B. “An enhanced algorithm to predict a future crime using data mining.” International Journal of Computer Applications, 2011.
4) ShijuSathyadevan, D. M. and S, S. G. “Crime analysis and prediction using data mining.” First International Conference on Networks Soft Computing, 2014.
5) Yufei Zhang, H. J. (2010). “Using gis to analyze and forecast the chinese crime rate.” IEEE.
6) S.Sivaranjani, Dr.S.Sivakumari, A. “Crime prediction and forecasting in tamilnadu using clustering approaches.” International Conference on Emerging Technological Trends [ICETT], 2016.
7) Malarvizhi S, S. I. (2017). “An efficient clustering for crime analysis.” International Journal of Innovative Research in Computer and Communication Engineering.
8) JyotiAgarwal, RenukaNagpal, R. S. “Crime analysis using k-means clustering.” International Journal of Computer Applications, 2013. 9) Aaron Christian P. Uy, RhenAnjeromeBedruz, A. R. Q. A. B. E. P. D.
“Machine vision for traffic violation detection system through genetic algorithm.”International Conference Humanoid, Nanotechnology, Information Technology Communication and Control, Environment and Management, 2015.
10) Anshu Sharma, S. S. “An intelligent analysis of web crime data using data mining.” International Journal of Engineering And Innovative Technology (Ijeit), 2012.
11) Luis Perez and Alex Wang”,“Gaussian Processes for Crime Prediction”, vixra.org/pdf/1712.0467v1.pdf.