DISSERTATION ON
A STUDY OF HEAART RATE VARIAB ILITY AND LIVER
FUNCTION TEST IN ALCOHOL DEPENDENCE SUBJECTS
SUBMITTED TO
THE TAMILNADU DR MGR MEDICAL UNIVERSITY
In partial fulfillment of the requirements
For the award of degree of
MD PHYSIOLOGY (BRANCH V)
DEPARTMENT OF PHYSIOLOGY
GOVERNMENT STANLEY MEDICAL COLLEGE
CHENNAI – 600 001
CERTIFICATE
This is to certify that this dissertation entitled “A STUDY OF
HEART RATE VARIABILITY AND LIVER FUNCTION TEST IN
ALCOHOL DEPENDENCE SUBJECTS” by the Post Graduate Dr.
M.INDUMATHI for M.D. (PHYSIOLOGY), BRANCH – V is a bonafide
record of the research done by her in the Department of Physiology, Government Stanley Medical College hospital, Chennai in partial fulfilment of regulations of the Tamilnadu Dr MGR Medical University for the award of
degree of MD (Physiology) Branch –V during the academic period 2015 – 2018.
Prof. Dr. S.Ponnambala Namasivayam, Dr. Viji Devanand M.D.,
M.D., D.A., D.N.B., Professor and Head of the Department
The Dean Department of Physiology
Stanley Medical College Stanley Medical College,
Chennai-1 Chennai-1.
DECLARATION
I, Dr. M.INDUMATHI, solemnly declare that this dissertation entitled,
“A STUDY OF HEART RATE VARIABILITY AND LIVER FUNCTION
TEST IN ALCOHOL DEPENDENCE SUBJECTS” is a bonafide and
genuine research work done by me in the Department of Physiology, Govt. Stanley Medical College and Hospital during 2015–2018 under the guidance and supervision of Dr. VIJI DEVANAND, M.D., Professor and Head, Department of Physiology, Stanley Medical College, Chennai – 600 001.
The dissertation is submitted to the The Tamilnadu Dr. M.G.R. Medical University, towards partial fulfilment of the University regulations for the degree of M.D. (Physiology), Branch V, examination to be held in April 2018.
Place : Chennai – 600 001
ACKNOWLEDGEMENT
I express my profound gratitude to Prof. Dr. S. Ponnambala
Namasivayam, M.D., D.A., D.N.B., Dean, Stanley Medical College and
Hospital, Chennai -600 001 for permitting me to use all the needed resources for this dissertation work.
A work of this nature would not have been possible without the prime guidance of Prof. Dr. Viji Devanand M.D., Professor and Head of the Department of Physiology, Govt. Stanley Medical College, Chennai. I thank her for being a constant source of encouragement, inspiration not only in this study but in all my professional endeavours.
I am thankful to Prof. Dr. W. J. Alexander Gnanadurai M.D., Psychiatry, Professor and Head of the Department of Psychiatry, Govt. Stanley Medical College Hospital, Chennai, for granting me permission to select the study subjects from the Psychiatry OPD.
I sincerely thank Prof. Dr. R. Mahalakshmi M.D.,Biochemistry, Professor of Biochemistry for guiding and permitting me to carry out the Liver function tests in the central lab, Govt.Stanley Medical College and Hospital.
I am extremely indebted to Dr. D.Celine, M.D. DCH, and
Chennai whose enthusiastic supervision provided the necessary guidance to bring this work to fruition.
I extend my thanks to Dr S.Subathra, M.D, Senior Assistant Professor who guided me from the beginning. I thank all our Assistant Professors, Department of Physiology, Stanley Medical College, Chennai for their valuable suggestions.
I extend my sincere thanks to my Post Graduate Colleagues for their help during the study. I express my sincere thanks to the teaching staff and technical staff of Physiology Department for their cooperation and kind help.
Finally, I acknowledge the immense faith of the volunteers and patients who have participated in this study and express my gratitude for their cooperation.
CERTIFICATE-II
This is to certify that this dissertation work titled “A STUDY
OF HEART RATE VARIABILITY AND LIVER FUNCTION TEST
IN ALCOHOL DEPENDENCE SUBJECTS” of the candidate
Dr. M.INDUMATHI with registration number 201515051 for the award of
M.D. PHYSIOLOGY in the branch of V. I personally verified the urkund.com website for the purpose of plagiarism check. I found that the uploaded thesis file contains from introduction to conclusion pages and result shows 1% percentage of plagiarism in the dissertation.
CONTENTS
Chapter No.
Title Page No.
1. INTRODUCTION 1
2. REVIEW OF LITERATURE 7
3. AIM AND OBJECTIVES 42
4. MATERIALS AND METHODS 43
5. RESULTS 52
6. DISCUSSION 68
7. CONCLUSION 78
8. SUMMARY 80
9. BIBLIOGRAPHY
(i) (ii) (iii)
LIST OF TABLES
S.NO TITLE
PAGE NO 1. Comparison of demographic parameters (mean SD)
between alcohol dependent subjects and non-alcoholic individuals.
53
2. Comparison of mean values of resting heart rate between
alcoholic and Non – alcoholic individuals. 54
3. Comparison of mean values of time domain indices between
alcohol dependent subjects and non-alcoholic individuals. 57 4. Comparison of mean values of frequency domain measures
between alcohol dependent subjects and non-alcoholic individuals
59
5. Comparison of mean values of the liver function enzymes between alcohol dependent subjects and non-alcoholic individuals.
63
6. Comparison of mean values of the liver function parameters – total proteins, albumin & globulin between alcohol dependent subjects and non-alcoholic individuals.
65
7. Comparison of mean values of the liver function parameters –total, direct & indirect bilirubin between alcohol dependent
LIST OF GRAPHS
S.NO TITLE PAGE
NO
1. Comparison of mean values of resting heart rate between
alcohol dependent individuals and non-alcoholic subjects. 55 2. Comparison of time domain indices between alcohol
dependent subjects and non-alcoholic individuals.
58
3. Comparison of low frequency and high frequency domain measures between alcohol dependent subjects and non-alcoholic individuals.
60
4. Comparison of mean values of LF/HF ratio between alcohol
dependent subjects and non-alcoholic individuals. 61 5. Comparison of mean values of the liver function enzymes
between the alcohol dependent individuals and non-alcoholic subjects.
64
6. Comparison of mean values of the liver function parameters between alcoholic dependent subjects and non-alcoholics individuals.
LIST OF ABBREVIATIONS
AD : Alcohol Dependence
ANS : Autonomic Nervous System
HRV : Heart Rate Variability
SBP : Systolic Blood Pressure
DBP : Diastolic Blood Pressure
BMI : Body Mass Index
HR : Heart Rate
LF : Low Frequency
HF : High Frequency
VLF : Very Low Frequency
TP : Total Power
n.u : Normalized units
SDNN : Standard Deviation of average N-N interval
RMSSD : Root Mean of the Sum of Squares of difference between adjacent
NN intervals.
NN50 : N-N intervals differing by more than 50 milliseconds.
dL : deciliter
LFT : Liver Function Test
GGT : Gamma GlutamylTransferase
ALT : Alanine Amino transaminase
AST : Aspartate Amino Transferase
ALP : Alkaline Phosphatase
1. INTRODUCTION
Alcohol a psychoactive substance with dependence properties, causes a large number of diseases, social and economic burden in societies1. 16.0% of people above 15 years engage in heavy episodic drinking. 139 million DALYs (disability adjusted life years) were attributed to alcohol consumption in 2012. 3.3 million deaths in 2012 were reported to be due to alcoholism.2
A recent global study done by“ The Paris-based Organization for Economic Cooperation and Development” (OECD) published a report stating that “Alcohol consumption in India is up by 55% between 1992 and 2012 and it is third in terms of increase in intake only to Russian Federation and Estonia. More worrying is the young are getting initiated into alcoholism earlier and are also indulging in binge and hazardous drinking.”
Alcohol dependence subjects, classified based on International Classification of Diseases rev 10 (ICD-10): (World Health Organization’s classification 1990) have behavioural and mental disorders, an increased prevalence of cardiovascular disease, attenuated bone health, cancer, physical problems.
Alcohol has a deleterious effect on a multitude of systems within the body, adversely influencing neural function, cardiovascular physiology, metabolism, thermoregulation and skeletal muscle myopathy.4 The highest number of deaths are due to cardiovascular disease followed by injuries, liver disease/cirrhosis and cancers.5
Studies have shown a great significance between Autonomic Nervous System and Cardiovascular morbidity including sudden death and malignant arrhythmias. Heart rate variability (HRV) represents the hallmark of such markers.
Previous studies showed significant decrease in Heart Rate Variability in Alcohol Dependent Subjects compared to non-alcoholic subjects. This is due to cardiac autonomic neuropathy that decreases the cardio vascular performance leading to sudden death due to arrhythmias. Thus HRV can be used as a non invasive test for assessing the cardiac autonomic dysfunction”.
The sympathetic activity which is responsible for “the fight or flight response” increases heart rate and blood pressure. Parasympathetic activity which is conveyed through the vagus nerve, is responsible for relaxation and restoration of heart rate, in which heart rate and blood pressure decreases.8 The body works most effectively when there is high parasympathetic activity.
“ Heart rate variability refers to the complex beat-to-beat variation in heart rate produced by the interplay of sympathetic and parasympathetic (vagal) neural activity at the sinus node of the heart. Importantly, heart rate (HR) is under tonic inhibitory control via the vagus nerve.”12 Heart rate variability has been shown to increase spontaneously with intervention and treatment.13
Alcohol is metabolized in the liver. It initiates a variety of metabolic responses that affects the final hepatotoxic response. High alcohol consumption for many years is likely to present with liver disease. Alcohol effects on the liver may range from reversible fatty change of the liver and hepatitis to irreversible cirrhosis. Alcoholic hepatitis may be acutely fatal in about 50% of the patients. It is also a precursor of alcoholic cirrhosis where the mortality rate increases to 70%.14
A number of laboratory tests are available to assist in the diagnosis of alcohol consumption and its related disorders. Several biochemical and haematological tests, such as GGT, AST, ALT are established markers of alcohol intake. Early assessment of their liver function using liver function tests will help in preventing hazardous alcohol induced liver complications.
GGT is one of the established tests for excessive alcohol consumption.16 About 5% - 20% of dependent drinkers with normal liver histology showed elevated GGT.17,18GGT levels are predictive of future morbidity and mortality.19,20,21,22 GGT was used as a successful screening and interventional tool in the Malmo study and the Tromso study in Norway.23,24
Amino transferases similar to GGT, act as markers of alcohol consumption, and also as indicators of hepatic damage due to alcohol.25 In otherwise healthy person, the most common cause of elevated ALT is Alcohol.26
Significant increase in both conjugated and unconjugated serum bilirubin levels was observed in alcoholic patients.27 Albumin is a potential subject of formation of adduct by acetaldehyde, an alcohol metabolite. This can stimulate immunoglobulin formation, thus causing a rise in globulins.28 And, also such changes may be related to ethanol induced oxidative stress which slows down the hepatic protein catabolism rate.29
1. To assess the autonomic function in Alcohol dependent subjects and Non-alcoholic individuals.
REVIEW OF LITERATURE
HISTORY :
The history of alcohol consumption traces from ancient times to the present. For thousands of years alcoholic drinks have been produced and consumed by Humans. They have played an important ro le in facilitating relaxation; promoting conviviality and social cohesion; religion; providing medicinal, antiseptic, and analgesic benefits; quenching thirst; increasing the pleasure of eating; also providing pharmacological pleasure; supplying nutrition and energy and enhancing the quality and pleasures of life.
In Europe, at first alcohol use was primarily medicinal, but it spread rapidly as a popular social beverage in the 1600s. The functions of alcohol drinks in our society has been controversial and debated . Still today, a conflict of views exists as to whether alcohol is an attractive elixir or a dangerous poison.(30)
withdrawal symptoms; repeated relief/avoidance of the withdrawal symptoms by further drinking; subjective awareness of a compulsion to drink; reinstatement of the syndrome after abstinence”. Physical, mental and social disabilities accumulate in the alcohol dependent subjects.31
Alcohol, its types & topographical distribution :
Beverages containing ethanol (C2H5OH) are fermented from a number of
organic materials comprising carbohydrates, but in some parts of the world, these products are prepared from plants, fruits, berries, various grains, honey or milk. Such fermented beverages may contain up to 14% ethanol.
Alcohol – public health perspective :
Alcohol affects at the population level, rather than the individual level, which is the main concern. Drinking behavior of a person is likely to influence and be influenced by those around the person.32
Etiology :
The initiation of alcohol consumption largely depends on religious, social, cultural and personality characteristics, though genetic
characteristics are also related to impulsitivity and risk taking behavior.
Blood levels of ethanol are expressed as milligrams or grams per deciliter, with ingestion of one typical drink 0.02 g/dL.
A standard drink is10-12g as seen in 340 mL of beer,
115 mL of nonfortified wine, 43 mL of whisky,
Additional components called Congeners are present in these beverages that affect the taste and contribute to adverse effects on the body. The congeners are methanol, butanol, acetaldehyde, histamine, tannins, iron, and lead.
Beer (3 - 7% ethanol) is the most widely commercialized fermented beverage, prepared from barley or other grains, also apple and other fruit ciders. Other fermented beverages common in particular cultures are Sorghum and Millet beers in Eastern and Southern Africa, palm wine toddy in western Africa and the Indian subcontinent. In Mexico pulque which is prepared from the maguey cactus, and rice wine in East Asia.33
PHYSIOLOGY/ ABSORPTION OF ALCOHOL
intestine. 2-10% of ethanol is excreted directly through the lungs, urine, or sweat, but the majority is metabolized to acetaldehyde, primarily in the liver.
Alcohol is devoid of nutrients and it can interfere with absorption of vitamins in the small intestine and it decreases their storage in the liver with effects onfolate, thiamine, pyridoxine and vitamin A. Knowledge about the deleterious effects of alcohol helps the clinicians to identify alcoholic subjects and provides
Alcohol Metabolism :
Liver is the site of alcohol metabolism. The metabolism of alcohol in the hepatocyte initiates a pathogenic process, which involves the production of protein – aldehyde adducts, immunologic activity, lipid peroxidation and cytokine release.
Cytokine production is believed to be responsible for the systemic manifestations of alcoholic hepatitis.
reason for induction of fatty liver by alcohol, although acetaldehyde is the prime toxin.
Acetaldehyde causes most of the injury to liver cells, and also induces collagen synthesis leading to fibrosis and ultimately cirrhosis. Alcohol causes damage to intestinal epithelial cells, leading to lipopolysaccharide release, which can also damage liver cells. Other metabolic changes observed in alcoholic liver disease includes changes in methionine metabolism and oxidative stress. Genetic factors also play a role in alcoholic liver disease, and they are also important in determining persons with risk of developing liver disease in alcoholics.
Beneficial effects of alcohol
Adverse effects of alcohol
Acute :
Acute effects of alcohol are associated with the particular drinking event. Physical coordination, cognition, and attention are progressively impaired, resulting in an increased risk of accidents and injury. Graham et al.1998 has described that drinking above a threshold level can affect intention, judgment, and intoxication plays a causal role in violent behaviours and crime. Potentially fatal overdose of alcohol interrupts various autonomic bodily functions. It also acutely decreases neuronal activity. “Legal intoxication” requires a blood alcohol concentration of 80 – 100mg/dL, and death can occur between 300 – 400mg/dL.32
Chronic :
Alcohol dependence / Alcoholism contributes to damage of tissues which include liver, central nervous system, peripheral nervous system, skeletal and cardiac muscle. Ethyl alcohol damages the vasomotor and cardiac autonomic nerve fibers leading to autonomic imbalance, with neurovascular and cardiac dysfunction. The cardiac dysfunction results in reduced heart rate variability.32
Effect of alcohol on Cardiovascular system:
raised cardiac output. Alcohol is a striated muscle toxin , with a resultant deterioration in the heart muscle which manifests as beating irregularities and signs of heart failure – alcoholic cardiomyopathy. Thus , the leading cause for early deaths in alcoholics is cardiovascular disease.33
Chronic heavy drinking may cause cardiomyopathy, their symptoms range from unexplained arrhythmias to heart failure and hypocontractility of heart muscle. One third cases of cardiomyopathy are alcohol induced. Heart rate variability constitutes a composite measure of balance between the sympathetic and the parasympathetic tones. In alcoholic neuropathy, there is functional and structural damage to both sympathetic and parasympathetic nerve fibers. They both individually contribute to impaired cardiac function.33
In other autonomic dysfunction related psychiatric diseases like depression and anxiety, biofeedback targeting heart rate variability by visualizing heart rate deviations on a computer screen demonstrated improved cardiac function by increasing heart rate variability.34 A recent study has demonstrated HRV biofeedback in a short term setting to be feasible to treat substance abuse patients.35
Effect of alcohol on the Liver
of glucose production; lactate production increases; and decreased oxidation of fatty acids, with an increased fat accumulation in liver cells. On repeated alcohol exposure, the changes that occur in the liver include fatty accumulation, alcohol induced hepatitis, perivenular sclerosis and cirrhosis.31
Pathology of Alcoholic Liver Disease:
Alcohol is a direct hepatotoxin. The duration and quantity of alcohol intake is the pathogenesis behind chronic alcoholism. It comprises of 3 major lesions which are
1. Fatty liver – 90% binge and chronic drinkers are vulnerable, 2. Alcoholic hepatitis
3. Cirrhosis.
In alcohol dependence there is increased alcohol intake resulting in the accumulation of proteins and fats in the hepatic cells, producing a reversible swelling described as fatty liver. If not abstained at this stage , it leads to a stage of hepatitis, in which there is inflammation of the liver cells along with a subsequent increase in some liver function tests.
flow through the liver becomes impaired, leading to dilated veins or varices causing ascites.33
The fat accumulation within the perivenular hepatocytes corresponds with the location of alcohol dehydrogenase, which is the major enzyme involved in the alcohol metabolism. Continuing alcohol intake contributes to fat accumulation in the entire hepatic lobule and distortion of the hepatocytes.
But studies have revealed normalization of fat content and hepatic architecture in the liver on cessation of drinking. Fatty liver and alcoholic hepatitis are potentially reversible on abstention, whereas cirrhosis is irreversible.33
MANAGEMENT
1. Alcohol abstinence. 2. Nutritional support
3. Pharmacological treatment
(i) Disulfiram – most commonly used alcohol sensitizing drug, and the only one approved by the US Food and Drug Administration. It acts by inhibiting alcohol dehydrogenase enzyme, which converts acetaldehyde to acetate in the liver. (ii) Naltrexone – pure opioid antagonist which reduces craving and
relapse rate.
(iv) Selective Serotonin Reuptake Inhibitors. (v) Topiramate – reduces craving.31
(vi) Ondansetron – a selective 5-HT3 receptor antagonist produces better results in early onset alcohol dependence.36
(vii) Prednisolone 32mg per oral daily for 4 weeks
(viii) Glucocorticoids – as it involves cytokine release and perpetuation of injury by immunologic process, glucocorticoids are used in alcoholic hepatitis.
(ix) Pentoxifylline – 400mg per oral tid for 4 weeks. Used as an alternative to glucocorticoids. Acts by inhibiting TNF (tumour necrosis factor).
4. Brief Interventions and Motivational Interviewing:
The brief intervention is effective in decreasing the alcohol use and its problems. It is instituted as two 15 minute sessions 1 month apart, along with a telephone follow – up reminder. Motivational interviewing uses the clinician’s level of concern.
The families of alcoholics can be referred for counseling to self help groups like Al-Anon ( the Alcoholic Anonymous) group for family members) and Alateen (for teenage children of alcoholics).32
ALCOHOL DEPENDENCE
Definition of Alcohol dependence :
“ Alcohol dependence is defined as alcohol-seeking behavior, despite its adverse effects; AD is considered more serious and advanced form of alcoholism.”
“ Alcohol dependence is defined in the Fourth Diagnostic and Statistical Manual (DSM-IV) of the American Psychiatric Association as repeated alcohol-related difficulties in three of seven areas of functioning that cluster together over any 12 month period” that includes the following criteria:
(i) tolerance (ii) withdrawal
(iii) alcohol used in larger amounts/ longer period (iv) presence of a persistent desire to take alcohol
(v) Too much time spent in activities necessary to obtain alcohol, use alcohol, or recover from its effects
The clinical diagnosis of alcohol dependence ultimately depends on the documentation of a pattern of difficulties associated with the use of alcohol; and not on the quantity and frequency of alcohol consumption. Alcohol ingested, distributes throughout the body tissues rapidly and its abuse contributes to the damage of variety of tissues, which includes liver, the central and peripheral nervous systems, and cardiac and skeletal muscle.
The risk factors for alcohol related neuropathy are thiamine deficiency, malnutrition37, direct toxicity of alcohol38 and also a family history of alcoholism, but there is no clear evidence which plays a primary role in causing neuropathy. Chronic Ethanol ingestion reduces thiamine absorption in the intestine, thereby reducing the hepatic stores of thiamine. It also affects the phosphorylation of thiamine, which helps converting to its active form.
AUTONOMIC NERVOUS SYSTEM
1. The Sympathetic nervous system – thoracolumbar division 2. The Parasympathetic nervous system – craniosacral division
The sympathetic effect is long lasting, whereas the parasympathetic stimulation is short lived. The sympathetic nervous division prepares one for emergency situations (fight or flight response), causing loss of energy. Whereas the parasympathetic nervous division regulates the activities that conserve and restore the body energy (rest and digest). The autonomic reflexes regulate the activities of cardiac muscles, smooth muscles and glands. The final common pathway from the central nervous system to the visceral targets are through the sympathetic and the parasympathetic neurons.39
AUTONOMIC CONTROL OF THE CARDIOVASCULAR SYSTEM
The autonomic nervous system plays an important role in overall cardiovascular homeostasis. The heart is an effector organ which receives opposing influences from the parasympathetic and sympathetic divisions of the ANS. Nor-epinephrine is released from the postganglionic sympathetic nerves. This activates the β1 – adrenoreceptors present in the Sino-atrial node,
Atrio-ventricular node, His –Purkinje conductive tissue, and also the atrial and ventricular contractile tissue.
increased rate of conduction (dromotropy). Acetylcholine is the neurotransmitter released from the postganglionic parasympathetic (vagus) nerves that activates the Nicotinic receptors present in the sino-atrial node, atrio-ventricular node and the atrial muscles of the heart. Thus the stimulation of the vagus nerve causes reduction in the heart rate, atrial contractility and rate of transmission through the AV node.
The neural influences to the heart comes from several parts of the forebrain, brain stem, and insular cortex. A group of neurons located adjacent to the pia surface of the medulla called the rostral ventrolateral medulla (RVLM) or Vasomotor area is one of the major sources of excitatory input to the sympathetic nerves. The medulla is also a major site for origin of excitatory input to the cardiac vagal motor neurons in nucleus ambiguous that reduces the heart rate.
The intrinsic heart rate is about 100 -120 beats per minute. But in a healthy individual, the heart rate ranges between 60 and 90 per minute. This is due to the balance between the sympathetic nerves, which accelerate the heart rate and the parasympathetic nerves (vagus), which slow the heart rate.39
of the site of lesion. The noninvasive tests can be performed readily and are used to confirm the diagnosis of autonomic neuropathy.
There are a list of non-invasive autonomic function tests for the assessment of Cardiovascular function. They include heart rate response to tilting, heart rate variation with respiration, heart rate and blood pressure response to standing, valsalva ratio, isometric exercise and cold pressor test.40
HEART RATE VARIABILITY
Definition :
“HRV , heart rate variability is the degree of fluctuation in the length of the intervals between heart beats.”(Malik & Camm,1995)
“Heart rate variability refers to beat to beat variation in heart rate between two consecutive beats as oscillation between consecutive instantaneous heart rate. HRV is mirroring the regularity of heart beats: bigger regularity – lowers HRV (and vice versa). Regularity of heartbeats is derived from a quantity of numbers; equal to the time elapsed between successive heartbeats. They are named R – R intervals / N-N intervals and are measured in millisecond (ms).41
respiration; and circadian biorhythm influence the length of beat-to-beat intervals, namely R-R intervals / N-N intervals. Depressed / Reduced HRV means the heart rate is monotonously regular. It denotes lowered ability of the autonomic nervous system’s regulatory function, and a lowered ability to maintain the homeostasis, deficiency in coping up with the external and internal stressors and in resisting disease or recovery in appropriate time.41
The variation of heart rate was analyzed using time domain and frequency domain methods for a short term period of 5 minutes to provide the degree of balance and activity of autonomic nervous system”. HRV can be assessed in two ways
1. Time domain analysis and 2. Frequency domain analysis41
TIME DOMAIN ANALYSIS (5 MINUTES)
Mean Heart Rate (beats per minute) – it is the average heart rate during a period of 5 minutes.
“SDNN (ms) - it is the most representive parameter of HRV. Standard deviation of all the N-N intervals. It represents the parasympathetic activity.
SDANN (ms) – Standard deviation of the averages of N-N intervals in all 5-minute segments of the entire recording.
RMSSD (ms) – the square root of the mean of the sum of the squares of the differences between adjacent N-N intervals.
NN50 count – Number of pairs of adjacent N-N intervals differing by more than 50 ms in the entire recording.
pNN50 (%) – NN50 count divided by the total number of all N-N intervals.”41
FREQUENCY DOMAIN PARAMETERS
Very Low Frequency (VLF in ms2) – it is a band of power spectrum ranging between 0.0033 and 0.04 Hz. VLF parameter indicates the overall activity of sympathetic function.
Low Frequency (LF in ms2) – this power spectrum ranges between 0.04 and 0.15 Hz. This band reflects both the sympathetic and parasympathetic activity with sympathetic dominance.
High Frequency (HF in ms2) – this band of power spectrum range between 015 and 0.4 Hz. It reflects parasympathetic (vagal) activity. LF/HF Ratio - The LF/HF ratio parameter is the ratio between the power
of Low frequency bands and High frequency bands. This ratio shows the overall balance between the sympathetic and the parasympathetic systems. Higher LF/HF ratio reflects the domination of the Sympathetic nervous system, whereas lower LF/HF ratio indicates the domination of the Parasympathetic nervous system.
Normalized Low Frequency (LF nu) – it represents “the ratio between the absolute value of Low Frequency and the difference between Total power and Very Low Frequency.” This measure emphasizes the changes in the sympathetic regulation. It is calculated in percentile units.
Very Low Frequency.” This measure emphasizes the changes in the parasympathetic regulation. It is calculated in percentile units.41
Uses of HRV
1. It is a non- invasive method which measures both the cardiovascular and non cardiovascular autonomic functions.
2. Assesses the effectiveness of treatment and its prognosis.
3. Effectiveness of stress relaxation program like meditation ,yoga etc.
4. In sports physiology in training of athletes.
5. Morbidity predictor in post myocardial infarction, arrhythmias, etc. 6. HRV regularity gives an early warning sign in various diseases like
diabetic neuropathy.42
7. Assessing the sympatho-vagal imbalance.
HRV IN ALCOHOLIC DEPENDENCE SUBJECTS
cerebellum and the peripheral nerves including Autonomic nerves.37 The damage to nerves results from long term excessive drinking.
Alcoholic neuropathy is caused by activation of microglia of the spinal cord, oxidative stress induced free radical damage, release of pro-inflammatory cytokines coupled with protein kinase activation, involvement of classical MAP kinases, involvement of the extracellular signal-regulated kinases (ERKs)43,44, involvement of the opioidergic and hypothalamo-pituitary-adrenal system. Also Cytokines are released by alcohol metabolism in the liver. It causes autonomic dysfunction and blunting of β-adrenergic signalling contributing to reduced HRV.45
CHRONIC ALCOHOL INTAKE
ACETALDEHYDE
Decreased Endogenous antioxidants Increased Mitochondrial ROS
Nutritional deficiency (vit.B)
INCREASED OXIDATIVE-NITRODATIVE STRESS
INCREASED CYTOKINES (TNF-Α, IL-1Β,IL-6, TGF-Β1)
Increased NFκβ, Caspase3 Increased PKC, MEK/ERK
NEURONAL DAMAGE
Heart rate variability analysis is used to evaluate autonomic functions in many disorders. A recent study conducted by Thirumaran et al on alcohol dependent individuals showed thiamine deficiency to contribute to the vagal neuropathy and also the same individuals showed improvement of vagal function tests following continued abstinence.37
JM Ryan et al in their study reported lower indices of cardiac vagal nerve activity in Alcohol dependence subjects compared to normal volunteers in his study. He also described a positive association between chronic alcohol intake and heart rate.48 K Murata et al in their study showed alcohol affects cardiac autonomic functions including both the sympathetic and parasympathetic activities with a predominance of reduced parasympathetic activity.49
Robert D. NEGRU et al in their study found SDNN, LF was decreased suggesting a marked decreased sympathetic activity in alcoholics.51JolantaBialkowska et al in their pilot study in alcoholics showed a marked decrease in SDNN, RMSSD, pNN50 remarking reduced vagal activity.52 Duncan et al in his study suggested chronic vagal damage as a feature of alcoholic polyneuropathy.53
Lambie et al described in their study that alcoholics suffer central damage to autonomic pathways resulting in disorder of parasympathetic control of heart. They explained nutritional factors to be the causative agent rather than alcohols direct toxic effect and a good nutritional supplementation to protect against the development of vagal neuropathy.54Behse F et al in their study proved axonal degeneration of the vagus nerve in necropsy of alcoholic neuropathy.55RoserMonforte et al in their study stated alcoholics exhibited reduced heart rate variability, when compared with the controls.56
LIVER FUNCTION TESTS
Liver function tests are the most widely performed biochemical tests in the laboratory, which help in the diagnosis and in monitoring liver diseases. The liver function tests are broadly classified as follows:
1. “ Tests to detect hepatic injury:
a. To detect the disease, whether mild or severe; whether acute or chronic.
b. To assess the nature of liver injury; hepatocellular or cholestasis. 2. To assess hepatic function.”
Functions of the liver
Synthetic function : the liver synthesizes the major biomolecules like plasma proteins albumin, globulins, hormonal factor, clotting factors, growth factors, bile acids, cholesterol, and phospholipids . Carbohydrate, lipid and amino acid metabolism.
Bilirubin metabolism
Detoxification functions : toxic substances entering via gut and the parenteral route are detoxified in the liver by various reactions like reduction, hydrolysis, oxidation, hydroxylation, carboxylation and demethylation and excreted.
1. Jaundice
2. Alcoholic liver disease 3. Suspected liver metastasis 4. Coagulation disorders
5. Therapy with statins to check hepatotoxicity 6. Any undiagnosed chronic illness
7. Master health check up Classification of liver function tests : “ Group I – hepatic excretory function
i. Serum – bilirubin; total, conjugated, and unconjugated. ii. Urine – bile pigments, bile salts and urobilinogen Group II – Liver enzyme panel
i. Alanine amino transferase (ALT) ii. Aspartate amino transferase (AST) iii. Alkaline phosphatase (ALP)
iv. Gamma glutamyltransferase (GGT) Group III – Synthetic function of liver
i. Total proteins
Classification based on clinical aspects Group I : Markers of Liver dysfunction :
i. Serum bilirubin, total, conjugated
ii. Total protein, serum albumin and A/G ratio Group II : Markers of hepatocellular injury
i. Alanine amino transferase (ALT) ii. Aspartate amino transferase (AST) Group III : Markers of cholestasis
i. Alkaline phosphatase (ALP)
ii. Gamma glutamyltransferase (GGT).”59
LIVER FUNCTION TESTS IN ALCOHOL DEPENDENCE SUBJECTS :
Alcohol or ethanol is metabolized primarily in the liver, and therefore the liver is the major site of ethanol toxicity. Alcohol is a direct hepatotoxin. The metabolism of alcohol by the liver cells or hepatocytes initiates pathogenic processes leading to production of protein-aldehyde adducts, immunologic activity, lipid peroxidation, and cytokine release.
resultant fibrosis will determine the extent of architectural derangement in the liver following chronic alcohol consumption. Also the cytokine produced is responsible for the systemic manifestations of alcoholic hepatitis.32
Chronic ethanol ingestion Liver
Acetaldehyde Intestine + Endotoxin
Stellate cell activation Kupffer cell
Collagen production TNF-α, IL-1&6,TGF-β
Fibrotic response alcoholic hepatitis Risk factors for alcoholic liver disease:
1. Period and magnitude of alcohol ingestion: threshold intake of 40 g/d in men and 10 g/d in women.
3. Genetic factors : HFE gene mutations are more common
4. Nutritional status : poor nutrition may contribute to the development of alcoholic liver disease.60
There are a large number of biochemical markers for the detection of excessive alcohol consumption. Typical laboratory abnormalities in alcohol dependence include modest increase in GGT, AST and ALT,also accompanied by hypercholesterolemia, hypertriglyceridemia, and hyperbilirubinemia. These serologic markers can be used in monitoring abstinence because these markers would return to normal within several weeks of cessation of drinking. An increase in values of as little as 10% indicates a resumption of heavy alcohol intake.32
GAMMA GLUTAMYL TRANSFERASE : Normal value :10-51 IU/L
The most widely used is Gamma-glutamyltransferase (GGT). It is a membrane bound glycoprotein enzyme, for long has been used as a sensitive marker of alcohol dependence. It roughly parallels the alcohol intake. GGT is an inducible enzyme and its threshold for positivity is 2 drinks/day. It normalizes in 2 -3 weeks of abstention.
TRANSAMINASE ENZYMES :
Serum ALT and AST are used for screening liver dysfunction in alcohol users. An increased liver transaminase (AST &ALT) is considered as an early warning sign of developing alcoholic liver disease.
ALKALINE PHOSPHATASE: Normal value : 44 – 147 IU/L
Increase in ALP enzyme activity to greater than three times the upper reference limit, is associated with higher mortality in alcoholics.
SERUM BILIRUBIN (total ,direct&indirect) Normal values
Total bilirubin : 0.2 – 0.9 mg/dL Direct bilirubin : 0 - 0.3 mg/dL
Hyperbilirubinemia is common is common in alcohol dependence indicating toxic damage of alcohol on liver.
TOTAL PROTEIN, ALBUMIN & GLOBULIN
Normal values
Reduction of liver synthesized protein concentrations are commonly present in alcoholics.Albumin is the most important protein synthesized by the liver, and it reflects the extent of functioning liver cell mass.In advanced liver injury hypoalbuminemia is common.32
J. B. Gogiet in their study showed increased GGT in chronic alcoholics and stated the increase in GGT was due to microsomal enzyme induction. They stated that determination of serum GGT is a useful diagnostic tool, if used judiciously and correlated correctly. Also other liver enzymes were elevated in conjunction with GGT.61 The same findings was observed by R Teschke et al; Rosalki , S et al Wu , A et al in their study.62,16,17
Eri Hashimoto et al in their study titled “ Consensus paper of the WFSBP task force on biological markers” have stated GGT to be an extremely sensitive and specific marker for chronic alcoholism. Also they stated that when the increase in GGT is two or more fold greater than the rise in ALP, the source of is from the liver.63
Ryback, R.S et al in their study demonstrated increase in the GGT levels in alcoholics and also stated it can be used in distinguishing alcoholic from non-alcoholic liver disease. Gamma glutamyl transferase is a biliary canalicular enzyme, which is induced by alcohol and raises in response to hepatocellular damage.64
Mitsuda Y et al in their study noticed GGT increase in parallel with the progression of alcohol induced liver disease.65Katkov , W.N et al in their study stated alcohol as the most common cause of elevation in Alanine amino transferase in otherwise healthy person.66
Hultcranz , R et al in their study reported like GGT, the amino transferases act as markers of alcohol consumption and as indicators of hepatic damage by alcohol.67 Cohen , J.A et al in their study showed increased levels of AST and ALT.68 Conigrave , K.M et al in their study stated elevated levels of GGT, AST and ALT in chronic alcoholics.69
Bilirubin is metabolized, conjugated and excreted in the liver. Alcohol is metabolized in the liver, and chronic intake causes liver damage and bilirubin elevation.71 Das BKL et al in their study reported elevation of serum bilirubin – total and conjugated fraction is common in chronic alcoholics.70
Kazukirokotohet al in his study showed raised albumin levels because albumin is a potential subject of formation of adduct by alcohol metabolite acetaldehyde.72The same was stated by Subir Kumar et al.26
3. AIM AND OBJECTIVES
AIM :
To assess the Heart rate variability and Liver function tests in Alcohol Dependent subjects.
OBJECTIVES :
The objectives of the study were
1. To assess the Heart rate variability in Alcohol dependent subjects.
4.MATERIALS AND METHODS
The study was conducted in the Department of Physiology, Stanley Medical College, after getting approval from Institutional Ethical Committee, Stanley Medical College, Chennai.
4.1 SELECTION OF SUBJECTS :
4.1.1 SELECTION OF THE ALCOHOL DEPENDENT GROUP
Fifty five alcohol dependent individuals in the age group of 20 to 55 years were selected from the psychiatry OPD, Department of Psychiatry, Stanley Medical College and hospital, Chennai. Alcohol Dependence Subjects were chosen according to (DSM- IV) ICD-10 criteria. A diagnosis of AD is based on the presence of any three of the ICD-10 criteria within a one-year period.” Subjects with a score 3 out of 7 were chosen as alcohol dependent group.
4.1.2 SELECTION OF THE NON-ALCOHOLIC GROUP
INCLUSION CRITERIA
1. Age group 20 – 55 years; both genders.
2. Patients diagnosed to have Alcohol Dependence Syndrome based on ICD-10 criteria.
EXCLUSION CRITERIA
Individuals with history suggestive of the following were excluded from the study.
1. Age <20 and >55 years.
2. H/o Hepatitis or fatty liver disease.
3. History of any other co-morbid medical illness like Diabetes, Hypertension & Cardiovascular disorder.
4. Any long term drug intake. 5. Smokers.
STUDY DESIGN :Cross Sectional – Analytical Study
PLACE OF STUDY :
to 1 pm. The environment of the lab was kept quiet and calm and the temperature maintained between 25 – 28°C with minimum lighting.
4.2 METHODOLOGY
4.2.1 HEART RATE VARIABILITY :
INSTRUMENT
RMS polyrite version 2.2 D hardware, which is a computerized recording system is used to acquire and analyze data. The hardware is connected to a Window based PC. The data obtained is stored in memory for analyzing in the later period. Using 2.5.2 software the RR intervals were continuously plotted. The software contains data base, filter settings and calculation tools. Following flow chart summarizes the steps in recording and processing the ECG signal to obtain HRV data.
METHODOLOGY OF HEART RATE VARIABILITY
HRV was recorded in the supine position. The study was conducted in the neurophysiology research laboratory, between 10 am to 1pm. The following precautions were followed while recording the heart rate variability.
2. The subjects were made to sit comfortably, relaxed to get accustomed to the new environment.
3. The test was recorded 2 hours post breakfast.
4. The subjects were asked to empty their bladder before the hrv recording.
5. Electronic gadgets like mobile phones were switched off while recording.
6. Informed written consent was obtained and a brief examination was done.
ECG Recording
Microcomputer Digitizing
Artifact Identification
RR Data Editing
RR Interval Rejection
NN data Sequence
Interpolation+
Sampling
Time
Domain HRV
Frequency
The position of electrodes for recording are as follows :
ELECTRODE POSITION
Exploring Electrode Left forearm
Exploring Electrode Right forearm
Reference Electrode Right leg
The Task Force European Society of Cardiology guidelines was followed while recording and analyzing HRV data. Using time domain and frequency domain indices, the heart rate variability was analyzed.
To calculate the Time domain indices, each QRS complex is identified and the normal to normal (N – N) intervals (the intervals between the adjacent QRS complex) is determined.
The following indices were measured in Time domain analysis Mean Heart Rate
SDNN – Standard deviation of R – R interval
RMSSD – Root mean square of successive differences
NN50 – Number of R – R intervals which differs by > 50 m sec from the other intervals.
The Fast Fourier Transform method (FFT) was used to obtain the spectral measures.
The following parameters were measured in frequency domain analysis
Low frequency component ( 0.04 – 0.15 Hz ) – marker of sympathetic activity
High frequency component ( 0.16 - 0.4 Hz ) - marker of parasympathetic activity
4.2.2 LIVER FUNCTION TESTS
INSTRUMENT
The liver function tests were carried out in the Central Biochemistry laboratory, Stanley Medical College. All the tests were done in the TRANSASIA BIOSYSTEM AUTOANALYSER – MODEL EM 360. It uses configurable software which allows reagents on sample position, high accuracy dispensing systems, pre-programmed racks at users option, intuitive and easy to follow software and internal quality control management.
PROCEDURE :
Liver function tests to be measured are GGT, ALT, AST, ALP, total protein, albumin, globulin, total bilirubin, direct and indirect bilirubin. They were machine calculated. The subject was made to sit comfortably. A tornique was applied in the arm above the cubitalfossa.Following aseptic precautions 2 ml of blood was withdrawn from the antecubital vein of forearm from the subject. The blood sample was then transferred to EDTA coated vacuutainersand wereappropriately labeled.Theneedles, syringe and cotton swabs were discarded appropriately.
minute. The serum separated at the upper part of the blood column was carefully micropipetted and transferred to correspondingly labeled ependorf containers.
Quality control was checked in the Transasia Biosystem Autoanalyser, and was satisfactory. The labeled ependorf containers with the serum were positioned in racks in the machine and the results were auto calculated and depicted in the monitor. The liver function test value of both the alcohol dependent group and the non-alcoholic healthy group was obtained.
STATISTICAL ANALYSIS
Statistical analysis was done using the ‘ Unpaired t’ test. The results obtained were expressed as Mean and Standard deviation (SD). Comparison of the variables between two groups were performed using student t test and “ p ” value was considered to be statistically significant. The data obtained were analyzed using SPSS software version 21.
5.1 DEMOGRAPHIC CHARACTERISTICS OF ALCOHOLIC AND
NON-ALCOHOLIC POPULATION
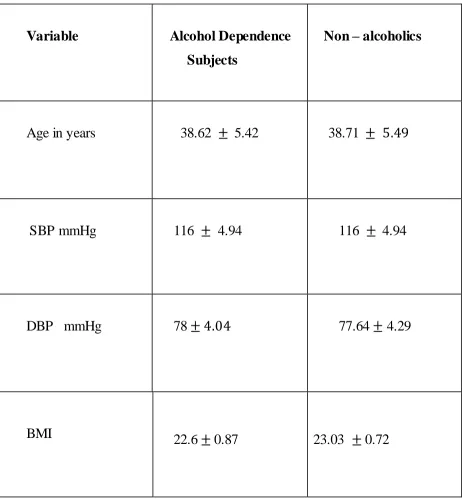
The characteristics of alcoholic and non-alcoholic population are presented in Table 1 . Both the population were chosen in the age group of 20 – 55 years. The mean age of the alcohol dependence group was 37.62 5.42 and non-alcoholic group was 38.04 5.90. With regard to age, the distribution of subjects in the study and control group were nearly uniform.
TABLE 1
Comparison of demographic parameters (mean SD) between Alcoholic
and Non-alcoholic individuals.
Variable Alcohol Dependence
Subjects
Non – alcoholics
Age in years 38.62 5.42 38.71
SBP mmHg 116 4.94 116 4.94
DBP mmHg 78 77.64 4.29
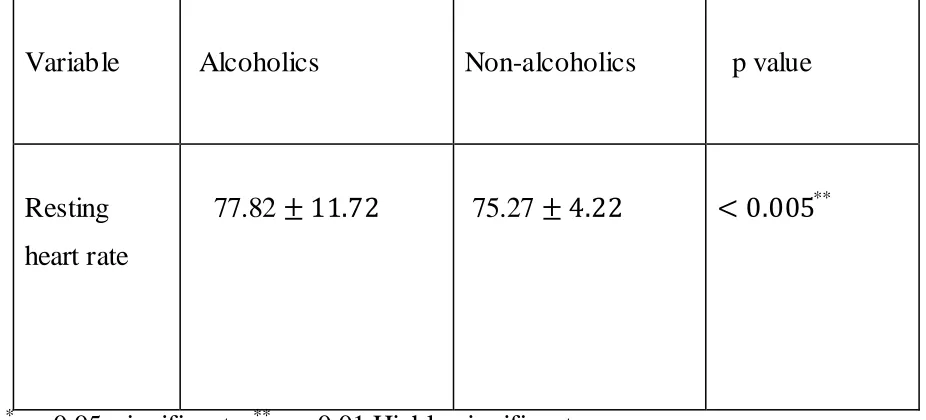
5.2 RESTING HEART RATE
[image:63.596.70.533.383.593.2]The mean heart rate in the alcoholic group was 77.82 and in the non-alcoholic group was 75.27 . The mean heart rate is increased in alcohol dependent subjects when compared to non-alcoholic individuals and is shown in the table 2 and graph 1.
TABLE 2
Comparison of mean values of resting heart rate between alcoholic and
Non – alcoholic individuals
Variable Alcoholics Non-alcoholics p value
Resting heart rate
77.82 75.27 **
*
Graph 1
Comparison of mean values of resting heart rate between alcoholic and
non-alcoholic subjects
The above graph shows the rise in mean heart rate in the alcohol dependent subjects group in comparison to the non – alcoholic healthy group.
77.82
75.27
73.5 74 74.5 75 75.5 76 76.5 77 77.5 78 78.5
Alcoholic Non-alcoholic
Mean HR
Alcoholic
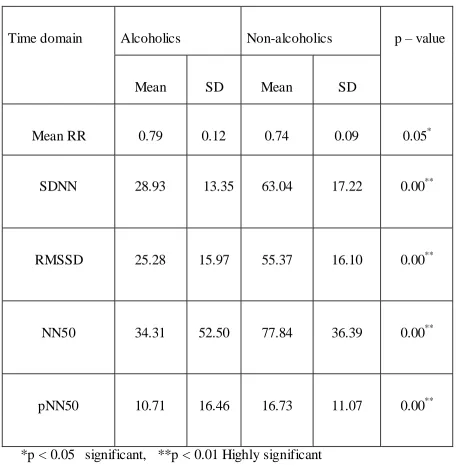
5.3 Heart Rate Variability
TIME DOMAIN INDICES
TABLE 3: Comparison of mean value of time domain indices between
alcoholic dependent subjects and non-alcoholic individuals
Time domain
Alcoholics Non-alcoholics p – value Mean SD Mean SD
Mean RR 0.79 0.12 0.74 0.09 0.05* SDNN 28.93 13.35 63.04 17.22 0.00**
RMSSD 25.28 15.97 55.37 16.10 0.00**
NN50 34.31 52.50 77.84 36.39 0.00**
Graph 2
Comparison of time domain indices between alcoholic dependent subjects and non-alcoholic individuals
From the above graph 2, the time domain indices – mean RR, SDNN, RMSSD, NN50 and pNN50 were reduced in alcohol dependent subjects than in non-alcoholicsubjects. 0.75 63.04 55.37 77.84 16.73 0.79 28.93 25.28 34.31 10.71 0 10 20 30 40 50 60 70 80 90
mean RR SDNN RMSSD NN50 pNN50
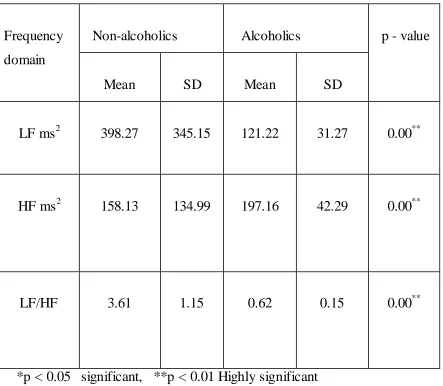
FREQUENCY DOMAIN INDICES
Table 4
Comparison of mean values of frequency domain measures between
alcohol dependent subjects and non-alcoholic individuals
Frequency domain
Non-alcoholics Alcoholics p - value Mean SD Mean SD
LF ms2 398.27 345.15 121.22 31.27 0.00**
HF ms2 158.13 134.99 197.16 42.29 0.00**
LF/HF 3.61 1.15 0.62 0.15 0.00**
Graph 3
Comparison of low frequency and high frequency domain measures
between alcoholic dependent subjects and non-alcoholic individuals
The above graph 3 depicts the increase in Low Frequency measure and a decrease in the High Frequency measure in alcohol dependent subjects when compared to non-alcoholic individuals.
121.22
197.16 398.27
158.13
0 50 100 150 200 250 300 350 400 450
LF HF
Non-alcoholics
Graph 4
Comparison of mean values of LF/HF ratio between alcohol dependent subjects and non-alcoholic individuals.
The above graph shows the increase in LF/HF measure in alcohol dependent subjects when compared to non-alcoholic individuals.
0.62
3.6
0 0.5 1 1.5 2 2.5 3 3.5 4
LF/HF
Non-alcoholics
Thus the frequency domain measure LF was increased in alcoholics than in non-alcoholics, HF was decreased in alcoholics than in non-alcoholics and the ratio of LF/HF was increased in alcoholics than in non-alcoholics. The difference in the means for all the parameters werestatistically significant.
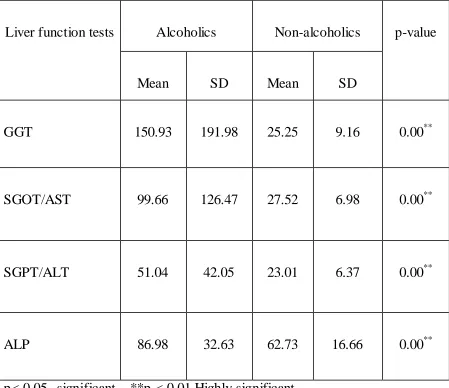
5.4 LIVER FUNCTION TEST
Table 5
Comparison of mean value of the liver function enzymes between alcohol
dependent individuals and non-alcoholic subjects
Liver function tests Alcoholics Non-alcoholics p-value Mean SD Mean SD
GGT 150.93 191.98 25.25 9.16 0.00**
SGOT/AST 99.66 126.47 27.52 6.98 0.00**
SGPT/ALT 51.04 42.05 23.01 6.37 0.00**
Graph 5
Comparison of mean values of the liver function enzymes between the
Alcohol dependent individuals and non-alcoholic subjects
The above graph depicts the increase in liver function enzymes between alcohol dependent individuals and non-alcoholic subjects.
25.25 27.52 23.01
62.73 150.93
99.66
51.04
86.98
0 20 40 60 80 100 120 140 160
GGT SGOT SGPT ALP
Non-alcoholics
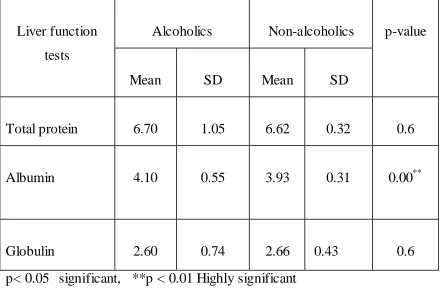
Table 6
Comparison of mean values of the liver function parameters between
alcohol dependent subjects and non-alcoholic healthy individuals
Liver function tests
Alcoholics Non-alcoholics p-value Mean SD Mean SD
Total protein 6.70 1.05 6.62 0.32 0.6 Albumin 4.10 0.55 3.93 0.31 0.00**
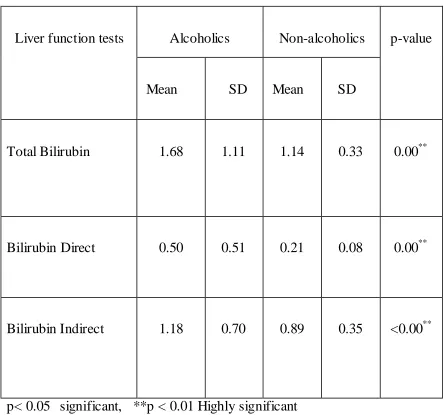
Table7
Comparison of mean values of the liver function parameters between
alcohol dependent subjects and non-alcoholic healthy individuals
Liver function tests Alcoholics Non-alcoholics p-value Mean SD Mean SD
Total Bilirubin 1.68 1.11 1.14 0.33 0.00**
Bilirubin Direct 0.50 0.51 0.21 0.08 0.00**
Bilirubin Indirect 1.18 0.70 0.89 0.35 <0.00**
Graph 6
Comparison of mean values of the liver function parameters between
alcoholic dependent subjects and non-alcoholic healthy individuals.
The above graph 6 shows the increase in bilirubin in alcohol dependent subjects when compared to non-alcoholic healthy individuals.
6.62 3.93 2.66 1.14 0.21 0.89 6.7 4.1 2.6 1.68 0.5 1.18 0 1 2 3 4 5 6 7 8
6. DISCUSSION
The aim of our study was to assess the autonomic disturbance and estimate the liver function parameters in Alcohol Dependent individuals. Heart rate variability was employed to assess the sympathetic and parasympathetic components of the autonomic nervous system . Liver function parameters were measured using automated hematology analyzer.
6.1 CHARACTERISTICS OF ALCOHOLIC GROUP AND
NON-ALCOHOLIC GROUP POPULATION
The mean age in years of Alcohol dependent individuals was 38.62 which was similar to the mean age of non-alcoholic subjects 38.71 Height in centimeters and weight in kilograms were measured . Body mass index (BMI) was calculated using the Quetlet formula – wt. in kg/ Ht in m2. The mean BMI of alcoholics was 22.61 and in non – alcoholic individuals was 23.03
117 and in
Both the alcoholic and non-alcoholic groups were age, sex (male gender), BMI and blood pressure matched and showed no significant difference in their means. Hence both the alcoholic and non-alcoholic groups were comparable.
RESTING HEART RATE
The mean resting heart rate in alcoholic individuals was 77.82 and in non-alcoholic individuals was 75.27 The resting heart rate was found to be higher in alcoholic individuals than the non-alcoholic individuals, although the difference was not significant. This was in accordance with the findings observed by J M Ryan et al,48JolantaBialkowska et al52, Ingjaldsson JT et al73, RechlinT et al74.
An increase in heart rate was observed in alcoholics and the reason for this positive association between heart rate and alcohol intake may be probably due to an increase in the sympathetic activity secondary to vasodilation or increased calcium entering into cardiac myocytes.75
6.2 HEART RATE VARIABILITY
can be used to screen subjects, who are at risk of developing cardiovascular dysfunctions.
Heart rate variability was assessed using two methods namely - Time domain and Frequency domain measures. These parameters were analyzed and compared between the alcoholic and non-alcoholic individuals.
TIME DOMAIN PARAMETERS
The parameters analyzed by Time Domain Analysis are mean RR, SDNN, RMSSD, NN50 and pNN50.41The mean values of mean RR , SDNN , RMSSD , NN50 and pNN50 in alcoholic individuals were
0.79 28.93 34.31
10.71 respectively.
In our study mean RR, SDNN and RMSSD were reduced in alcoholics compared to non-alcoholics and significant statistical difference (p<0.00) was found between the alcoholic and non-alcoholic group for these three parameters, which indicates reduced parasympathetic activity on the heart. The same finding was evidenced by Thirumaran et al,37 Simon C Malpas et al11 and Monforte R et al56 in their study.
The same results were observed by Thirumaran et al,37 Robert D.Neghru et al51 and Urooj et al in their studies.76
In the Time Domain method RMSSD, NN50 and pNN50 are specific markers of vagal activity. They were reduced showing a gross reduction in vagal activity, reflecting vagal neuropathy or reduced parasympathetic activity. R H Johnson et al did an extensive study on parasympathetic dysfunction affecting the vagus nerve in chronic heavy drinkers, who showed depressed reflex heart rate responses due to parasympathetic neuropathy. Our study supports the same indicating that alcoholic autonomic neuropathy primarily affecting the parasympathetic system than the sympathetic system.
FREQUENCY DOMAIN PARAMETERS
The parameters analyzed are LF, HF and LF/HF ratio. The meanvalues of LF and HF in ms2 was 398.27 and 158.13 134.98 respectively. The LF parameter was significantly higher (p<0.00) in alcoholic subjects when compared to non-alcoholic individuals depicting an increase in the sympathetic activity as evidenced in the study done by D Mahesh kumar et al.77
The mean LF/HF value in alcoholics was 3.61 LF/HF showed a significant increase (p<0.00) in alcoholic individuals compared to non-alcoholics. The analysis of LF/HF values indicate sympathetic – parasympathetic imbalance as observed by A. Fratini et al in his study.78
Our study, with reference to Time domain and Frequency domain measures indicate Sympatho-vagal imbalance with predominant vagal neuropathy with decreased parasympathetic activity. Our study was in favour of the studies by Thirumaran et al,37 Simon C Malpas et al,11 D Mahesh Kumar et al,77 A. Fratini et al,78 Robert D NEGRU et al,51 Bialkowska et al.52
Therefore, Cardiovascular autonomic dysfunction was found in alcohol dependent subjects. The mechanism behind vagal neuropathy include the following: Cytokines released from alcohol metabolism in the liver causes autonomic dysfunction and blunting of β-adrenergic signalling contributing to reduced HRV.45
Chronic alcohol intake causes nutritional deficiency. Chronic thiamine deficiency in alcoholics lead to nerve cells degeneration, reactive gliosis and atrophy of cerebellum and peripheral nerves including autonomic nerves. Therefore deficiency of nutritional factors is responsible for vagal neuropathy in chronic alcoholics.37
Chronic alcohol causes a direct dose dependent toxicity to the autonomic and peripheral nervous system.79,56
6.3 LIVER FUNCTION TEST
The average value of liver function test parameters in alcoholic subjects were as follows: Gamma glutamyltransferase (GGT) = 150 Serum glutamic oxaloacetic transaminase (SGOT) = 99.66 ; Serum glutamate-pyruvate transaminase (SGPT) = 51.04 42.06 ; Alkaline phosphatase (ALP) = 86.98 ; Total protein = 6.70 Albumin = 4.10 0.55; Globulin = 2.60 otal Bilirubin = 1.68 1.10; Direct Bilirubin = 0.50 0.51; Indirect Bilirubin = 1.18 0.69.
individuals. Our results were similar to the findings of Anju R et al,80Conigrave et al.69
The mean values of Alkaline phosphatase (ALP) was significantly raised (p in alcoholic subjects compared to non-alcoholics. This finding was similar to the study results of Anju R et al (2o17),80Conigrave et al,69 SubirkumarDas et al.26
The mean values of albumin showed a significant rise (p < 0.00) and our results matched with the study done by Kazukirokotoh et al.72 The average total bilirubin levels and direct bilirubin levels showed an increase in alcoholic subjects with significance (p<0.00), compared to non-alcoholic individuals. The indirect bilirubin also showed an increase in alcoholics with p-value < 0.00. Our results matched with the studies done by SubirKuma Das et al26 andAhlgren et al.28
Gamma-glutamyltransferase is a sensitive marker of alchohol intake, liver dysfunction and oxidative stress.83 It is a biliary canalicular enzyme induced by alcohol, and their serum levels rise in response to hepatocellular damage. Thus high levels of GGT in alcoholics indicate that they are at risk of suffering from liver disorders.
In alcohol dependent subjects, ALT and AST enzymes which are normally present in higher concentration in hepatocytes leak into the circulation when hepatocytes or their cell membranes are damaged. Elevated ALP is a marker for alcoholism and liver damage.26
Increased albumin was due to formation of adduct protein by acetaldehyde, which is an important product of alcohol metabolism.26,84,85 Bilirubin is metabolized, conjugated and excreted by the liver. Hence, hepatocellular damage leads to its decreased metabolism and excretion causing hyperbilirubinaemia. Elevated bilirubin level suggests cholestasis in alcoholics and hepatic dysfunction71,80
LIMITATIONS OF THE STUDY
study could have been done on various groups of alcohol dependent subjects based on their duration of alcohol intake. This would be done in our future studies.
Comparison of Heart Rate Variability and Liver Function Tests in Alcohol dependent subjects before and after alcohol abstinence, which will be done in our future study. Carbohydrate Deficient Transferase (CDT) is more specific along with GGT in detecting alcoholic subjects, which would be included in our future study.
FUTURE STUDY
1. Correlation between Heart Rate Variability and Liver Function Tests will be done in our future study.
2. The study will be conducted in different alcoholic variants based on their duration of alcohol intake, in our future study.